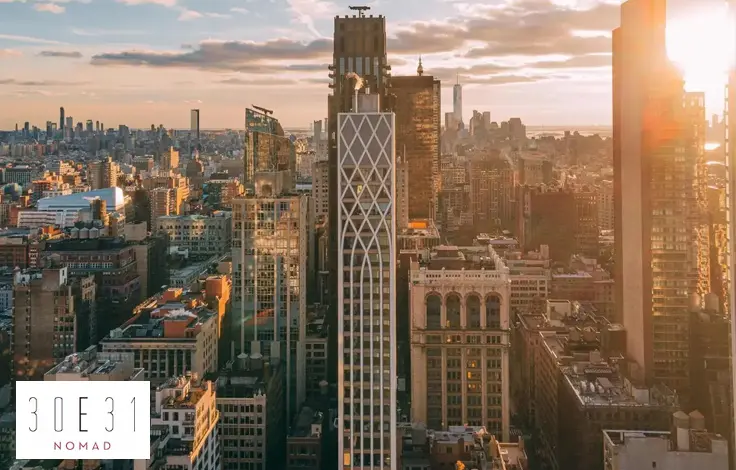
12 Beekman Place: Price Comparison
between East 50th Street & Mitchell Place View Full Building Profile
12 Beekman Place
N/A
Avg. Price
Past 12 months
Past 12 months
2023
-
2022
$1,340,000
2021
$788,125
2020
$985,000
2019
-
2018
$1,053,560
2017
$1,000,500
2016
$1,019,813
2015
$1,245,430
2014
$1,215,000
2013
$995,000
2012
$1,105,000
2011
$738,333
2010
$1,180,000
2009
$1,342,500
2008
$1,625,000
2007
$907,500
2006
$1,096,667
2005
$1,225,500
2004
$807,250
2003
$652,500
12 Beekman Place
N/A
Median Price
Past 12 months
Past 12 months
2023
-
2022
$1,340,000
2021
$800,000
2020
$985,000
2019
-
2018
$947,500
2017
$1,060,000
2016
$914,000
2015
$1,072,150
2014
$1,215,000
2013
$1,135,000
2012
$1,105,000
2011
$715,000
2010
$1,180,000
2009
$600,000
2008
$1,625,000
2007
$907,500
2006
$870,000
2005
$1,052,500
2004
$760,000
2003
$652,500
12 Beekman Place
N/A
Avg. Price
Past 12 months
Past 12 months
2023
-
2022
-
2021
-
2020
-
2019
-
2018
-
2017
-
2016
-
2015
-
2014
-
2013
-
2012
-
2011
-
2010
-
2009
-
2008
-
2007
-
2006
-
2005
-
2004
-
2003
-
12 Beekman Place
N/A
Median Price
Past 12 months
Past 12 months
2023
-
2022
-
2021
-
2020
-
2019
-
2018
-
2017
-
2016
-
2015
-
2014
-
2013
-
2012
-
2011
-
2010
-
2009
-
2008
-
2007
-
2006
-
2005
-
2004
-
2003
-
12 Beekman Place
N/A
Avg. Price
Past 12 months
Past 12 months
2023
-
2022
-
2021
$755,833
2020
$985,000
2019
-
2018
$883,119
2017
$721,250
2016
$860,000
2015
$802,500
2014
$1,350,000
2013
$925,000
2012
$565,000
2011
$715,000
2010
-
2009
$590,000
2008
-
2007
$515,000
2006
$425,000
2005
$700,000
2004
$574,500
2003
$405,000
12 Beekman Place
N/A
Median Price
Past 12 months
Past 12 months
2023
-
2022
-
2021
$750,000
2020
$985,000
2019
-
2018
$870,000
2017
$721,250
2016
$860,000
2015
$802,500
2014
$1,350,000
2013
$925,000
2012
$565,000
2011
$715,000
2010
-
2009
$590,000
2008
-
2007
$515,000
2006
$425,000
2005
$700,000
2004
$574,500
2003
$405,000
12 Beekman Place
N/A
Avg. Price
Past 12 months
Past 12 months
2023
-
2022
$1,340,000
2021
$885,000
2020
-
2019
-
2018
$1,224,000
2017
$1,186,667
2016
$1,073,083
2015
$1,540,717
2014
$1,080,000
2013
$1,135,000
2012
$1,645,000
2011
$750,000
2010
$1,180,000
2009
$2,847,500
2008
$1,625,000
2007
$1,300,000
2006
$1,432,500
2005
$1,575,833
2004
$1,040,000
2003
$900,000
12 Beekman Place
N/A
Median Price
Past 12 months
Past 12 months
2023
-
2022
$1,340,000
2021
$885,000
2020
-
2019
-
2018
$1,320,000
2017
$1,200,000
2016
$940,000
2015
$1,100,000
2014
$1,080,000
2013
$1,135,000
2012
$1,645,000
2011
$750,000
2010
$1,180,000
2009
$2,847,500
2008
$1,625,000
2007
$1,300,000
2006
$1,432,500
2005
$1,250,000
2004
$1,040,000
2003
$900,000
12 Beekman Place
N/A
Avg. Price
Past 12 months
Past 12 months
2023
-
2022
-
2021
-
2020
-
2019
-
2018
-
2017
-
2016
-
2015
-
2014
-
2013
-
2012
-
2011
-
2010
-
2009
-
2008
-
2007
-
2006
-
2005
-
2004
-
2003
-
12 Beekman Place
N/A
Median Price
Past 12 months
Past 12 months
2023
-
2022
-
2021
-
2020
-
2019
-
2018
-
2017
-
2016
-
2015
-
2014
-
2013
-
2012
-
2011
-
2010
-
2009
-
2008
-
2007
-
2006
-
2005
-
2004
-
2003
-
12 Beekman Place
N/A
Avg. Price
Past 12 months
Past 12 months
2023
-
2022
-
2021
-
2020
-
2019
-
2018
-
2017
-
2016
-
2015
-
2014
-
2013
-
2012
-
2011
-
2010
-
2009
-
2008
-
2007
-
2006
-
2005
-
2004
-
2003
-
12 Beekman Place
N/A
Median Price
Past 12 months
Past 12 months
2023
-
2022
-
2021
-
2020
-
2019
-
2018
-
2017
-
2016
-
2015
-
2014
-
2013
-
2012
-
2011
-
2010
-
2009
-
2008
-
2007
-
2006
-
2005
-
2004
-
2003
-
The Edgewater
$1,149
Avg. Price / ft2
Past 12 months
Past 12 months
$942
$706
$797
$941
$935
-
$875
$1,189
$1,167
$850
$736
$780
$813
$779
$849
$795
$628
$735
$656
$633
$576
The Edgewater
$1,731,667
Avg. Price
Past 12 months
Past 12 months
$1,514,000
$1,616,667
$945,500
$1,232,500
$2,008,750
$865,000
$1,071,750
$3,137,500
$2,354,375
$1,462,000
$900,300
$1,181,429
$1,221,250
$1,173,214
$1,090,000
$829,667
$1,091,036
$1,810,333
$1,101,083
$1,117,500
$702,750
The Edgewater
$1,700,000
Median Price
Past 12 months
Past 12 months
$1,595,000
$1,800,000
$837,500
$1,232,500
$1,675,000
$865,000
$881,000
$3,137,500
$1,750,000
$1,462,000
$891,500
$1,215,000
$1,112,500
$1,100,000
$1,122,500
$849,000
$985,000
$1,250,000
$1,156,250
$1,117,500
$677,500
The Edgewater
N/A
Avg. Price / ft2
Past 12 months
Past 12 months
-
-
-
-
-
-
-
-
-
-
-
-
-
-
-
-
-
-
-
-
-
The Edgewater
N/A
Avg. Price
Past 12 months
Past 12 months
-
-
-
-
-
-
-
-
-
-
-
-
-
-
-
-
-
-
-
-
$730,000
The Edgewater
N/A
Median Price
Past 12 months
Past 12 months
-
-
-
-
-
-
-
-
-
-
-
-
-
-
-
-
-
-
-
-
$730,000
The Edgewater
N/A
Avg. Price / ft2
Past 12 months
Past 12 months
-
-
$865
$715
-
-
-
-
$1,015
-
$751
$813
-
$797
-
$795
$623
-
-
$633
-
The Edgewater
N/A
Avg. Price
Past 12 months
Past 12 months
-
-
$865,000
$715,000
-
-
$825,000
-
$990,000
-
$825,375
$975,000
$710,000
$811,333
-
$829,667
$841,250
-
-
$760,000
$523,750
The Edgewater
N/A
Median Price
Past 12 months
Past 12 months
-
-
$865,000
$715,000
-
-
$825,000
-
$990,000
-
$825,750
$975,000
$710,000
$840,000
-
$849,000
$841,250
-
-
$760,000
$523,750
The Edgewater
$1,149
Avg. Price / ft2
Past 12 months
Past 12 months
$942
$735
$774
$1,167
-
-
$875
-
$946
$850
$706
$694
-
$743
$849
-
$632
$735
$656
-
$576
The Edgewater
$1,647,500
Avg. Price
Past 12 months
Past 12 months
$1,417,500
$1,250,000
$972,333
$1,750,000
$1,515,000
$865,000
$1,154,000
-
$1,750,000
$1,462,000
$1,200,000
$1,276,250
$1,112,500
$1,124,250
$1,046,667
-
$1,038,938
$1,015,500
$1,101,083
-
$950,000
The Edgewater
$1,647,500
Median Price
Past 12 months
Past 12 months
$1,397,500
$1,250,000
$810,000
$1,750,000
$1,515,000
$865,000
$887,000
-
$1,750,000
$1,462,000
$1,200,000
$1,275,000
$1,112,500
$1,124,250
$1,025,000
-
$1,030,000
$1,015,500
$1,156,250
-
$950,000
The Edgewater
N/A
Avg. Price / ft2
Past 12 months
Past 12 months
-
$692
-
-
$910
-
-
-
-
-
-
$799
$813
-
-
-
-
-
-
-
-
The Edgewater
$1,900,000
Avg. Price
Past 12 months
Past 12 months
$1,900,000
$1,800,000
-
-
$1,675,000
-
-
$1,875,000
-
-
-
$1,215,000
$1,950,000
$1,765,000
$1,220,000
-
$1,799,000
-
-
$1,475,000
$744,500
The Edgewater
$1,900,000
Median Price
Past 12 months
Past 12 months
$1,900,000
$1,800,000
-
-
$1,675,000
-
-
$1,875,000
-
-
-
$1,215,000
$1,950,000
$1,765,000
$1,220,000
-
$1,799,000
-
-
$1,475,000
$744,500
The Edgewater
N/A
Avg. Price / ft2
Past 12 months
Past 12 months
-
-
-
-
-
-
-
-
$1,540
-
-
-
-
-
-
-
-
-
-
-
-
The Edgewater
N/A
Avg. Price
Past 12 months
Past 12 months
-
-
-
-
-
-
-
-
$4,927,500
-
-
-
-
-
-
-
-
$3,400,000
-
-
-
The Edgewater
N/A
Median Price
Past 12 months
Past 12 months
-
-
-
-
-
-
-
-
$4,927,500
-
-
-
-
-
-
-
-
$3,400,000
-
-
-
The Edgewater
N/A
Avg. Price / ft2
Past 12 months
Past 12 months
-
-
-
-
$961
-
-
$1,189
-
-
-
-
-
-
-
-
-
-
-
-
-
The Edgewater
N/A
Avg. Price
Past 12 months
Past 12 months
-
-
-
-
$3,170,000
-
-
$4,400,000
-
-
-
-
-
-
-
-
-
-
-
-
-
The Edgewater
N/A
Median Price
Past 12 months
Past 12 months
-
-
-
-
$3,170,000
-
-
$4,400,000
-
-
-
-
-
-
-
-
-
-
-
-
-
Sutton Manor East
$829
Avg. Price / ft2
Past 12 months
Past 12 months
$763
$592
$636
$847
$731
$674
-
-
$663
$862
$699
$575
-
$595
$572
-
$939
$658
-
$499
$418
Sutton Manor East
$617,000
Avg. Price
Past 12 months
Past 12 months
$732,500
$400,000
$350,000
$890,000
$567,000
$802,500
$484,000
-
$784,167
$929,000
$824,000
$608,333
-
$595,000
$801,000
$1,392,500
$1,164,100
$695,000
$663,750
$515,500
$417,214
Sutton Manor East
$617,000
Median Price
Past 12 months
Past 12 months
$732,500
$400,000
$350,000
$995,000
$567,000
$655,000
$435,500
-
$685,000
$1,100,000
$824,000
$515,000
-
$595,000
$801,000
$1,392,500
$1,200,000
$695,000
$663,750
$515,500
$425,000
Sutton Manor East
$858
Avg. Price / ft2
Past 12 months
Past 12 months
$858
$592
$636
-
$664
-
-
-
$642
-
-
$575
-
-
-
-
-
$658
-
$327
$308
Sutton Manor East
$515,000
Avg. Price
Past 12 months
Past 12 months
$515,000
$400,000
$350,000
-
$415,000
$400,000
$407,000
-
$385,000
-
-
$345,000
-
-
-
-
$450,000
$395,000
-
$180,000
$183,500
Sutton Manor East
$515,000
Median Price
Past 12 months
Past 12 months
$515,000
$400,000
$350,000
-
$415,000
$400,000
$420,000
-
$385,000
-
-
$345,000
-
-
-
-
$450,000
$395,000
-
$180,000
$188,500
Sutton Manor East
$799
Avg. Price / ft2
Past 12 months
Past 12 months
-
-
-
$922
$799
$674
-
-
$685
$862
-
-
-
$595
-
-
$931
-
-
-
$529
Sutton Manor East
$719,000
Avg. Price
Past 12 months
Past 12 months
-
-
-
$837,500
$719,000
$655,000
$715,000
-
$685,000
$831,000
$669,000
$515,000
-
$595,000
-
-
$930,500
-
$663,750
-
$505,000
Sutton Manor East
$719,000
Median Price
Past 12 months
Past 12 months
-
-
-
$837,500
$719,000
$655,000
$715,000
-
$685,000
$831,000
$669,000
$515,000
-
$595,000
-
-
$930,500
-
$663,750
-
$505,000
Sutton Manor East
N/A
Avg. Price / ft2
Past 12 months
Past 12 months
$667
-
-
$698
-
-
-
-
-
-
$699
-
-
-
$572
-
$947
-
-
$672
-
Sutton Manor East
N/A
Avg. Price
Past 12 months
Past 12 months
$950,000
-
-
$995,000
-
$1,352,500
-
-
$1,282,500
$1,125,000
$979,000
$965,000
-
-
$801,000
$1,160,000
$1,200,000
$995,000
-
$851,000
$680,000
Sutton Manor East
N/A
Median Price
Past 12 months
Past 12 months
$950,000
-
-
$995,000
-
$1,352,500
-
-
$1,282,500
$1,125,000
$979,000
$965,000
-
-
$801,000
$1,160,000
$1,200,000
$995,000
-
$851,000
$680,000
Sutton Manor East
N/A
Avg. Price / ft2
Past 12 months
Past 12 months
-
-
-
-
-
-
-
-
-
-
-
-
-
-
-
-
-
-
-
-
-
Sutton Manor East
N/A
Avg. Price
Past 12 months
Past 12 months
-
-
-
-
-
-
-
-
-
-
-
-
-
-
-
-
-
-
-
-
-
Sutton Manor East
N/A
Median Price
Past 12 months
Past 12 months
-
-
-
-
-
-
-
-
-
-
-
-
-
-
-
-
-
-
-
-
-
Sutton Manor East
N/A
Avg. Price / ft2
Past 12 months
Past 12 months
-
-
-
-
-
-
-
-
-
-
-
-
-
-
-
-
-
-
-
-
-
Sutton Manor East
N/A
Avg. Price
Past 12 months
Past 12 months
-
-
-
-
-
-
-
-
-
-
-
-
-
-
-
$1,625,000
$2,040,000
-
-
-
-
Sutton Manor East
N/A
Median Price
Past 12 months
Past 12 months
-
-
-
-
-
-
-
-
-
-
-
-
-
-
-
$1,625,000
$2,040,000
-
-
-
-
Sutton Manor East
N/A
Avg. Price / ft2
Past 12 months
Past 12 months
-
-
-
-
-
-
-
-
-
-
-
-
-
-
-
-
-
-
-
-
-
Sutton Manor East
N/A
Avg. Price
Past 12 months
Past 12 months
-
-
-
-
-
-
-
-
-
-
-
-
-
-
-
-
-
-
-
-
-
Sutton Manor East
N/A
Median Price
Past 12 months
Past 12 months
-
-
-
-
-
-
-
-
-
-
-
-
-
-
-
-
-
-
-
-
-
Cannon Point North
$824
Avg. Price / ft2
Past 12 months
Past 12 months
$812
$787
$768
$1,123
$971
$891
$862
$904
$1,085
$973
$777
$762
$623
$848
$821
$874
$940
$859
$598
$844
$550
Cannon Point North
$999,167
Avg. Price
Past 12 months
Past 12 months
$932,857
$1,175,909
$1,382,833
$1,460,250
$1,445,000
$1,096,115
$1,366,364
$1,188,846
$1,495,167
$1,442,367
$1,128,767
$1,041,208
$1,056,150
$1,411,667
$970,050
$1,136,275
$1,223,292
$1,048,542
$1,214,491
$1,057,295
$1,234,688
Cannon Point North
$1,063,000
Median Price
Past 12 months
Past 12 months
$900,000
$1,100,000
$1,340,000
$1,460,250
$1,475,000
$980,000
$1,150,000
$1,350,000
$1,704,500
$1,300,000
$1,100,000
$1,030,375
$1,100,000
$1,175,000
$775,000
$1,180,150
$1,250,000
$920,000
$999,750
$999,000
$948,750
Cannon Point North
N/A
Avg. Price / ft2
Past 12 months
Past 12 months
-
-
-
-
-
-
-
$980
-
-
-
-
-
-
-
-
-
-
-
-
-
Cannon Point North
N/A
Avg. Price
Past 12 months
Past 12 months
-
-
-
-
-
-
-
$500,000
-
$120,000
-
-
-
-
-
-
-
-
-
-
-
Cannon Point North
N/A
Median Price
Past 12 months
Past 12 months
-
-
-
-
-
-
-
$500,000
-
$120,000
-
-
-
-
-
-
-
-
-
-
-
Cannon Point North
$810
Avg. Price / ft2
Past 12 months
Past 12 months
$845
$675
$755
-
-
$853
$880
$803
$760
-
$746
$691
$704
-
$753
$759
$747
$781
-
-
$550
Cannon Point North
$729,250
Avg. Price
Past 12 months
Past 12 months
$755,500
$662,500
$755,000
-
-
$889,571
$845,000
$826,000
$765,000
$740,000
$774,300
$708,125
$633,600
$1,050,000
$721,600
$804,800
$766,667
$796,250
-
$668,667
$550,000
Cannon Point North
$743,500
Median Price
Past 12 months
Past 12 months
$796,000
$662,500
$755,000
-
-
$925,000
$800,000
$855,000
$765,000
$740,000
$749,000
$710,000
$633,600
$1,050,000
$750,000
$820,000
$800,000
$802,500
-
$601,000
$550,000
Cannon Point North
$938
Avg. Price / ft2
Past 12 months
Past 12 months
-
$816
$764
$1,123
$971
$967
$844
$1,018
$1,194
$1,007
$801
$831
$541
$767
$1,094
$943
$1,037
$917
$714
$844
-
Cannon Point North
$1,162,625
Avg. Price
Past 12 months
Past 12 months
$1,041,500
$1,375,714
$1,212,333
$1,460,250
$1,445,000
$1,337,083
$1,335,000
$1,487,500
$1,860,250
$1,337,278
$1,283,333
$1,158,857
$1,106,750
$1,110,000
$1,591,176
$1,318,550
$1,426,978
$1,306,667
$1,170,741
$1,103,000
$908,750
Cannon Point North
$1,168,750
Median Price
Past 12 months
Past 12 months
$1,041,500
$1,325,000
$1,200,000
$1,460,250
$1,475,000
$1,305,000
$1,300,000
$1,450,000
$1,746,000
$1,300,000
$1,300,000
$1,149,000
$1,137,500
$1,137,500
$1,591,176
$1,295,000
$1,325,000
$1,310,000
$999,999
$1,020,000
$855,000
Cannon Point North
$713
Avg. Price / ft2
Past 12 months
Past 12 months
$713
-
$800
-
-
-
-
-
-
$904
$816
$838
-
$1,090
-
-
-
-
$482
-
-
Cannon Point North
$1,425,000
Avg. Price
Past 12 months
Past 12 months
$1,425,000
$1,700,000
$1,480,000
-
-
-
$3,087,275
$1,900,000
-
$2,350,000
$1,510,000
$1,550,000
$1,631,250
$2,195,834
-
-
-
-
$891,715
$1,555,125
$1,420,000
Cannon Point North
$1,425,000
Median Price
Past 12 months
Past 12 months
$1,425,000
$1,700,000
$1,480,000
-
-
-
$3,087,275
$1,900,000
-
$2,350,000
$1,510,000
$1,550,000
$1,631,250
$2,195,834
-
-
-
-
$891,715
$1,555,125
$1,420,000
Cannon Point North
N/A
Avg. Price / ft2
Past 12 months
Past 12 months
-
-
$760
-
-
-
-
-
-
-
-
-
-
-
-
-
-
-
-
-
-
Cannon Point North
N/A
Avg. Price
Past 12 months
Past 12 months
-
-
$2,425,000
-
-
-
-
-
-
-
-
-
-
-
-
-
-
-
-
-
-
Cannon Point North
N/A
Median Price
Past 12 months
Past 12 months
-
-
$2,425,000
-
-
-
-
-
-
-
-
-
-
-
-
-
-
-
-
-
-
Cannon Point North
N/A
Avg. Price / ft2
Past 12 months
Past 12 months
-
-
-
-
-
-
-
-
-
-
-
-
-
-
-
-
-
-
-
-
-
Cannon Point North
N/A
Avg. Price
Past 12 months
Past 12 months
-
-
-
-
-
-
-
-
-
$3,325,000
-
-
-
-
-
-
-
-
-
-
-
Cannon Point North
N/A
Median Price
Past 12 months
Past 12 months
-
-
-
-
-
-
-
-
-
$3,325,000
-
-
-
-
-
-
-
-
-
-
-
Southgate
$788
Avg. Price / ft2
Past 12 months
Past 12 months
$742
-
$838
$756
$765
$825
$886
$1,218
$650
$731
$849
$750
$568
$736
$639
$744
$841
$688
$685
-
$696
Southgate
$1,023,333
Avg. Price
Past 12 months
Past 12 months
$515,000
$590,000
$1,675,000
$680,000
$837,188
$855,019
$786,250
$1,552,000
$726,333
$759,233
$860,400
$853,200
$540,000
$960,000
$693,750
$648,103
$755,356
$1,020,000
$520,509
$639,611
$943,333
Southgate
$1,125,000
Median Price
Past 12 months
Past 12 months
$515,000
$590,000
$1,675,000
$680,000
$687,500
$835,038
$680,000
$1,552,000
$739,000
$575,000
$929,000
$551,000
$540,000
$960,000
$742,500
$603,705
$523,294
$1,210,000
$473,028
$745,000
$450,000
Southgate
N/A
Avg. Price / ft2
Past 12 months
Past 12 months
-
-
-
-
-
$825
-
-
$650
$617
-
-
-
-
$583
-
$665
-
-
-
-
Southgate
N/A
Avg. Price
Past 12 months
Past 12 months
-
-
-
-
-
$495,000
-
-
$390,000
$375,000
-
-
-
-
$350,000
-
$399,500
-
$338,500
-
-
Southgate
N/A
Median Price
Past 12 months
Past 12 months
-
-
-
-
-
$495,000
-
-
$390,000
$375,000
-
-
-
-
$350,000
-
$399,500
-
$338,500
-
-
Southgate
$742
Avg. Price / ft2
Past 12 months
Past 12 months
$742
-
-
$756
$676
-
$808
$902
-
$673
$849
-
$568
-
$694
$732
$832
$688
-
-
-
Southgate
$515,000
Avg. Price
Past 12 months
Past 12 months
$515,000
$590,000
-
$680,000
$625,000
-
$615,000
$805,000
$739,000
$583,800
$617,500
$570,000
$540,000
-
$625,000
$539,137
$646,588
$550,000
$561,055
-
$440,000
Southgate
$515,000
Median Price
Past 12 months
Past 12 months
$515,000
$590,000
-
$680,000
$655,000
-
$590,000
$805,000
$739,000
$575,000
$617,500
$570,000
$540,000
-
$625,000
$515,000
$646,588
$550,000
$561,055
-
$440,000
Southgate
$833
Avg. Price / ft2
Past 12 months
Past 12 months
-
-
-
-
$945
-
$963
-
-
$1,080
-
-
-
$736
-
$780
$1,027
-
$685
-
-
Southgate
$1,125,000
Avg. Price
Past 12 months
Past 12 months
-
-
-
-
$1,190,833
$1,187,538
$1,300,000
-
$1,050,000
$1,350,000
$1,022,333
$551,000
-
$960,000
$900,000
$975,000
$1,368,275
$1,255,000
$925,000
$822,500
-
Southgate
$1,125,000
Median Price
Past 12 months
Past 12 months
-
-
-
-
$1,235,000
$1,187,538
$1,300,000
-
$1,050,000
$1,350,000
$998,000
$551,000
-
$960,000
$900,000
$975,000
$1,368,275
$1,255,000
$925,000
$822,500
-
Southgate
N/A
Avg. Price / ft2
Past 12 months
Past 12 months
-
-
$838
-
-
-
-
$1,533
-
-
-
$750
-
-
-
-
-
-
-
-
$696
Southgate
$1,430,000
Avg. Price
Past 12 months
Past 12 months
-
-
$1,675,000
-
-
-
-
$2,299,000
-
$1,814,100
-
$2,100,000
-
-
-
-
-
-
-
-
$1,950,000
Southgate
$1,430,000
Median Price
Past 12 months
Past 12 months
-
-
$1,675,000
-
-
-
-
$2,299,000
-
$1,814,100
-
$2,100,000
-
-
-
-
-
-
-
-
$1,950,000
Southgate
N/A
Avg. Price / ft2
Past 12 months
Past 12 months
-
-
-
-
-
-
-
-
-
-
-
-
-
-
-
-
-
-
-
-
-
Southgate
N/A
Avg. Price
Past 12 months
Past 12 months
-
-
-
-
-
-
-
-
-
-
-
-
-
-
-
-
-
-
-
-
-
Southgate
N/A
Median Price
Past 12 months
Past 12 months
-
-
-
-
-
-
-
-
-
-
-
-
-
-
-
-
-
-
-
-
-
Southgate
N/A
Avg. Price / ft2
Past 12 months
Past 12 months
-
-
-
-
-
-
-
-
-
-
-
-
-
-
-
-
-
-
-
-
-
Southgate
N/A
Avg. Price
Past 12 months
Past 12 months
-
-
-
-
-
-
-
-
-
-
-
-
-
-
-
-
-
-
-
-
-
Southgate
N/A
Median Price
Past 12 months
Past 12 months
-
-
-
-
-
-
-
-
-
-
-
-
-
-
-
-
-
-
-
-
-
36 Sutton Place South
$776
Avg. Price / ft2
Past 12 months
Past 12 months
$776
-
$931
$648
-
-
$904
$877
$839
$687
$580
$756
$776
$787
$593
$673
-
$683
$706
-
-
36 Sutton Place South
$665,000
Avg. Price
Past 12 months
Past 12 months
$665,000
-
$1,350,000
$907,200
-
$1,307,333
$908,333
$1,164,000
$1,538,833
$960,000
$817,143
$990,000
$757,500
$957,500
$689,300
$609,067
$610,000
$807,789
$675,000
$700,000
$802,500
36 Sutton Place South
$645,000
Median Price
Past 12 months
Past 12 months
$645,000
-
$1,350,000
$907,200
-
$1,310,000
$907,500
$1,160,000
$887,500
$825,000
$795,000
$1,030,000
$757,500
$957,500
$600,000
$635,700
$610,000
$683,100
$625,000
$700,000
$802,500
36 Sutton Place South
N/A
Avg. Price / ft2
Past 12 months
Past 12 months
-
-
-
-
-
-
-
-
-
-
-
-
-
-
-
-
-
-
-
-
-
36 Sutton Place South
$370,000
Avg. Price
Past 12 months
Past 12 months
$370,000
-
-
-
-
-
-
-
-
-
-
-
-
-
$350,000
-
-
-
-
-
-
36 Sutton Place South
$370,000
Median Price
Past 12 months
Past 12 months
$370,000
-
-
-
-
-
-
-
-
-
-
-
-
-
$350,000
-
-
-
-
-
-
36 Sutton Place South
$759
Avg. Price / ft2
Past 12 months
Past 12 months
$759
-
-
-
-
-
$904
-
$839
$687
$580
$720
-
$720
$555
$636
-
$712
$706
-
-
36 Sutton Place South
$601,667
Avg. Price
Past 12 months
Past 12 months
$601,667
-
-
-
-
-
$767,500
$825,000
$838,750
$807,500
$651,667
$720,000
$390,000
$720,000
$565,000
$487,350
$610,000
$611,850
$620,000
-
-
36 Sutton Place South
$645,000
Median Price
Past 12 months
Past 12 months
$645,000
-
-
-
-
-
$842,500
$825,000
$840,000
$807,500
$580,000
$720,000
$390,000
$720,000
$565,000
$487,350
$610,000
$622,500
$625,000
-
-
36 Sutton Place South
$793
Avg. Price / ft2
Past 12 months
Past 12 months
$793
-
$931
$648
-
-
-
$877
-
-
-
$792
$776
$854
$668
$710
-
$729
-
-
-
36 Sutton Place South
$1,150,000
Avg. Price
Past 12 months
Past 12 months
$1,150,000
-
$1,350,000
$907,200
-
$1,307,333
$1,190,000
$1,248,750
-
$1,265,000
$941,250
$1,125,000
$1,125,000
$1,195,000
$983,250
$852,500
-
$999,500
$950,000
$700,000
$802,500
36 Sutton Place South
$1,150,000
Median Price
Past 12 months
Past 12 months
$1,150,000
-
$1,350,000
$907,200
-
$1,310,000
$1,190,000
$1,247,500
-
$1,265,000
$980,000
$1,125,000
$1,125,000
$1,195,000
$983,250
$852,500
-
$999,500
$950,000
$700,000
$802,500
36 Sutton Place South
N/A
Avg. Price / ft2
Past 12 months
Past 12 months
-
-
-
-
-
-
-
-
-
-
-
-
-
-
-
-
-
$533
-
-
-
36 Sutton Place South
N/A
Avg. Price
Past 12 months
Past 12 months
-
-
-
-
-
-
-
-
$2,939,000
-
-
-
-
-
-
-
-
$1,600,000
-
-
-
36 Sutton Place South
N/A
Median Price
Past 12 months
Past 12 months
-
-
-
-
-
-
-
-
$2,939,000
-
-
-
-
-
-
-
-
$1,600,000
-
-
-
36 Sutton Place South
N/A
Avg. Price / ft2
Past 12 months
Past 12 months
-
-
-
-
-
-
-
-
-
-
-
-
-
-
-
-
-
-
-
-
-
36 Sutton Place South
N/A
Avg. Price
Past 12 months
Past 12 months
-
-
-
-
-
-
-
-
-
-
-
-
-
-
-
-
-
-
-
-
-
36 Sutton Place South
N/A
Median Price
Past 12 months
Past 12 months
-
-
-
-
-
-
-
-
-
-
-
-
-
-
-
-
-
-
-
-
-
36 Sutton Place South
N/A
Avg. Price / ft2
Past 12 months
Past 12 months
-
-
-
-
-
-
-
-
-
-
-
-
-
-
-
-
-
-
-
-
-
36 Sutton Place South
N/A
Avg. Price
Past 12 months
Past 12 months
-
-
-
-
-
-
-
-
-
-
-
-
-
-
-
-
-
-
-
-
-
36 Sutton Place South
N/A
Median Price
Past 12 months
Past 12 months
-
-
-
-
-
-
-
-
-
-
-
-
-
-
-
-
-
-
-
-
-
Sutton Gardens
$728
Avg. Price / ft2
Past 12 months
Past 12 months
$801
$743
$654
$734
$899
$805
$847
$774
$779
$704
$705
$527
$626
$606
-
$785
$705
$718
$726
$568
$468
Sutton Gardens
$650,739
Avg. Price
Past 12 months
Past 12 months
$701,500
$627,224
$497,154
$793,299
$874,554
$732,196
$806,139
$630,809
$907,266
$726,460
$622,659
$629,700
$614,246
$423,500
$361,500
$700,056
$595,938
$607,859
$689,677
$465,267
$394,022
Sutton Gardens
$695,151
Median Price
Past 12 months
Past 12 months
$725,000
$660,000
$485,000
$610,000
$874,554
$707,378
$680,000
$636,000
$866,798
$670,000
$633,500
$618,653
$599,000
$335,000
$361,500
$655,000
$630,000
$590,011
$627,000
$480,737
$406,144
Sutton Gardens
$676
Avg. Price / ft2
Past 12 months
Past 12 months
$676
$650
$712
$796
-
-
$804
$716
$637
$781
$544
$563
-
$604
-
-
$663
$611
-
$502
$423
Sutton Gardens
$366,500
Avg. Price
Past 12 months
Past 12 months
$366,500
$407,455
$380,000
$431,457
-
-
$441,100
$398,167
$345,000
$410,117
$299,000
$305,000
-
$330,000
-
-
$375,000
$336,000
$350,000
$338,314
$245,200
Sutton Gardens
$366,500
Median Price
Past 12 months
Past 12 months
$366,500
$420,000
$380,000
$431,457
-
-
$445,000
$400,000
$345,000
$410,117
$299,000
$305,000
-
$330,000
-
-
$375,000
$336,000
$350,000
$293,750
$245,200
Sutton Gardens
$767
Avg. Price / ft2
Past 12 months
Past 12 months
$851
$701
$634
$763
$899
$805
$868
$803
$779
$654
$709
$607
$626
$610
-
$756
$733
$724
$728
$588
$480
Sutton Gardens
$667,030
Avg. Price
Past 12 months
Past 12 months
$758,400
$645,850
$536,205
$708,750
$874,554
$732,196
$806,698
$718,050
$784,532
$600,692
$640,548
$593,583
$534,031
$563,750
$558,000
$642,223
$664,000
$597,588
$626,693
$524,721
$409,415
Sutton Gardens
$695,151
Median Price
Past 12 months
Past 12 months
$725,000
$665,050
$512,000
$708,750
$874,554
$707,378
$781,647
$650,932
$858,595
$665,000
$633,500
$593,583
$490,000
$563,750
$558,000
$640,000
$655,000
$586,096
$608,506
$516,620
$406,144
Sutton Gardens
$725
Avg. Price / ft2
Past 12 months
Past 12 months
$725
$893
-
$482
-
-
-
-
$923
$871
$846
-
$624
-
-
$843
-
$757
$721
$637
-
Sutton Gardens
$752,500
Avg. Price
Past 12 months
Past 12 months
$752,500
$901,000
-
$467,539
-
-
$783,000
-
$895,000
$1,114,637
$821,094
-
$895,000
-
-
$835,000
-
$784,875
$920,889
$585,963
-
Sutton Gardens
$752,500
Median Price
Past 12 months
Past 12 months
$752,500
$901,000
-
$467,539
-
-
$783,000
-
$895,000
$1,114,637
$821,094
-
$895,000
-
-
$835,000
-
$784,875
$886,057
$585,963
-
Sutton Gardens
N/A
Avg. Price / ft2
Past 12 months
Past 12 months
-
-
-
$868
-
-
-
-
-
$808
-
$329
-
-
-
-
-
-
-
-
-
Sutton Gardens
N/A
Avg. Price
Past 12 months
Past 12 months
-
-
-
$1,650,000
-
-
-
-
$1,850,000
$1,535,000
-
$625,000
-
-
-
-
-
-
-
-
-
Sutton Gardens
N/A
Median Price
Past 12 months
Past 12 months
-
-
-
$1,650,000
-
-
-
-
$1,850,000
$1,535,000
-
$625,000
-
-
-
-
-
-
-
-
-
Sutton Gardens
N/A
Avg. Price / ft2
Past 12 months
Past 12 months
-
-
-
-
-
-
-
-
-
-
-
-
-
-
-
-
-
-
-
-
-
Sutton Gardens
N/A
Avg. Price
Past 12 months
Past 12 months
-
-
-
-
-
-
$2,650,000
-
-
-
-
-
-
-
-
-
-
-
-
-
-
Sutton Gardens
N/A
Median Price
Past 12 months
Past 12 months
-
-
-
-
-
-
$2,650,000
-
-
-
-
-
-
-
-
-
-
-
-
-
-
Sutton Gardens
N/A
Avg. Price / ft2
Past 12 months
Past 12 months
-
-
-
-
-
-
-
-
-
-
-
-
-
-
-
-
-
-
-
-
-
Sutton Gardens
N/A
Avg. Price
Past 12 months
Past 12 months
-
-
-
-
-
-
-
-
-
-
-
-
-
-
-
-
-
-
-
-
-
Sutton Gardens
N/A
Median Price
Past 12 months
Past 12 months
-
-
-
-
-
-
-
-
-
-
-
-
-
-
-
-
-
-
-
-
-
14 Sutton Place South
N/A
Avg. Price / ft2
Past 12 months
Past 12 months
-
$988
-
$764
-
$812
-
$1,331
$972
-
$1,039
-
$1,188
-
$767
$857
$966
-
$888
$857
-
14 Sutton Place South
$1,400,000
Avg. Price
Past 12 months
Past 12 months
$1,400,000
$1,560,000
-
$1,375,000
$975,000
$1,265,525
$878,500
$1,747,500
$1,082,556
$1,176,167
$2,536,000
$993,750
$1,262,500
-
$956,250
$1,200,000
$1,037,500
$1,193,456
$1,528,571
$764,571
-
14 Sutton Place South
$1,400,000
Median Price
Past 12 months
Past 12 months
$1,400,000
$1,560,000
-
$1,375,000
$975,000
$1,265,525
$878,500
$1,747,500
$1,175,000
$737,500
$1,135,000
$985,000
$1,262,500
-
$907,500
$1,200,000
$1,057,500
$1,015,368
$985,000
$825,000
-
14 Sutton Place South
N/A
Avg. Price / ft2
Past 12 months
Past 12 months
-
-
-
-
-
-
-
-
-
-
-
-
-
-
-
-
-
-
-
-
-
14 Sutton Place South
N/A
Avg. Price
Past 12 months
Past 12 months
-
-
-
-
-
-
-
-
-
-
-
-
-
-
-
-
-
-
-
-
-
14 Sutton Place South
N/A
Median Price
Past 12 months
Past 12 months
-
-
-
-
-
-
-
-
-
-
-
-
-
-
-
-
-
-
-
-
-
14 Sutton Place South
N/A
Avg. Price / ft2
Past 12 months
Past 12 months
-
-
-
-
-
-
-
$1,331
-
-
$1,039
-
$1,188
-
$767
-
$966
-
-
-
-
14 Sutton Place South
N/A
Avg. Price
Past 12 months
Past 12 months
-
-
-
-
$975,000
-
$878,500
$1,065,000
$723,250
$708,000
$825,000
$795,000
$950,000
-
$675,000
$900,000
$772,500
$785,000
$750,000
$465,000
-
14 Sutton Place South
N/A
Median Price
Past 12 months
Past 12 months
-
-
-
-
$975,000
-
$878,500
$1,065,000
$696,500
$710,000
$825,000
$795,000
$950,000
-
$675,000
$900,000
$772,500
$785,000
$750,000
$465,000
-
14 Sutton Place South
N/A
Avg. Price / ft2
Past 12 months
Past 12 months
-
$988
-
$764
-
$812
-
-
$972
-
-
-
-
-
-
$857
-
-
$888
$857
-
14 Sutton Place South
$1,400,000
Avg. Price
Past 12 months
Past 12 months
$1,400,000
$1,560,000
-
$1,375,000
-
$1,265,525
-
-
$1,370,000
$1,900,000
$1,265,000
$1,060,000
$1,575,000
-
$1,237,500
$1,500,000
$1,302,500
$1,397,684
$1,025,000
$814,500
-
14 Sutton Place South
$1,400,000
Median Price
Past 12 months
Past 12 months
$1,400,000
$1,560,000
-
$1,375,000
-
$1,265,525
-
-
$1,300,000
$1,900,000
$1,265,000
$1,020,000
$1,575,000
-
$1,237,500
$1,500,000
$1,302,500
$1,397,684
$1,025,000
$887,500
-
14 Sutton Place South
N/A
Avg. Price / ft2
Past 12 months
Past 12 months
-
-
-
-
-
-
-
-
-
-
-
-
-
-
-
-
-
-
-
-
-
14 Sutton Place South
N/A
Avg. Price
Past 12 months
Past 12 months
-
-
-
-
-
-
-
$2,430,000
-
$2,325,000
-
-
-
-
-
-
-
-
$3,200,000
-
-
14 Sutton Place South
N/A
Median Price
Past 12 months
Past 12 months
-
-
-
-
-
-
-
$2,430,000
-
$2,325,000
-
-
-
-
-
-
-
-
$3,200,000
-
-
14 Sutton Place South
N/A
Avg. Price / ft2
Past 12 months
Past 12 months
-
-
-
-
-
-
-
-
-
-
-
-
-
-
-
-
-
-
-
-
-
14 Sutton Place South
N/A
Avg. Price
Past 12 months
Past 12 months
-
-
-
-
-
-
-
-
-
-
$8,500,000
-
-
-
-
-
-
-
-
-
-
14 Sutton Place South
N/A
Median Price
Past 12 months
Past 12 months
-
-
-
-
-
-
-
-
-
-
$8,500,000
-
-
-
-
-
-
-
-
-
-
14 Sutton Place South
N/A
Avg. Price / ft2
Past 12 months
Past 12 months
-
-
-
-
-
-
-
-
-
-
-
-
-
-
-
-
-
-
-
-
-
14 Sutton Place South
N/A
Avg. Price
Past 12 months
Past 12 months
-
-
-
-
-
-
-
-
-
-
-
-
-
-
-
-
-
-
-
-
-
14 Sutton Place South
N/A
Median Price
Past 12 months
Past 12 months
-
-
-
-
-
-
-
-
-
-
-
-
-
-
-
-
-
-
-
-
-
Beekman Terrace
N/A
Avg. Price / ft2
Past 12 months
Past 12 months
-
-
-
-
-
-
-
-
-
-
-
$786
-
-
-
-
-
-
-
-
-
Beekman Terrace
$500,000
Avg. Price
Past 12 months
Past 12 months
$812,500
$2,100,000
-
-
-
$2,293,438
-
$1,385,000
$1,027,500
$840,000
$1,220,143
$550,000
$905,000
-
$1,800,000
-
$2,175,000
$866,667
$525,000
$998,333
$1,247,400
Beekman Terrace
$500,000
Median Price
Past 12 months
Past 12 months
$812,500
$2,100,000
-
-
-
$2,293,438
-
$1,015,000
$1,027,500
$840,000
$825,000
$550,000
$905,000
-
$1,800,000
-
$2,175,000
$675,000
$525,000
$1,100,000
$1,247,400
Beekman Terrace
N/A
Avg. Price / ft2
Past 12 months
Past 12 months
-
-
-
-
-
-
-
-
-
-
-
-
-
-
-
-
-
-
-
-
-
Beekman Terrace
N/A
Avg. Price
Past 12 months
Past 12 months
-
-
-
-
-
-
-
-
-
-
-
-
-
-
-
-
-
-
-
-
-
Beekman Terrace
N/A
Median Price
Past 12 months
Past 12 months
-
-
-
-
-
-
-
-
-
-
-
-
-
-
-
-
-
-
-
-
-
Beekman Terrace
N/A
Avg. Price / ft2
Past 12 months
Past 12 months
-
-
-
-
-
-
-
-
-
-
-
$786
-
-
-
-
-
-
-
-
-
Beekman Terrace
$500,000
Avg. Price
Past 12 months
Past 12 months
$500,000
-
-
-
-
-
-
$890,000
-
-
$588,667
$550,000
-
-
-
-
$650,000
$637,500
$525,000
$1,125,000
-
Beekman Terrace
$500,000
Median Price
Past 12 months
Past 12 months
$500,000
-
-
-
-
-
-
$890,000
-
-
$581,000
$550,000
-
-
-
-
$650,000
$637,500
$525,000
$1,125,000
-
Beekman Terrace
N/A
Avg. Price / ft2
Past 12 months
Past 12 months
-
-
-
-
-
-
-
-
-
-
-
-
-
-
-
-
-
-
-
-
-
Beekman Terrace
N/A
Avg. Price
Past 12 months
Past 12 months
$1,125,000
-
-
-
-
$2,500,000
-
$1,015,000
$1,027,500
$840,000
$1,162,500
-
$905,000
-
-
-
-
$1,325,000
-
$935,000
$1,247,400
Beekman Terrace
N/A
Median Price
Past 12 months
Past 12 months
$1,125,000
-
-
-
-
$2,500,000
-
$1,015,000
$1,027,500
$840,000
$1,162,500
-
$905,000
-
-
-
-
$1,325,000
-
$935,000
$1,247,400
Beekman Terrace
N/A
Avg. Price / ft2
Past 12 months
Past 12 months
-
-
-
-
-
-
-
-
-
-
-
-
-
-
-
-
-
-
-
-
-
Beekman Terrace
N/A
Avg. Price
Past 12 months
Past 12 months
-
$2,100,000
-
-
-
$2,086,875
-
$2,250,000
-
-
$2,225,000
-
-
-
$1,800,000
-
$3,700,000
-
-
-
-
Beekman Terrace
N/A
Median Price
Past 12 months
Past 12 months
-
$2,100,000
-
-
-
$2,086,875
-
$2,250,000
-
-
$2,225,000
-
-
-
$1,800,000
-
$3,700,000
-
-
-
-
Beekman Terrace
N/A
Avg. Price / ft2
Past 12 months
Past 12 months
-
-
-
-
-
-
-
-
-
-
-
-
-
-
-
-
-
-
-
-
-
Beekman Terrace
N/A
Avg. Price
Past 12 months
Past 12 months
-
-
-
-
-
-
-
-
-
-
-
-
-
-
-
-
-
-
-
-
-
Beekman Terrace
N/A
Median Price
Past 12 months
Past 12 months
-
-
-
-
-
-
-
-
-
-
-
-
-
-
-
-
-
-
-
-
-
Beekman Terrace
N/A
Avg. Price / ft2
Past 12 months
Past 12 months
-
-
-
-
-
-
-
-
-
-
-
-
-
-
-
-
-
-
-
-
-
Beekman Terrace
N/A
Avg. Price
Past 12 months
Past 12 months
-
-
-
-
-
-
-
-
-
-
-
-
-
-
-
-
-
-
-
-
-
Beekman Terrace
N/A
Median Price
Past 12 months
Past 12 months
-
-
-
-
-
-
-
-
-
-
-
-
-
-
-
-
-
-
-
-
-
444 East 52nd Street
N/A
Avg. Price / ft2
Past 12 months
Past 12 months
$1,000
$766
-
-
$829
$1,015
-
$750
-
$708
$857
$500
$606
-
-
-
-
-
$663
$431
-
444 East 52nd Street
$1,600,000
Avg. Price
Past 12 months
Past 12 months
$1,190,000
$1,016,667
-
$995,000
$995,000
$1,545,000
$681,667
$900,000
$534,750
$970,667
$1,113,568
$377,500
$733,333
-
-
$995,000
$3,112,500
$475,000
$546,333
$512,933
$711,300
444 East 52nd Street
$1,600,000
Median Price
Past 12 months
Past 12 months
$1,400,000
$555,000
-
$995,000
$995,000
$1,235,000
$430,000
$900,000
$534,750
$996,000
$997,000
$377,500
$925,000
-
-
$995,000
$3,112,500
$475,000
$545,000
$490,000
$378,000
444 East 52nd Street
N/A
Avg. Price / ft2
Past 12 months
Past 12 months
-
-
-
-
-
-
-
-
-
-
-
-
-
-
-
-
-
-
-
-
-
444 East 52nd Street
N/A
Avg. Price
Past 12 months
Past 12 months
-
-
-
-
-
-
-
-
-
-
-
-
$300,000
-
-
-
-
-
$299,000
-
-
444 East 52nd Street
N/A
Median Price
Past 12 months
Past 12 months
-
-
-
-
-
-
-
-
-
-
-
-
$300,000
-
-
-
-
-
$299,000
-
-
444 East 52nd Street
N/A
Avg. Price / ft2
Past 12 months
Past 12 months
-
$625
-
-
-
-
-
-
-
$708
-
$500
-
-
-
-
-
-
-
$613
-
444 East 52nd Street
N/A
Avg. Price
Past 12 months
Past 12 months
$490,000
$527,500
-
-
-
-
$422,500
-
$534,750
$566,000
$537,000
$377,500
-
-
-
-
-
$475,000
$545,000
$490,000
$327,167
444 East 52nd Street
N/A
Median Price
Past 12 months
Past 12 months
$490,000
$527,500
-
-
-
-
$422,500
-
$534,750
$566,000
$537,000
$377,500
-
-
-
-
-
$475,000
$545,000
$490,000
$330,000
444 East 52nd Street
N/A
Avg. Price / ft2
Past 12 months
Past 12 months
-
-
-
-
$829
$1,029
-
$750
-
-
$831
-
$606
-
-
-
-
-
$663
$249
-
444 East 52nd Street
$1,400,000
Avg. Price
Past 12 months
Past 12 months
$1,400,000
-
-
$995,000
$995,000
$1,217,500
$1,200,000
$900,000
-
$1,173,000
$1,028,667
-
$950,000
-
-
$995,000
-
-
$795,000
$524,399
$825,000
444 East 52nd Street
$1,400,000
Median Price
Past 12 months
Past 12 months
$1,400,000
-
-
$995,000
$995,000
$1,217,500
$1,200,000
$900,000
-
$1,173,000
$997,000
-
$950,000
-
-
$995,000
-
-
$795,000
$524,399
$825,000
444 East 52nd Street
N/A
Avg. Price / ft2
Past 12 months
Past 12 months
$1,000
$907
-
-
-
$1,000
-
-
-
-
$884
-
-
-
-
-
-
-
-
-
-
444 East 52nd Street
N/A
Avg. Price
Past 12 months
Past 12 months
$1,680,000
$1,995,000
-
-
-
$2,200,000
-
-
-
-
$1,944,840
-
-
-
-
-
$3,112,500
-
-
-
$1,750,000
444 East 52nd Street
N/A
Median Price
Past 12 months
Past 12 months
$1,680,000
$1,995,000
-
-
-
$2,200,000
-
-
-
-
$1,944,840
-
-
-
-
-
$3,112,500
-
-
-
$1,750,000
444 East 52nd Street
N/A
Avg. Price / ft2
Past 12 months
Past 12 months
-
-
-
-
-
-
-
-
-
-
-
-
-
-
-
-
-
-
-
-
-
444 East 52nd Street
N/A
Avg. Price
Past 12 months
Past 12 months
-
-
-
-
-
-
-
-
-
-
-
-
-
-
-
-
-
-
-
-
-
444 East 52nd Street
N/A
Median Price
Past 12 months
Past 12 months
-
-
-
-
-
-
-
-
-
-
-
-
-
-
-
-
-
-
-
-
-
444 East 52nd Street
N/A
Avg. Price / ft2
Past 12 months
Past 12 months
-
-
-
-
-
-
-
-
-
-
-
-
-
-
-
-
-
-
-
-
-
444 East 52nd Street
N/A
Avg. Price
Past 12 months
Past 12 months
-
-
-
-
-
-
-
-
-
-
-
-
-
-
-
-
-
-
-
-
-
444 East 52nd Street
N/A
Median Price
Past 12 months
Past 12 months
-
-
-
-
-
-
-
-
-
-
-
-
-
-
-
-
-
-
-
-
-
Southgate
N/A
Avg. Price / ft2
Past 12 months
Past 12 months
-
-
$836
$947
$990
$813
$905
$824
-
$806
-
$835
$712
$693
$853
-
$844
$920
$625
$578
$536
Southgate
$2,205,000
Avg. Price
Past 12 months
Past 12 months
$2,765,000
-
$937,500
$1,297,500
$850,000
$856,833
$1,045,000
$714,069
$1,291,875
$601,000
$610,656
$961,250
$874,451
$485,000
$683,750
$500,000
$774,572
$1,684,857
$566,667
$457,523
$479,853
Southgate
$1,147,500
Median Price
Past 12 months
Past 12 months
$1,660,000
-
$1,015,000
$1,297,500
$850,000
$675,000
$740,000
$718,138
$1,291,875
$650,000
$588,313
$995,000
$865,000
$485,000
$690,000
$500,000
$774,572
$1,150,000
$545,000
$487,800
$439,000
Southgate
N/A
Avg. Price / ft2
Past 12 months
Past 12 months
-
-
-
-
-
-
-
-
-
-
-
-
-
-
-
-
-
$681
$638
-
-
Southgate
N/A
Avg. Price
Past 12 months
Past 12 months
-
-
-
-
-
-
-
-
-
-
$316,000
-
-
-
-
-
-
$395,000
$435,000
-
$214,968
Southgate
N/A
Median Price
Past 12 months
Past 12 months
-
-
-
-
-
-
-
-
-
-
$316,000
-
-
-
-
-
-
$395,000
$370,000
-
$214,968
Southgate
N/A
Avg. Price / ft2
Past 12 months
Past 12 months
-
-
$758
-
$990
$813
$767
$824
-
$806
-
-
$683
$693
-
-
$844
$688
$514
$578
$546
Southgate
$580,000
Avg. Price
Past 12 months
Past 12 months
$635,000
-
$617,500
-
$850,000
$594,000
$633,333
$714,069
-
$601,000
$588,313
-
$544,667
$485,000
$605,000
$500,000
$774,572
$464,500
$430,000
$457,523
$426,667
Southgate
$580,000
Median Price
Past 12 months
Past 12 months
$635,000
-
$617,500
-
$850,000
$617,500
$595,000
$718,138
-
$650,000
$588,313
-
$601,500
$485,000
$605,000
$500,000
$774,572
$464,500
$400,000
$487,800
$390,000
Southgate
N/A
Avg. Price / ft2
Past 12 months
Past 12 months
-
-
$914
$959
-
-
-
-
-
-
-
$835
$740
-
$853
-
-
$920
$835
-
$516
Southgate
N/A
Avg. Price
Past 12 months
Past 12 months
-
-
$1,257,500
$815,000
-
$1,382,500
$1,200,000
-
$1,291,875
-
$950,000
$961,250
$1,121,789
-
$762,500
-
-
$2,987,500
$835,000
-
$621,333
Southgate
N/A
Median Price
Past 12 months
Past 12 months
-
-
$1,257,500
$815,000
-
$1,382,500
$1,200,000
-
$1,291,875
-
$950,000
$995,000
$1,011,078
-
$762,500
-
-
$2,987,500
$710,000
-
$650,000
Southgate
N/A
Avg. Price / ft2
Past 12 months
Past 12 months
-
-
-
$934
-
-
$1,181
-
-
-
-
-
-
-
-
-
-
$1,389
-
-
-
Southgate
$6,000,000
Avg. Price
Past 12 months
Past 12 months
$6,000,000
-
-
$1,780,000
-
-
$2,125,000
-
-
-
-
-
-
-
-
-
-
$2,247,500
-
-
-
Southgate
$6,000,000
Median Price
Past 12 months
Past 12 months
$6,000,000
-
-
$1,780,000
-
-
$2,125,000
-
-
-
-
-
-
-
-
-
-
$2,247,500
-
-
-
Southgate
N/A
Avg. Price / ft2
Past 12 months
Past 12 months
-
-
-
-
-
-
-
-
-
-
-
-
-
-
-
-
-
-
-
-
-
Southgate
N/A
Avg. Price
Past 12 months
Past 12 months
-
-
-
-
-
-
-
-
-
-
-
-
-
-
-
-
-
-
-
-
-
Southgate
N/A
Median Price
Past 12 months
Past 12 months
-
-
-
-
-
-
-
-
-
-
-
-
-
-
-
-
-
-
-
-
-
Southgate
N/A
Avg. Price / ft2
Past 12 months
Past 12 months
-
-
-
-
-
-
-
-
-
-
-
-
-
-
-
-
-
-
-
-
-
Southgate
N/A
Avg. Price
Past 12 months
Past 12 months
-
-
-
-
-
-
-
-
-
-
-
-
-
-
-
-
-
-
-
-
-
Southgate
N/A
Median Price
Past 12 months
Past 12 months
-
-
-
-
-
-
-
-
-
-
-
-
-
-
-
-
-
-
-
-
-