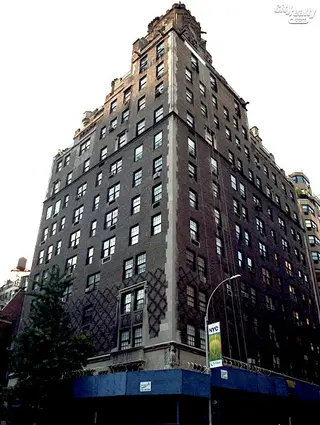
133 East 80th Street: Price Comparison
at The Northwest corner of Lexington Avenue Building Profile
133 East 80th Street
N/A
Avg. Price
Past 12 months
Past 12 months
2025
-
2024
$7,373,652
2023
-
2022
-
2021
-
2020
-
2019
$5,500,000
2018
$7,300,000
2017
$4,313,750
2016
-
2015
-
2014
-
2013
-
2012
$5,611,355
2011
-
2010
-
2009
$2,135,000
2008
-
2007
$5,865,000
2006
-
2005
$4,762,750
2004
$3,600,000
2003
$3,275,000
133 East 80th Street
N/A
Median Price
Past 12 months
Past 12 months
2025
-
2024
$7,373,652
2023
-
2022
-
2021
-
2020
-
2019
$5,500,000
2018
$7,300,000
2017
$4,313,750
2016
-
2015
-
2014
-
2013
-
2012
$5,611,355
2011
-
2010
-
2009
$2,135,000
2008
-
2007
$5,865,000
2006
-
2005
$4,762,750
2004
$3,600,000
2003
$3,275,000
133 East 80th Street
N/A
Avg. Price
Past 12 months
Past 12 months
2025
-
2024
-
2023
-
2022
-
2021
-
2020
-
2019
-
2018
-
2017
-
2016
-
2015
-
2014
-
2013
-
2012
-
2011
-
2010
-
2009
-
2008
-
2007
-
2006
-
2005
-
2004
-
2003
-
133 East 80th Street
N/A
Median Price
Past 12 months
Past 12 months
2025
-
2024
-
2023
-
2022
-
2021
-
2020
-
2019
-
2018
-
2017
-
2016
-
2015
-
2014
-
2013
-
2012
-
2011
-
2010
-
2009
-
2008
-
2007
-
2006
-
2005
-
2004
-
2003
-
133 East 80th Street
N/A
Avg. Price
Past 12 months
Past 12 months
2025
-
2024
-
2023
-
2022
-
2021
-
2020
-
2019
-
2018
-
2017
$4,313,750
2016
-
2015
-
2014
-
2013
-
2012
$933,009
2011
-
2010
-
2009
$2,135,000
2008
-
2007
$6,030,000
2006
-
2005
-
2004
$6,700,000
2003
$3,275,000
133 East 80th Street
N/A
Median Price
Past 12 months
Past 12 months
2025
-
2024
-
2023
-
2022
-
2021
-
2020
-
2019
-
2018
-
2017
$4,313,750
2016
-
2015
-
2014
-
2013
-
2012
$933,009
2011
-
2010
-
2009
$2,135,000
2008
-
2007
$6,030,000
2006
-
2005
-
2004
$6,700,000
2003
$3,275,000
133 East 80th Street
N/A
Avg. Price
Past 12 months
Past 12 months
2025
-
2024
$5,769,803
2023
-
2022
-
2021
-
2020
-
2019
$5,500,000
2018
$7,300,000
2017
-
2016
-
2015
-
2014
-
2013
-
2012
$10,289,700
2011
-
2010
-
2009
-
2008
-
2007
$5,700,000
2006
-
2005
$4,762,750
2004
$500,000
2003
-
133 East 80th Street
N/A
Median Price
Past 12 months
Past 12 months
2025
-
2024
$5,769,803
2023
-
2022
-
2021
-
2020
-
2019
$5,500,000
2018
$7,300,000
2017
-
2016
-
2015
-
2014
-
2013
-
2012
$10,289,700
2011
-
2010
-
2009
-
2008
-
2007
$5,700,000
2006
-
2005
$4,762,750
2004
$500,000
2003
-
133 East 80th Street
N/A
Avg. Price
Past 12 months
Past 12 months
2025
-
2024
$8,977,500
2023
-
2022
-
2021
-
2020
-
2019
-
2018
-
2017
-
2016
-
2015
-
2014
-
2013
-
2012
-
2011
-
2010
-
2009
-
2008
-
2007
-
2006
-
2005
-
2004
-
2003
-
133 East 80th Street
N/A
Median Price
Past 12 months
Past 12 months
2025
-
2024
$8,977,500
2023
-
2022
-
2021
-
2020
-
2019
-
2018
-
2017
-
2016
-
2015
-
2014
-
2013
-
2012
-
2011
-
2010
-
2009
-
2008
-
2007
-
2006
-
2005
-
2004
-
2003
-
The Campanile
$2,983
Avg. Price / ft2
Past 12 months
Past 12 months
$2,983
-
-
$1,250
$1,130
-
$1,817
-
-
-
-
-
$1,753
-
-
-
-
-
-
-
-
-
-
The Campanile
$8,950,000
Avg. Price
Past 12 months
Past 12 months
$8,950,000
$7,000,000
$5,650,000
$3,625,000
$2,600,000
-
$5,451,764
-
$8,500,000
-
-
-
$5,141,667
-
-
-
-
-
-
-
$4,750,000
$3,700,000
-
The Campanile
$8,950,000
Median Price
Past 12 months
Past 12 months
$8,950,000
$7,000,000
$5,650,000
$3,625,000
$2,600,000
-
$5,451,764
-
$8,500,000
-
-
-
$5,300,000
-
-
-
-
-
-
-
$4,750,000
$3,700,000
-
The Campanile
N/A
Avg. Price / ft2
Past 12 months
Past 12 months
-
-
-
-
-
-
-
-
-
-
-
-
-
-
-
-
-
-
-
-
-
-
-
The Campanile
N/A
Avg. Price
Past 12 months
Past 12 months
-
-
-
-
-
-
-
-
-
-
-
-
-
-
-
-
-
-
-
-
-
-
-
The Campanile
N/A
Median Price
Past 12 months
Past 12 months
-
-
-
-
-
-
-
-
-
-
-
-
-
-
-
-
-
-
-
-
-
-
-
The Campanile
N/A
Avg. Price / ft2
Past 12 months
Past 12 months
-
-
-
-
-
-
-
-
-
-
-
-
-
-
-
-
-
-
-
-
-
-
-
The Campanile
N/A
Avg. Price
Past 12 months
Past 12 months
-
-
-
-
-
-
-
-
-
-
-
-
-
-
-
-
-
-
-
-
-
-
-
The Campanile
N/A
Median Price
Past 12 months
Past 12 months
-
-
-
-
-
-
-
-
-
-
-
-
-
-
-
-
-
-
-
-
-
-
-
The Campanile
$2,983
Avg. Price / ft2
Past 12 months
Past 12 months
$2,983
-
-
-
$1,130
-
-
-
-
-
-
-
$2,568
-
-
-
-
-
-
-
-
-
-
The Campanile
$8,950,000
Avg. Price
Past 12 months
Past 12 months
$8,950,000
-
$5,650,000
-
$2,600,000
-
-
-
$8,500,000
-
-
-
$6,775,000
-
-
-
-
-
-
-
$4,750,000
$3,700,000
-
The Campanile
$8,950,000
Median Price
Past 12 months
Past 12 months
$8,950,000
-
$5,650,000
-
$2,600,000
-
-
-
$8,500,000
-
-
-
$6,775,000
-
-
-
-
-
-
-
$4,750,000
$3,700,000
-
The Campanile
N/A
Avg. Price / ft2
Past 12 months
Past 12 months
-
-
-
$1,250
-
-
$1,817
-
-
-
-
-
$938
-
-
-
-
-
-
-
-
-
-
The Campanile
N/A
Avg. Price
Past 12 months
Past 12 months
-
-
-
$3,625,000
-
-
$5,451,764
-
-
-
-
-
$1,875,000
-
-
-
-
-
-
-
-
-
-
The Campanile
N/A
Median Price
Past 12 months
Past 12 months
-
-
-
$3,625,000
-
-
$5,451,764
-
-
-
-
-
$1,875,000
-
-
-
-
-
-
-
-
-
-
The Campanile
N/A
Avg. Price / ft2
Past 12 months
Past 12 months
-
-
-
-
-
-
-
-
-
-
-
-
-
-
-
-
-
-
-
-
-
-
-
The Campanile
N/A
Avg. Price
Past 12 months
Past 12 months
-
-
-
-
-
-
-
-
-
-
-
-
-
-
-
-
-
-
-
-
-
-
-
The Campanile
N/A
Median Price
Past 12 months
Past 12 months
-
-
-
-
-
-
-
-
-
-
-
-
-
-
-
-
-
-
-
-
-
-
-
The Campanile
N/A
Avg. Price / ft2
Past 12 months
Past 12 months
-
-
-
-
-
-
-
-
-
-
-
-
-
-
-
-
-
-
-
-
-
-
-
The Campanile
N/A
Avg. Price
Past 12 months
Past 12 months
-
$7,000,000
-
-
-
-
-
-
-
-
-
-
-
-
-
-
-
-
-
-
-
-
-
The Campanile
N/A
Median Price
Past 12 months
Past 12 months
-
$7,000,000
-
-
-
-
-
-
-
-
-
-
-
-
-
-
-
-
-
-
-
-
-
3 East 85th Street
$1,500
Avg. Price / ft2
Past 12 months
Past 12 months
$1,372
-
-
-
$1,137
$1,167
$942
-
-
$1,215
$989
-
-
-
-
$1,053
$1,141
-
-
$1,023
-
-
$713
3 East 85th Street
$1,415,500
Avg. Price
Past 12 months
Past 12 months
$1,545,000
$665,000
$735,000
-
$1,181,222
$1,300,000
$1,225,000
$1,740,000
-
$1,066,500
$1,484,667
-
$447,500
$1,136,250
-
$1,580,000
$731,500
-
$530,000
$1,055,000
-
-
$481,000
3 East 85th Street
$1,415,500
Median Price
Past 12 months
Past 12 months
$1,545,000
$665,000
$735,000
-
$885,000
$1,300,000
$1,225,000
$1,740,000
-
$1,066,500
$795,000
-
$447,500
$1,136,250
-
$1,580,000
$731,500
-
$530,000
$1,055,000
-
-
$481,000
3 East 85th Street
N/A
Avg. Price / ft2
Past 12 months
Past 12 months
-
-
-
-
-
-
-
-
-
-
-
-
-
-
-
-
-
-
-
-
-
-
-
3 East 85th Street
N/A
Avg. Price
Past 12 months
Past 12 months
-
-
-
-
-
-
-
-
-
-
-
-
-
-
-
-
-
-
$530,000
-
-
-
-
3 East 85th Street
N/A
Median Price
Past 12 months
Past 12 months
-
-
-
-
-
-
-
-
-
-
-
-
-
-
-
-
-
-
$530,000
-
-
-
-
3 East 85th Street
N/A
Avg. Price / ft2
Past 12 months
Past 12 months
-
-
-
-
$963
-
$942
-
-
$1,360
$800
-
-
-
-
-
$1,141
-
-
-
-
-
-
3 East 85th Street
$581,000
Avg. Price
Past 12 months
Past 12 months
-
$480,000
$735,000
-
$655,000
-
$1,225,000
-
-
$850,000
$459,000
-
$447,500
-
-
-
$713,000
-
-
-
-
-
-
3 East 85th Street
$581,000
Median Price
Past 12 months
Past 12 months
-
$480,000
$735,000
-
$655,000
-
$1,225,000
-
-
$850,000
$459,000
-
$447,500
-
-
-
$713,000
-
-
-
-
-
-
3 East 85th Street
N/A
Avg. Price / ft2
Past 12 months
Past 12 months
$1,244
-
-
-
$1,311
-
-
-
-
$1,069
$1,178
-
-
-
-
-
-
-
-
$1,163
-
-
$713
3 East 85th Street
N/A
Avg. Price
Past 12 months
Past 12 months
$840,000
$850,000
-
-
$885,000
$850,000
-
-
-
$1,283,000
$795,000
-
-
$1,136,250
-
-
$750,000
-
-
$785,000
-
-
$481,000
3 East 85th Street
N/A
Median Price
Past 12 months
Past 12 months
$840,000
$850,000
-
-
$885,000
$850,000
-
-
-
$1,283,000
$795,000
-
-
$1,136,250
-
-
$750,000
-
-
$785,000
-
-
$481,000
3 East 85th Street
$1,500
Avg. Price / ft2
Past 12 months
Past 12 months
$1,500
-
-
-
-
$1,167
-
-
-
-
-
-
-
-
-
$1,053
-
-
-
$883
-
-
-
3 East 85th Street
$2,250,000
Avg. Price
Past 12 months
Past 12 months
$2,250,000
-
-
-
$2,003,666
$1,750,000
-
$1,740,000
-
-
-
-
-
-
-
$1,580,000
-
-
-
$1,325,000
-
-
-
3 East 85th Street
$2,250,000
Median Price
Past 12 months
Past 12 months
$2,250,000
-
-
-
$2,003,666
$1,750,000
-
$1,740,000
-
-
-
-
-
-
-
$1,580,000
-
-
-
$1,325,000
-
-
-
3 East 85th Street
N/A
Avg. Price / ft2
Past 12 months
Past 12 months
-
-
-
-
-
-
-
-
-
-
-
-
-
-
-
-
-
-
-
-
-
-
-
3 East 85th Street
N/A
Avg. Price
Past 12 months
Past 12 months
-
-
-
-
-
-
-
-
-
-
$3,200,000
-
-
-
-
-
-
-
-
-
-
-
-
3 East 85th Street
N/A
Median Price
Past 12 months
Past 12 months
-
-
-
-
-
-
-
-
-
-
$3,200,000
-
-
-
-
-
-
-
-
-
-
-
-
3 East 85th Street
N/A
Avg. Price / ft2
Past 12 months
Past 12 months
-
-
-
-
-
-
-
-
-
-
-
-
-
-
-
-
-
-
-
-
-
-
-
3 East 85th Street
N/A
Avg. Price
Past 12 months
Past 12 months
-
-
-
-
-
-
-
-
-
-
-
-
-
-
-
-
-
-
-
-
-
-
-
3 East 85th Street
N/A
Median Price
Past 12 months
Past 12 months
-
-
-
-
-
-
-
-
-
-
-
-
-
-
-
-
-
-
-
-
-
-
-
Fred Leighton Building
$1,444
Avg. Price / ft2
Past 12 months
Past 12 months
$455
-
$1,903
$1,321
-
-
-
$1,884
-
-
-
-
-
$1,786
-
-
-
-
-
-
-
-
-
Fred Leighton Building
$5,667,500
Avg. Price
Past 12 months
Past 12 months
$4,975,000
-
$4,852,500
$3,700,000
-
$4,725,000
-
$6,500,000
-
-
-
-
$1,775,000
$6,250,000
-
-
-
-
$3,750,000
$2,085,950
$3,700,000
$2,800,000
-
Fred Leighton Building
$5,250,000
Median Price
Past 12 months
Past 12 months
$4,975,000
-
$4,852,500
$3,700,000
-
$4,725,000
-
$6,500,000
-
-
-
-
$1,775,000
$6,250,000
-
-
-
-
$3,750,000
$2,085,950
$3,700,000
$2,800,000
-
Fred Leighton Building
N/A
Avg. Price / ft2
Past 12 months
Past 12 months
-
-
-
-
-
-
-
-
-
-
-
-
-
-
-
-
-
-
-
-
-
-
-
Fred Leighton Building
N/A
Avg. Price
Past 12 months
Past 12 months
-
-
-
-
-
-
-
-
-
-
-
-
-
-
-
-
-
-
-
-
-
-
-
Fred Leighton Building
N/A
Median Price
Past 12 months
Past 12 months
-
-
-
-
-
-
-
-
-
-
-
-
-
-
-
-
-
-
-
-
-
-
-
Fred Leighton Building
N/A
Avg. Price / ft2
Past 12 months
Past 12 months
-
-
-
-
-
-
-
$1,884
-
-
-
-
-
-
-
-
-
-
-
-
-
-
-
Fred Leighton Building
N/A
Avg. Price
Past 12 months
Past 12 months
-
-
-
-
-
-
-
$6,500,000
-
-
-
-
-
-
-
-
-
-
-
-
-
$2,800,000
-
Fred Leighton Building
N/A
Median Price
Past 12 months
Past 12 months
-
-
-
-
-
-
-
$6,500,000
-
-
-
-
-
-
-
-
-
-
-
-
-
$2,800,000
-
Fred Leighton Building
$341
Avg. Price / ft2
Past 12 months
Past 12 months
$455
-
-
$1,321
-
-
-
-
-
-
-
-
-
-
-
-
-
-
-
-
-
-
-
Fred Leighton Building
$4,237,500
Avg. Price
Past 12 months
Past 12 months
$4,975,000
-
-
$3,700,000
-
$4,725,000
-
-
-
-
-
-
$1,775,000
-
-
-
-
-
$3,750,000
$2,085,950
$3,700,000
-
-
Fred Leighton Building
$4,975,000
Median Price
Past 12 months
Past 12 months
$4,975,000
-
-
$3,700,000
-
$4,725,000
-
-
-
-
-
-
$1,775,000
-
-
-
-
-
$3,750,000
$2,085,950
$3,700,000
-
-
Fred Leighton Building
$2,821
Avg. Price / ft2
Past 12 months
Past 12 months
-
-
$1,903
-
-
-
-
-
-
-
-
-
-
$1,786
-
-
-
-
-
-
-
-
-
Fred Leighton Building
$7,812,500
Avg. Price
Past 12 months
Past 12 months
-
-
$7,650,000
-
-
-
-
-
-
-
-
-
-
$6,250,000
-
-
-
-
-
-
-
-
-
Fred Leighton Building
$7,812,500
Median Price
Past 12 months
Past 12 months
-
-
$7,650,000
-
-
-
-
-
-
-
-
-
-
$6,250,000
-
-
-
-
-
-
-
-
-
Fred Leighton Building
N/A
Avg. Price / ft2
Past 12 months
Past 12 months
-
-
-
-
-
-
-
-
-
-
-
-
-
-
-
-
-
-
-
-
-
-
-
Fred Leighton Building
N/A
Avg. Price
Past 12 months
Past 12 months
-
-
-
-
-
-
-
-
-
-
-
-
-
-
-
-
-
-
-
-
-
-
-
Fred Leighton Building
N/A
Median Price
Past 12 months
Past 12 months
-
-
-
-
-
-
-
-
-
-
-
-
-
-
-
-
-
-
-
-
-
-
-
136 East 79th Street
$1,208
Avg. Price / ft2
Past 12 months
Past 12 months
$1,014
-
-
-
-
-
-
-
-
-
-
-
-
-
-
-
-
-
-
-
-
-
-
136 East 79th Street
$4,913,333
Avg. Price
Past 12 months
Past 12 months
$3,565,625
-
$2,637,500
$4,625,000
-
-
-
-
$4,516,750
-
-
-
-
$4,690,000
-
-
-
$5,041,667
-
$3,800,000
$4,200,000
$9,500,000
-
136 East 79th Street
$4,140,000
Median Price
Past 12 months
Past 12 months
$3,756,250
-
$2,637,500
$4,625,000
-
-
-
-
$4,516,750
-
-
-
-
$4,690,000
-
-
-
$5,650,000
-
$3,800,000
$4,200,000
$9,500,000
-
136 East 79th Street
N/A
Avg. Price / ft2
Past 12 months
Past 12 months
-
-
-
-
-
-
-
-
-
-
-
-
-
-
-
-
-
-
-
-
-
-
-
136 East 79th Street
N/A
Avg. Price
Past 12 months
Past 12 months
-
-
-
-
-
-
-
-
-
-
-
-
-
-
-
-
-
-
-
-
-
-
-
136 East 79th Street
N/A
Median Price
Past 12 months
Past 12 months
-
-
-
-
-
-
-
-
-
-
-
-
-
-
-
-
-
-
-
-
-
-
-
136 East 79th Street
N/A
Avg. Price / ft2
Past 12 months
Past 12 months
-
-
-
-
-
-
-
-
-
-
-
-
-
-
-
-
-
-
-
-
-
-
-
136 East 79th Street
N/A
Avg. Price
Past 12 months
Past 12 months
-
-
$1,225,000
$4,500,000
-
-
-
-
-
-
-
-
-
-
-
-
-
$7,000,000
-
-
-
-
-
136 East 79th Street
N/A
Median Price
Past 12 months
Past 12 months
-
-
$1,225,000
$4,500,000
-
-
-
-
-
-
-
-
-
-
-
-
-
$7,000,000
-
-
-
-
-
136 East 79th Street
N/A
Avg. Price / ft2
Past 12 months
Past 12 months
$777
-
-
-
-
-
-
-
-
-
-
-
-
-
-
-
-
-
-
-
-
-
-
136 East 79th Street
$3,982,500
Avg. Price
Past 12 months
Past 12 months
$3,375,000
-
-
$4,750,000
-
-
-
-
-
-
-
-
-
$4,690,000
-
-
-
$5,650,000
-
$3,800,000
$4,200,000
-
-
136 East 79th Street
$4,140,000
Median Price
Past 12 months
Past 12 months
$3,375,000
-
-
$4,750,000
-
-
-
-
-
-
-
-
-
$4,690,000
-
-
-
$5,650,000
-
$3,800,000
$4,200,000
-
-
136 East 79th Street
$1,208
Avg. Price / ft2
Past 12 months
Past 12 months
$1,133
-
-
-
-
-
-
-
-
-
-
-
-
-
-
-
-
-
-
-
-
-
-
136 East 79th Street
$3,650,000
Avg. Price
Past 12 months
Past 12 months
$3,756,250
-
$4,050,000
-
-
-
-
-
$4,516,750
-
-
-
-
-
-
-
-
-
-
-
-
-
-
136 East 79th Street
$3,650,000
Median Price
Past 12 months
Past 12 months
$3,756,250
-
$4,050,000
-
-
-
-
-
$4,516,750
-
-
-
-
-
-
-
-
-
-
-
-
-
-
136 East 79th Street
N/A
Avg. Price / ft2
Past 12 months
Past 12 months
-
-
-
-
-
-
-
-
-
-
-
-
-
-
-
-
-
-
-
-
-
-
-
136 East 79th Street
N/A
Avg. Price
Past 12 months
Past 12 months
-
-
-
-
-
-
-
-
-
-
-
-
-
-
-
-
-
-
-
-
-
-
-
136 East 79th Street
N/A
Median Price
Past 12 months
Past 12 months
-
-
-
-
-
-
-
-
-
-
-
-
-
-
-
-
-
-
-
-
-
-
-
239 East 79th Street
$869
Avg. Price / ft2
Past 12 months
Past 12 months
$1,130
-
$1,041
-
$1,053
-
-
$1,131
$1,029
$938
$917
$950
-
$821
$700
$883
$757
$965
$1,034
$790
$793
$518
$675
239 East 79th Street
$1,156,136
Avg. Price
Past 12 months
Past 12 months
$1,272,500
$1,016,000
$880,009
$1,160,000
$1,580,000
$1,226,000
$990,000
$1,335,429
$1,196,016
$1,140,625
$1,008,643
$1,118,333
$1,320,364
$891,302
$669,000
$1,235,000
$732,625
$1,029,417
$998,271
$844,117
$767,911
$653,821
$644,800
239 East 79th Street
$1,275,000
Median Price
Past 12 months
Past 12 months
$1,272,500
$1,000,000
$802,528
$1,160,000
$1,580,000
$1,226,000
$990,000
$1,425,000
$1,213,000
$1,183,750
$865,000
$1,162,500
$1,200,000
$925,000
$610,000
$1,235,000
$739,000
$1,120,000
$999,900
$870,000
$792,500
$674,000
$623,750
239 East 79th Street
N/A
Avg. Price / ft2
Past 12 months
Past 12 months
-
-
-
-
-
-
-
-
-
$938
-
-
-
-
-
-
-
-
-
-
$569
$390
-
239 East 79th Street
N/A
Avg. Price
Past 12 months
Past 12 months
-
$525,000
$545,000
-
-
-
-
-
-
$610,000
-
-
-
-
-
-
$497,500
-
-
-
$370,000
$316,750
-
239 East 79th Street
N/A
Median Price
Past 12 months
Past 12 months
-
$525,000
$545,000
-
-
-
-
-
-
$610,000
-
-
-
-
-
-
$497,500
-
-
-
$370,000
$316,750
-
239 East 79th Street
N/A
Avg. Price / ft2
Past 12 months
Past 12 months
-
-
$900
-
-
-
-
$992
$1,029
-
$917
$896
-
$737
-
-
$718
$832
$1,235
$765
$878
-
$724
239 East 79th Street
$1,026,667
Avg. Price
Past 12 months
Past 12 months
$850,000
$701,000
$753,352
$695,000
-
-
$630,000
$843,000
$800,286
-
$741,875
$617,500
$672,500
$622,660
$483,333
-
$560,000
$707,000
$797,500
$617,100
$684,987
$453,000
$615,000
239 East 79th Street
$990,000
Median Price
Past 12 months
Past 12 months
$850,000
$701,000
$765,000
$695,000
-
-
$630,000
$843,000
$789,572
-
$732,500
$617,500
$672,500
$622,660
$565,000
-
$560,000
$707,000
$797,500
$637,500
$630,935
$465,000
$615,000
239 East 79th Street
$869
Avg. Price / ft2
Past 12 months
Past 12 months
$1,130
-
$1,182
-
-
-
-
$1,271
-
-
-
$968
-
$725
$700
$829
$796
$1,098
$833
$827
-
$646
$558
239 East 79th Street
$1,276,786
Avg. Price
Past 12 months
Past 12 months
$1,695,000
$1,389,667
$1,237,500
$1,625,000
-
$1,226,000
$1,350,000
$1,426,250
$1,497,000
$1,317,500
$1,364,333
$1,368,750
$1,188,167
$882,375
$947,500
$995,000
$936,500
$1,190,625
$1,078,580
$1,033,298
$844,000
$838,500
$590,063
239 East 79th Street
$1,337,500
Median Price
Past 12 months
Past 12 months
$1,695,000
$1,424,000
$1,237,500
$1,625,000
-
$1,226,000
$1,350,000
$1,457,500
$1,512,500
$1,230,000
$1,350,000
$1,300,000
$1,147,500
$943,750
$947,500
$995,000
$936,500
$1,250,000
$999,900
$992,000
$850,000
$795,000
$623,750
239 East 79th Street
N/A
Avg. Price / ft2
Past 12 months
Past 12 months
-
-
-
-
$1,053
-
-
-
-
-
-
-
-
$1,000
-
$937
-
-
-
-
$762
-
$742
239 East 79th Street
N/A
Avg. Price
Past 12 months
Past 12 months
-
-
-
-
$1,580,000
-
-
$1,700,000
$1,575,000
-
-
-
$1,825,000
$1,500,000
-
$1,475,000
-
-
-
-
$1,200,000
-
$1,112,500
239 East 79th Street
N/A
Median Price
Past 12 months
Past 12 months
-
-
-
-
$1,580,000
-
-
$1,700,000
$1,575,000
-
-
-
$1,825,000
$1,500,000
-
$1,475,000
-
-
-
-
$1,200,000
-
$1,112,500
239 East 79th Street
N/A
Avg. Price / ft2
Past 12 months
Past 12 months
-
-
-
-
-
-
-
-
-
-
-
-
-
-
-
-
-
-
-
-
-
-
-
239 East 79th Street
N/A
Avg. Price
Past 12 months
Past 12 months
-
-
-
-
-
-
-
-
-
-
-
-
-
-
-
-
-
-
-
-
-
-
-
239 East 79th Street
N/A
Median Price
Past 12 months
Past 12 months
-
-
-
-
-
-
-
-
-
-
-
-
-
-
-
-
-
-
-
-
-
-
-
239 East 79th Street
N/A
Avg. Price / ft2
Past 12 months
Past 12 months
-
-
-
-
-
-
-
-
-
-
-
-
-
-
-
-
-
-
-
-
-
-
-
239 East 79th Street
N/A
Avg. Price
Past 12 months
Past 12 months
-
-
-
-
-
-
-
-
-
-
-
-
-
-
-
-
-
-
-
-
-
-
-
239 East 79th Street
N/A
Median Price
Past 12 months
Past 12 months
-
-
-
-
-
-
-
-
-
-
-
-
-
-
-
-
-
-
-
-
-
-
-
2 Sutton Place South
N/A
Avg. Price / ft2
Past 12 months
Past 12 months
-
$888
-
-
$706
$908
$902
$977
-
$1,363
$874
$1,038
$1,289
$943
-
$784
$1,111
$972
$1,299
$1,032
-
$1,516
$704
2 Sutton Place South
$2,175,000
Avg. Price
Past 12 months
Past 12 months
-
$1,525,833
$1,356,875
-
$1,283,333
$861,667
$1,961,667
$2,112,500
$1,264,800
$2,747,000
$599,492
$1,311,000
$1,466,500
$1,388,750
$1,183,333
$1,295,000
$1,625,000
$1,575,000
$1,616,000
$1,446,200
$2,640,415
$1,322,478
$894,167
2 Sutton Place South
$2,175,000
Median Price
Past 12 months
Past 12 months
-
$1,772,500
$1,037,500
-
$1,500,000
$815,000
$1,585,000
$2,112,500
$1,300,000
$2,975,000
$647,960
$1,200,000
$1,249,500
$1,312,500
$1,155,000
$1,275,000
$1,725,000
$1,575,000
$1,595,000
$875,000
$1,375,000
$925,000
$872,500
2 Sutton Place South
N/A
Avg. Price / ft2
Past 12 months
Past 12 months
-
-
-
-
-
-
-
-
-
-
-
-
-
-
-
-
-
-
-
-
-
-
-
2 Sutton Place South
N/A
Avg. Price
Past 12 months
Past 12 months
-
$685,000
$375,000
-
-
$675,000
-
-
$425,000
-
$346,250
-
-
-
-
-
-
-
-
$385,000
-
-
-
2 Sutton Place South
N/A
Median Price
Past 12 months
Past 12 months
-
$685,000
$375,000
-
-
$675,000
-
-
$425,000
-
$346,250
-
-
-
-
-
-
-
-
$385,000
-
-
-
2 Sutton Place South
N/A
Avg. Price / ft2
Past 12 months
Past 12 months
-
$863
-
-
$650
$908
-
$977
-
-
$874
$742
-
$636
-
$784
-
-
-
$785
-
$532
$735
2 Sutton Place South
$1,650,000
Avg. Price
Past 12 months
Past 12 months
-
$725,000
$858,333
-
$650,000
$882,500
-
$1,075,000
$999,000
-
$768,320
$610,000
$974,750
$812,500
$1,400,000
$700,000
-
-
$850,000
$771,250
$656,245
$705,000
$571,667
2 Sutton Place South
$1,650,000
Median Price
Past 12 months
Past 12 months
-
$725,000
$950,000
-
$650,000
$815,000
-
$1,075,000
$999,000
-
$682,000
$610,000
$974,750
$812,500
$1,400,000
$700,000
-
-
$850,000
$771,250
$656,245
$697,500
$570,000
2 Sutton Place South
N/A
Avg. Price / ft2
Past 12 months
Past 12 months
-
-
-
-
-
-
$750
-
-
$1,363
-
$1,185
$1,289
$1,250
-
-
$1,111
$972
$1,299
$1,279
-
$2,500
$674
2 Sutton Place South
N/A
Avg. Price
Past 12 months
Past 12 months
-
$1,825,000
$1,187,500
-
$1,500,000
$965,000
$1,467,500
$3,150,000
$1,633,333
$2,346,250
-
$2,067,500
$2,450,000
$1,580,833
$1,516,667
$1,691,667
$1,625,000
$1,575,000
$1,807,500
$2,175,000
$1,426,667
$2,123,075
$1,216,667
2 Sutton Place South
N/A
Median Price
Past 12 months
Past 12 months
-
$1,825,000
$1,187,500
-
$1,500,000
$965,000
$1,467,500
$3,150,000
$1,725,000
$2,387,500
-
$2,067,500
$2,450,000
$1,595,000
$1,350,000
$1,525,000
$1,725,000
$1,575,000
$1,677,500
$2,175,000
$1,425,000
$1,421,150
$1,225,000
2 Sutton Place South
N/A
Avg. Price / ft2
Past 12 months
Past 12 months
-
$913
-
-
-
-
-
-
-
-
-
-
-
-
-
-
-
-
-
-
-
-
-
2 Sutton Place South
$2,700,000
Avg. Price
Past 12 months
Past 12 months
-
$2,047,500
$2,765,000
-
-
-
-
-
-
$4,350,000
-
-
-
-
-
-
-
-
-
$3,128,500
-
-
-
2 Sutton Place South
$2,700,000
Median Price
Past 12 months
Past 12 months
-
$2,047,500
$2,765,000
-
-
-
-
-
-
$4,350,000
-
-
-
-
-
-
-
-
-
$3,128,500
-
-
-
2 Sutton Place South
N/A
Avg. Price / ft2
Past 12 months
Past 12 months
-
-
-
-
$762
-
$1,054
-
-
-
-
-
-
-
-
-
-
-
-
-
-
-
-
2 Sutton Place South
N/A
Avg. Price
Past 12 months
Past 12 months
-
-
-
-
$1,700,000
-
$2,950,000
-
-
-
-
-
-
-
-
-
-
-
-
-
$10,250,000
-
-
2 Sutton Place South
N/A
Median Price
Past 12 months
Past 12 months
-
-
-
-
$1,700,000
-
$2,950,000
-
-
-
-
-
-
-
-
-
-
-
-
-
$10,250,000
-
-
2 Sutton Place South
N/A
Avg. Price / ft2
Past 12 months
Past 12 months
-
-
-
-
-
-
-
-
-
-
-
-
-
-
-
-
-
-
-
-
-
-
-
2 Sutton Place South
N/A
Avg. Price
Past 12 months
Past 12 months
-
-
-
-
-
-
-
-
-
-
-
-
-
-
-
-
-
-
-
-
-
-
-
2 Sutton Place South
N/A
Median Price
Past 12 months
Past 12 months
-
-
-
-
-
-
-
-
-
-
-
-
-
-
-
-
-
-
-
-
-
-
-
898 Park Avenue
N/A
Avg. Price / ft2
Past 12 months
Past 12 months
-
-
-
-
-
-
-
-
-
-
-
$2,037
-
-
-
-
-
-
-
-
-
-
-
898 Park Avenue
N/A
Avg. Price
Past 12 months
Past 12 months
$2,600,000
-
-
$2,875,000
$7,700,000
-
-
-
-
$3,500,000
-
$5,820,000
$3,350,000
$3,300,000
-
$3,000,000
-
-
-
-
-
$2,350,000
$2,300,000
898 Park Avenue
N/A
Median Price
Past 12 months
Past 12 months
$2,600,000
-
-
$2,875,000
$7,700,000
-
-
-
-
$3,500,000
-
$5,820,000
$3,350,000
$3,300,000
-
$3,000,000
-
-
-
-
-
$2,350,000
$2,300,000
898 Park Avenue
N/A
Avg. Price / ft2
Past 12 months
Past 12 months
-
-
-
-
-
-
-
-
-
-
-
-
-
-
-
-
-
-
-
-
-
-
-
898 Park Avenue
N/A
Avg. Price
Past 12 months
Past 12 months
-
-
-
-
-
-
-
-
-
-
-
-
-
-
-
-
-
-
-
-
-
-
-
898 Park Avenue
N/A
Median Price
Past 12 months
Past 12 months
-
-
-
-
-
-
-
-
-
-
-
-
-
-
-
-
-
-
-
-
-
-
-
898 Park Avenue
N/A
Avg. Price / ft2
Past 12 months
Past 12 months
-
-
-
-
-
-
-
-
-
-
-
-
-
-
-
-
-
-
-
-
-
-
-
898 Park Avenue
N/A
Avg. Price
Past 12 months
Past 12 months
$2,600,000
-
-
-
-
-
-
-
-
$3,500,000
-
$3,290,000
$3,350,000
-
-
$3,000,000
-
-
-
-
-
$2,350,000
$2,300,000
898 Park Avenue
N/A
Median Price
Past 12 months
Past 12 months
$2,600,000
-
-
-
-
-
-
-
-
$3,500,000
-
$3,290,000
$3,350,000
-
-
$3,000,000
-
-
-
-
-
$2,350,000
$2,300,000
898 Park Avenue
N/A
Avg. Price / ft2
Past 12 months
Past 12 months
-
-
-
-
-
-
-
-
-
-
-
-
-
-
-
-
-
-
-
-
-
-
-
898 Park Avenue
N/A
Avg. Price
Past 12 months
Past 12 months
-
-
-
$2,875,000
-
-
-
-
-
-
-
-
-
-
-
-
-
-
-
-
-
-
-
898 Park Avenue
N/A
Median Price
Past 12 months
Past 12 months
-
-
-
$2,875,000
-
-
-
-
-
-
-
-
-
-
-
-
-
-
-
-
-
-
-
898 Park Avenue
N/A
Avg. Price / ft2
Past 12 months
Past 12 months
-
-
-
-
-
-
-
-
-
-
-
$2,037
-
-
-
-
-
-
-
-
-
-
-
898 Park Avenue
N/A
Avg. Price
Past 12 months
Past 12 months
-
-
-
-
-
-
-
-
-
-
-
$8,350,000
-
-
-
-
-
-
-
-
-
-
-
898 Park Avenue
N/A
Median Price
Past 12 months
Past 12 months
-
-
-
-
-
-
-
-
-
-
-
$8,350,000
-
-
-
-
-
-
-
-
-
-
-
898 Park Avenue
N/A
Avg. Price / ft2
Past 12 months
Past 12 months
-
-
-
-
-
-
-
-
-
-
-
-
-
-
-
-
-
-
-
-
-
-
-
898 Park Avenue
N/A
Avg. Price
Past 12 months
Past 12 months
-
-
-
-
-
-
-
-
-
-
-
-
-
-
-
-
-
-
-
-
-
-
-
898 Park Avenue
N/A
Median Price
Past 12 months
Past 12 months
-
-
-
-
-
-
-
-
-
-
-
-
-
-
-
-
-
-
-
-
-
-
-
Carlyle House
N/A
Avg. Price / ft2
Past 12 months
Past 12 months
-
$1,941
-
-
-
-
$1,954
-
-
-
-
-
-
-
-
-
-
-
-
$1,320
-
-
-
Carlyle House
$8,100,000
Avg. Price
Past 12 months
Past 12 months
$9,300,000
$6,550,000
-
$8,720,000
-
-
$5,248,333
-
-
$6,375,000
$7,404,500
$3,900,000
-
-
$5,576,000
$950,000
-
$4,500,000
$4,810,000
$3,895,000
$1,450,000
$4,100,000
-
Carlyle House
$8,100,000
Median Price
Past 12 months
Past 12 months
$9,300,000
$6,550,000
-
$8,720,000
-
-
$4,995,000
-
-
$6,375,000
$7,404,500
$3,900,000
-
-
$5,576,000
$950,000
-
$4,500,000
$4,810,000
$3,895,000
$1,450,000
$4,100,000
-
Carlyle House
N/A
Avg. Price / ft2
Past 12 months
Past 12 months
-
-
-
-
-
-
-
-
-
-
-
-
-
-
-
-
-
-
-
-
-
-
-
Carlyle House
N/A
Avg. Price
Past 12 months
Past 12 months
-
-
-
-
-
-
-
-
-
-
-
-
-
-
-
-
-
-
-
-
-
-
-
Carlyle House
N/A
Median Price
Past 12 months
Past 12 months
-
-
-
-
-
-
-
-
-
-
-
-
-
-
-
-
-
-
-
-
-
-
-
Carlyle House
N/A
Avg. Price / ft2
Past 12 months
Past 12 months
-
-
-
-
-
-
-
-
-
-
-
-
-
-
-
-
-
-
-
-
-
-
-
Carlyle House
N/A
Avg. Price
Past 12 months
Past 12 months
-
-
-
-
-
-
-
-
-
-
-
-
-
-
-
$950,000
-
-
-
-
-
-
-
Carlyle House
N/A
Median Price
Past 12 months
Past 12 months
-
-
-
-
-
-
-
-
-
-
-
-
-
-
-
$950,000
-
-
-
-
-
-
-
Carlyle House
N/A
Avg. Price / ft2
Past 12 months
Past 12 months
-
-
-
-
-
-
-
-
-
-
-
-
-
-
-
-
-
-
-
-
-
-
-
Carlyle House
N/A
Avg. Price
Past 12 months
Past 12 months
-
-
-
-
-
-
$4,200,000
-
-
-
-
$3,900,000
-
-
-
-
-
$4,500,000
$4,810,000
-
$1,450,000
-
-
Carlyle House
N/A
Median Price
Past 12 months
Past 12 months
-
-
-
-
-
-
$4,200,000
-
-
-
-
$3,900,000
-
-
-
-
-
$4,500,000
$4,810,000
-
$1,450,000
-
-
Carlyle House
N/A
Avg. Price / ft2
Past 12 months
Past 12 months
-
-
-
-
-
-
$1,954
-
-
-
-
-
-
-
-
-
-
-
-
$1,320
-
-
-
Carlyle House
$8,100,000
Avg. Price
Past 12 months
Past 12 months
$9,300,000
-
-
$7,750,000
-
-
$5,772,500
-
-
$6,375,000
$7,404,500
-
-
-
-
-
-
-
-
$3,895,000
-
$4,100,000
-
Carlyle House
$8,100,000
Median Price
Past 12 months
Past 12 months
$9,300,000
-
-
$7,750,000
-
-
$5,772,500
-
-
$6,375,000
$7,404,500
-
-
-
-
-
-
-
-
$3,895,000
-
$4,100,000
-
Carlyle House
N/A
Avg. Price / ft2
Past 12 months
Past 12 months
-
$1,941
-
-
-
-
-
-
-
-
-
-
-
-
-
-
-
-
-
-
-
-
-
Carlyle House
N/A
Avg. Price
Past 12 months
Past 12 months
-
$6,550,000
-
-
-
-
-
-
-
-
-
-
-
-
$6,350,000
-
-
-
-
-
-
-
-
Carlyle House
N/A
Median Price
Past 12 months
Past 12 months
-
$6,550,000
-
-
-
-
-
-
-
-
-
-
-
-
$6,350,000
-
-
-
-
-
-
-
-
Carlyle House
N/A
Avg. Price / ft2
Past 12 months
Past 12 months
-
-
-
-
-
-
-
-
-
-
-
-
-
-
-
-
-
-
-
-
-
-
-
Carlyle House
N/A
Avg. Price
Past 12 months
Past 12 months
-
-
-
-
-
-
-
-
-
-
-
-
-
-
-
-
-
-
-
-
-
-
-
Carlyle House
N/A
Median Price
Past 12 months
Past 12 months
-
-
-
-
-
-
-
-
-
-
-
-
-
-
-
-
-
-
-
-
-
-
-
Millan House
N/A
Avg. Price / ft2
Past 12 months
Past 12 months
-
$1,275
-
-
-
-
-
-
-
-
-
-
-
-
-
-
-
-
-
-
-
$1,085
-
Millan House
$3,641,667
Avg. Price
Past 12 months
Past 12 months
$1,927,500
$2,550,000
$3,435,750
$2,837,500
$1,350,000
-
$2,286,667
$3,800,000
-
$2,195,000
$2,285,000
$7,510,000
-
$2,556,250
$3,000,000
-
$2,500,000
$2,465,000
$1,300,000
$1,950,000
-
$2,170,000
-
Millan House
$3,825,000
Median Price
Past 12 months
Past 12 months
$1,927,500
$2,550,000
$3,435,750
$2,837,500
$1,350,000
-
$2,910,000
$3,800,000
-
$2,195,000
$2,285,000
$7,510,000
-
$2,556,250
$3,000,000
-
$2,500,000
$2,495,000
$1,300,000
$1,950,000
-
$2,170,000
-
Millan House
N/A
Avg. Price / ft2
Past 12 months
Past 12 months
-
-
-
-
-
-
-
-
-
-
-
-
-
-
-
-
-
-
-
-
-
-
-
Millan House
N/A
Avg. Price
Past 12 months
Past 12 months
-
-
-
-
-
-
-
-
-
-
-
-
-
-
-
-
-
-
-
-
-
-
-
Millan House
N/A
Median Price
Past 12 months
Past 12 months
-
-
-
-
-
-
-
-
-
-
-
-
-
-
-
-
-
-
-
-
-
-
-
Millan House
N/A
Avg. Price / ft2
Past 12 months
Past 12 months
-
$1,275
-
-
-
-
-
-
-
-
-
-
-
-
-
-
-
-
-
-
-
$1,085
-
Millan House
$2,950,000
Avg. Price
Past 12 months
Past 12 months
-
$2,550,000
$2,999,000
$1,975,000
$1,350,000
-
$1,975,000
-
-
$2,195,000
-
-
-
-
$3,000,000
-
-
$2,465,000
-
$1,950,000
-
$2,170,000
-
Millan House
$2,950,000
Median Price
Past 12 months
Past 12 months
-
$2,550,000
$2,999,000
$1,975,000
$1,350,000
-
$1,975,000
-
-
$2,195,000
-
-
-
-
$3,000,000
-
-
$2,495,000
-
$1,950,000
-
$2,170,000
-
Millan House
N/A
Avg. Price / ft2
Past 12 months
Past 12 months
-
-
-
-
-
-
-
-
-
-
-
-
-
-
-
-
-
-
-
-
-
-
-
Millan House
$3,987,500
Avg. Price
Past 12 months
Past 12 months
$1,927,500
-
$3,872,500
$3,700,000
-
-
$2,910,000
$3,800,000
-
-
$2,285,000
-
-
$2,556,250
-
-
-
-
-
-
-
-
-
Millan House
$3,987,500
Median Price
Past 12 months
Past 12 months
$1,927,500
-
$3,872,500
$3,700,000
-
-
$2,910,000
$3,800,000
-
-
$2,285,000
-
-
$2,556,250
-
-
-
-
-
-
-
-
-
Millan House
N/A
Avg. Price / ft2
Past 12 months
Past 12 months
-
-
-
-
-
-
-
-
-
-
-
-
-
-
-
-
-
-
-
-
-
-
-
Millan House
N/A
Avg. Price
Past 12 months
Past 12 months
-
-
-
-
-
-
-
-
-
-
-
$5,770,000
-
-
-
-
-
-
-
-
-
-
-
Millan House
N/A
Median Price
Past 12 months
Past 12 months
-
-
-
-
-
-
-
-
-
-
-
$5,770,000
-
-
-
-
-
-
-
-
-
-
-
Millan House
N/A
Avg. Price / ft2
Past 12 months
Past 12 months
-
-
-
-
-
-
-
-
-
-
-
-
-
-
-
-
-
-
-
-
-
-
-
Millan House
N/A
Avg. Price
Past 12 months
Past 12 months
-
-
-
-
-
-
-
-
-
-
-
-
-
-
-
-
-
-
-
-
-
-
-
Millan House
N/A
Median Price
Past 12 months
Past 12 months
-
-
-
-
-
-
-
-
-
-
-
-
-
-
-
-
-
-
-
-
-
-
-
21 East 79th Street
N/A
Avg. Price / ft2
Past 12 months
Past 12 months
-
-
-
-
$2,632
-
-
-
-
-
-
-
-
-
-
-
-
-
-
-
-
-
-
21 East 79th Street
$275,000
Avg. Price
Past 12 months
Past 12 months
-
-
$12,271,500
-
$7,000,000
-
-
$12,000,000
-
-
-
$11,900,000
-
-
$925,000
-
-
-
-
-
$8,000,000
$9,182,500
-
21 East 79th Street
$275,000
Median Price
Past 12 months
Past 12 months
-
-
$12,271,500
-
$7,000,000
-
-
$12,000,000
-
-
-
$11,900,000
-
-
$925,000
-
-
-
-
-
$8,000,000
$9,182,500
-
21 East 79th Street
N/A
Avg. Price / ft2
Past 12 months
Past 12 months
-
-
-
-
-
-
-
-
-
-
-
-
-
-
-
-
-
-
-
-
-
-
-
21 East 79th Street
N/A
Avg. Price
Past 12 months
Past 12 months
-
-
-
-
-
-
-
-
-
-
-
-
-
-
-
-
-
-
-
-
-
-
-
21 East 79th Street
N/A
Median Price
Past 12 months
Past 12 months
-
-
-
-
-
-
-
-
-
-
-
-
-
-
-
-
-
-
-
-
-
-
-
21 East 79th Street
N/A
Avg. Price / ft2
Past 12 months
Past 12 months
-
-
-
-
$2,632
-
-
-
-
-
-
-
-
-
-
-
-
-
-
-
-
-
-
21 East 79th Street
$275,000
Avg. Price
Past 12 months
Past 12 months
-
-
-
-
$7,000,000
-
-
-
-
-
-
-
-
-
-
-
-
-
-
-
-
-
-
21 East 79th Street
$275,000
Median Price
Past 12 months
Past 12 months
-
-
-
-
$7,000,000
-
-
-
-
-
-
-
-
-
-
-
-
-
-
-
-
-
-
21 East 79th Street
N/A
Avg. Price / ft2
Past 12 months
Past 12 months
-
-
-
-
-
-
-
-
-
-
-
-
-
-
-
-
-
-
-
-
-
-
-
21 East 79th Street
N/A
Avg. Price
Past 12 months
Past 12 months
-
-
-
-
-
-
-
$12,000,000
-
-
-
-
-
-
-
-
-
-
-
-
$7,000,000
-
-
21 East 79th Street
N/A
Median Price
Past 12 months
Past 12 months
-
-
-
-
-
-
-
$12,000,000
-
-
-
-
-
-
-
-
-
-
-
-
$7,000,000
-
-
21 East 79th Street
N/A
Avg. Price / ft2
Past 12 months
Past 12 months
-
-
-
-
-
-
-
-
-
-
-
-
-
-
-
-
-
-
-
-
-
-
-
21 East 79th Street
N/A
Avg. Price
Past 12 months
Past 12 months
-
-
-
-
-
-
-
-
-
-
-
$11,900,000
-
-
-
-
-
-
-
-
$9,000,000
$9,750,000
-
21 East 79th Street
N/A
Median Price
Past 12 months
Past 12 months
-
-
-
-
-
-
-
-
-
-
-
$11,900,000
-
-
-
-
-
-
-
-
$9,000,000
$9,750,000
-
21 East 79th Street
N/A
Avg. Price / ft2
Past 12 months
Past 12 months
-
-
-
-
-
-
-
-
-
-
-
-
-
-
-
-
-
-
-
-
-
-
-
21 East 79th Street
N/A
Avg. Price
Past 12 months
Past 12 months
-
-
$12,271,500
-
-
-
-
-
-
-
-
-
-
-
-
-
-
-
-
-
-
$8,615,000
-
21 East 79th Street
N/A
Median Price
Past 12 months
Past 12 months
-
-
$12,271,500
-
-
-
-
-
-
-
-
-
-
-
-
-
-
-
-
-
-
$8,615,000
-