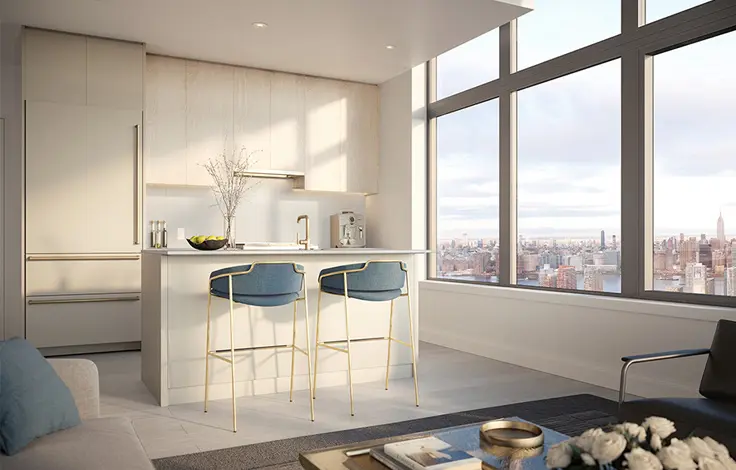
The Cherokee, 517 East 77th Street: Price Comparison
between York Avenue & Cherokee Place View Full Building Profile
The Cherokee
$383,250
Avg. Price
Past 12 months
Past 12 months
2023
$383,250
2022
$376,846
2021
$427,500
2020
$345,000
2019
$310,000
2018
$415,000
2017
$501,108
2016
$451,318
2015
$345,864
2014
$340,800
2013
$310,412
2012
$293,680
2011
$318,084
2010
-
2009
$356,671
2008
$383,333
2007
-
2006
$379,300
2005
$358,712
2004
$224,145
2003
$168,125
The Cherokee
$383,250
Median Price
Past 12 months
Past 12 months
2023
$383,250
2022
$376,846
2021
$427,500
2020
$345,000
2019
$310,000
2018
$415,000
2017
$460,324
2016
$415,000
2015
$310,000
2014
$300,000
2013
$303,578
2012
$280,000
2011
$319,000
2010
-
2009
$312,000
2008
$415,000
2007
-
2006
$390,000
2005
$359,000
2004
$259,000
2003
$165,000
The Cherokee
$416,500
Avg. Price
Past 12 months
Past 12 months
2023
$416,500
2022
$353,691
2021
-
2020
-
2019
-
2018
$295,000
2017
-
2016
$373,000
2015
$298,767
2014
$300,000
2013
$279,556
2012
$310,693
2011
-
2010
-
2009
-
2008
$420,000
2007
-
2006
-
2005
$273,750
2004
$259,000
2003
-
The Cherokee
$416,500
Median Price
Past 12 months
Past 12 months
2023
$416,500
2022
$353,691
2021
-
2020
-
2019
-
2018
$295,000
2017
-
2016
$373,000
2015
$298,767
2014
$300,000
2013
$279,556
2012
$318,078
2011
-
2010
-
2009
-
2008
$420,000
2007
-
2006
-
2005
$282,500
2004
$259,000
2003
-
The Cherokee
$350,000
Avg. Price
Past 12 months
Past 12 months
2023
$350,000
2022
-
2021
$427,500
2020
$345,000
2019
$310,000
2018
$535,000
2017
$501,108
2016
$445,000
2015
$392,962
2014
$351,000
2013
$322,534
2012
$276,667
2011
$328,792
2010
-
2009
$294,000
2008
$315,000
2007
-
2006
$407,250
2005
$426,682
2004
$270,575
2003
$152,833
The Cherokee
$350,000
Median Price
Past 12 months
Past 12 months
2023
$350,000
2022
-
2021
$427,500
2020
$345,000
2019
$310,000
2018
$535,000
2017
$460,324
2016
$445,000
2015
$392,962
2014
$327,500
2013
$322,534
2012
$275,000
2011
$323,750
2010
-
2009
$294,000
2008
$315,000
2007
-
2006
$394,500
2005
$375,000
2004
$301,726
2003
$140,000
The Cherokee
N/A
Avg. Price
Past 12 months
Past 12 months
2023
-
2022
-
2021
-
2020
-
2019
-
2018
-
2017
-
2016
$620,591
2015
-
2014
-
2013
-
2012
-
2011
-
2010
-
2009
$482,013
2008
$415,000
2007
-
2006
$267,500
2005
-
2004
-
2003
-
The Cherokee
N/A
Median Price
Past 12 months
Past 12 months
2023
-
2022
-
2021
-
2020
-
2019
-
2018
-
2017
-
2016
$620,591
2015
-
2014
-
2013
-
2012
-
2011
-
2010
-
2009
$482,013
2008
$415,000
2007
-
2006
$267,500
2005
-
2004
-
2003
-
The Cherokee
N/A
Avg. Price
Past 12 months
Past 12 months
2023
-
2022
-
2021
-
2020
-
2019
-
2018
-
2017
-
2016
-
2015
-
2014
-
2013
-
2012
-
2011
-
2010
-
2009
-
2008
-
2007
-
2006
-
2005
-
2004
-
2003
-
The Cherokee
N/A
Median Price
Past 12 months
Past 12 months
2023
-
2022
-
2021
-
2020
-
2019
-
2018
-
2017
-
2016
-
2015
-
2014
-
2013
-
2012
-
2011
-
2010
-
2009
-
2008
-
2007
-
2006
-
2005
-
2004
-
2003
-
The Cherokee
N/A
Avg. Price
Past 12 months
Past 12 months
2023
-
2022
-
2021
-
2020
-
2019
-
2018
-
2017
-
2016
-
2015
-
2014
-
2013
-
2012
-
2011
-
2010
-
2009
-
2008
-
2007
-
2006
-
2005
-
2004
-
2003
-
The Cherokee
N/A
Median Price
Past 12 months
Past 12 months
2023
-
2022
-
2021
-
2020
-
2019
-
2018
-
2017
-
2016
-
2015
-
2014
-
2013
-
2012
-
2011
-
2010
-
2009
-
2008
-
2007
-
2006
-
2005
-
2004
-
2003
-
The Cherokee
$1,000
Avg. Price / ft2
Past 12 months
Past 12 months
-
$883
-
-
$799
-
-
$1,037
$925
$922
-
-
$689
$731
$663
$662
$714
$660
$730
$750
$425
The Cherokee
$541,250
Avg. Price
Past 12 months
Past 12 months
$325,000
$553,500
-
-
$574,671
$400,000
$382,000
$409,143
$477,000
$483,589
$372,500
$277,000
$344,267
$292,500
$344,326
$430,000
$425,372
$383,263
$343,125
$216,857
$262,863
The Cherokee
$541,250
Median Price
Past 12 months
Past 12 months
$325,000
$553,500
-
-
$612,013
$400,000
$382,000
$400,000
$441,000
$464,500
$372,500
$285,000
$299,000
$292,500
$351,267
$430,000
$391,782
$330,277
$317,500
$200,000
$277,500
The Cherokee
N/A
Avg. Price / ft2
Past 12 months
Past 12 months
-
-
-
-
-
-
-
-
-
-
-
-
-
-
-
-
-
-
-
-
-
The Cherokee
N/A
Avg. Price
Past 12 months
Past 12 months
-
-
-
-
-
$400,000
$395,000
-
-
-
-
$295,000
$270,000
-
$323,622
-
-
$361,553
$260,000
$215,000
$205,000
The Cherokee
N/A
Median Price
Past 12 months
Past 12 months
-
-
-
-
-
$400,000
$395,000
-
-
-
-
$295,000
$270,000
-
$323,622
-
-
$361,553
$260,000
$200,000
$205,000
The Cherokee
$1,000
Avg. Price / ft2
Past 12 months
Past 12 months
-
$883
-
-
$916
-
-
$1,037
$925
-
-
-
$689
$725
$663
$662
$764
$598
$768
$750
$463
The Cherokee
$650,000
Avg. Price
Past 12 months
Past 12 months
-
$553,500
-
-
$412,000
-
$369,000
$377,500
$477,000
$445,634
-
$285,000
$381,400
$290,000
$347,450
$430,000
$351,693
$297,000
$331,000
$231,000
$226,667
The Cherokee
$650,000
Median Price
Past 12 months
Past 12 months
-
$553,500
-
-
$412,000
-
$369,000
$352,500
$441,000
$446,267
-
$285,000
$381,400
$290,000
$354,855
$430,000
$323,078
$297,000
$340,000
$249,000
$270,000
The Cherokee
N/A
Avg. Price / ft2
Past 12 months
Past 12 months
-
-
-
-
$683
-
-
-
-
$922
-
-
-
$738
-
-
$663
$722
$674
-
$387
The Cherokee
$432,500
Avg. Price
Past 12 months
Past 12 months
-
-
-
-
$700,000
-
-
$488,250
-
$559,500
$372,500
$251,000
-
$295,000
$352,534
-
$535,891
$577,500
$415,000
$180,000
$346,090
The Cherokee
$432,500
Median Price
Past 12 months
Past 12 months
-
-
-
-
$700,000
-
-
$488,250
-
$559,500
$372,500
$251,000
-
$295,000
$352,534
-
$535,891
$577,500
$415,000
$180,000
$346,090
The Cherokee
N/A
Avg. Price / ft2
Past 12 months
Past 12 months
-
-
-
-
-
-
-
-
-
-
-
-
-
-
-
-
-
-
-
-
-
The Cherokee
N/A
Avg. Price
Past 12 months
Past 12 months
-
-
-
-
-
-
-
-
-
-
-
-
-
-
-
-
-
-
-
-
-
The Cherokee
N/A
Median Price
Past 12 months
Past 12 months
-
-
-
-
-
-
-
-
-
-
-
-
-
-
-
-
-
-
-
-
-
The Cherokee
N/A
Avg. Price / ft2
Past 12 months
Past 12 months
-
-
-
-
-
-
-
-
-
-
-
-
-
-
-
-
-
-
-
-
-
The Cherokee
N/A
Avg. Price
Past 12 months
Past 12 months
-
-
-
-
-
-
-
-
-
-
-
-
-
-
-
-
-
-
-
-
-
The Cherokee
N/A
Median Price
Past 12 months
Past 12 months
-
-
-
-
-
-
-
-
-
-
-
-
-
-
-
-
-
-
-
-
-
400 East 85th Street
$878
Avg. Price / ft2
Past 12 months
Past 12 months
$930
$1,007
$833
$908
$1,006
$1,297
$1,021
$886
$889
$803
$743
$719
$803
$737
$623
$781
$763
$727
$623
$504
$405
400 East 85th Street
$823,833
Avg. Price
Past 12 months
Past 12 months
$688,500
$755,000
$625,000
$708,000
$944,000
$1,044,667
$692,500
$642,000
$1,134,000
$711,000
$884,857
$786,950
$1,088,750
$674,167
$542,786
$715,000
$674,200
$721,875
$448,875
$399,500
$335,000
400 East 85th Street
$785,000
Median Price
Past 12 months
Past 12 months
$670,000
$755,000
$625,000
$708,000
$705,000
$762,500
$600,000
$679,000
$860,000
$640,000
$605,000
$747,500
$957,500
$760,000
$482,500
$697,500
$755,000
$746,250
$467,500
$375,000
$335,000
400 East 85th Street
N/A
Avg. Price / ft2
Past 12 months
Past 12 months
-
-
-
-
-
-
-
-
-
-
-
$645
-
$685
-
-
$1,060
-
-
$533
-
400 East 85th Street
N/A
Avg. Price
Past 12 months
Past 12 months
-
-
-
-
-
$440,000
$397,500
$405,000
-
-
-
$300,000
-
$342,500
-
-
$530,000
-
$198,000
$266,250
-
400 East 85th Street
N/A
Median Price
Past 12 months
Past 12 months
-
-
-
-
-
$440,000
$397,500
$405,000
-
-
-
$300,000
-
$342,500
-
-
$530,000
-
$198,000
$266,250
-
400 East 85th Street
$966
Avg. Price / ft2
Past 12 months
Past 12 months
$966
-
$833
$908
$933
-
-
$886
$889
$752
$693
$669
$644
-
$612
$888
$643
-
$627
-
-
400 East 85th Street
$638,333
Avg. Price
Past 12 months
Past 12 months
$634,000
-
$625,000
$708,000
$702,500
$731,833
-
$676,000
$667,000
$648,333
$526,250
$456,500
$515,000
-
$476,900
$617,500
$450,000
$652,500
$470,000
-
-
400 East 85th Street
$640,000
Median Price
Past 12 months
Past 12 months
$630,500
-
$625,000
$708,000
$702,500
$755,000
-
$689,500
$667,000
$630,000
$530,000
$460,500
$515,000
-
$480,000
$617,500
$450,000
$652,500
$470,000
-
-
400 East 85th Street
$791
Avg. Price / ft2
Past 12 months
Past 12 months
$913
$1,007
-
-
$1,043
-
$1,021
-
-
$853
$843
$776
-
$764
$646
$754
$704
$727
$620
$475
$405
400 East 85th Street
$1,009,333
Avg. Price
Past 12 months
Past 12 months
$797,500
$755,000
-
-
$1,105,000
$1,297,500
$987,500
$980,000
$860,000
$805,000
$919,500
$860,000
$735,000
$840,000
$707,500
$763,750
$797,000
$745,000
$563,750
$488,333
$335,000
400 East 85th Street
$968,000
Median Price
Past 12 months
Past 12 months
$797,500
$755,000
-
-
$1,260,000
$1,297,500
$987,500
$980,000
$860,000
$805,000
$919,500
$870,000
$735,000
$840,000
$707,500
$777,500
$811,000
$840,000
$563,750
$540,000
$335,000
400 East 85th Street
N/A
Avg. Price / ft2
Past 12 months
Past 12 months
-
-
-
-
-
$1,297
-
-
-
-
-
-
-
-
-
-
-
-
-
-
-
400 East 85th Street
N/A
Avg. Price
Past 12 months
Past 12 months
-
-
-
-
-
$2,335,000
-
-
-
-
$2,250,000
$1,900,000
$1,180,000
-
-
-
-
-
-
-
-
400 East 85th Street
N/A
Median Price
Past 12 months
Past 12 months
-
-
-
-
-
$2,335,000
-
-
-
-
$2,250,000
$1,900,000
$1,180,000
-
-
-
-
-
-
-
-
400 East 85th Street
N/A
Avg. Price / ft2
Past 12 months
Past 12 months
-
-
-
-
-
-
-
-
-
-
-
-
$963
-
-
-
-
-
-
-
-
400 East 85th Street
N/A
Avg. Price
Past 12 months
Past 12 months
-
-
-
-
-
-
-
-
$1,875,000
-
-
-
$1,925,000
-
-
-
-
-
-
-
-
400 East 85th Street
N/A
Median Price
Past 12 months
Past 12 months
-
-
-
-
-
-
-
-
$1,875,000
-
-
-
$1,925,000
-
-
-
-
-
-
-
-
400 East 85th Street
N/A
Avg. Price / ft2
Past 12 months
Past 12 months
-
-
-
-
-
-
-
-
-
-
-
-
-
-
-
-
-
-
-
-
-
400 East 85th Street
N/A
Avg. Price
Past 12 months
Past 12 months
-
-
-
-
-
-
-
-
-
-
-
-
-
-
-
-
-
-
-
-
-
400 East 85th Street
N/A
Median Price
Past 12 months
Past 12 months
-
-
-
-
-
-
-
-
-
-
-
-
-
-
-
-
-
-
-
-
-
The York Gate
$811
Avg. Price / ft2
Past 12 months
Past 12 months
$847
$835
$754
-
$834
$856
$783
$829
$818
$677
$606
$572
$603
$653
$533
$743
$698
$660
$641
$487
$401
The York Gate
$446,100
Avg. Price
Past 12 months
Past 12 months
$404,100
$500,625
$879,750
-
$595,000
$639,111
$638,313
$535,500
$640,313
$406,411
$454,094
$389,611
$404,000
$501,563
$435,000
$454,500
$571,300
$512,600
$343,136
$298,917
$349,953
The York Gate
$440,500
Median Price
Past 12 months
Past 12 months
$405,000
$515,000
$597,500
-
$561,000
$430,000
$578,750
$487,500
$567,000
$356,500
$400,000
$325,000
$445,000
$510,000
$435,000
$440,000
$585,000
$524,500
$304,000
$242,500
$353,375
The York Gate
$796
Avg. Price / ft2
Past 12 months
Past 12 months
$796
$837
-
-
$814
$841
$817
$853
$753
$686
$622
$574
$570
$594
-
$713
-
$674
$648
$511
$366
The York Gate
$411,833
Avg. Price
Past 12 months
Past 12 months
$440,167
$465,833
-
-
$427,500
$430,667
$461,333
$384,000
$387,000
$312,179
$320,000
$292,167
$305,000
$356,250
$390,000
$372,333
$585,000
$346,750
$302,000
$233,250
$199,333
The York Gate
$440,500
Median Price
Past 12 months
Past 12 months
$440,500
$477,500
-
-
$427,500
$424,500
$425,000
$384,000
$387,000
$302,500
$320,000
$300,000
$305,000
$356,250
$390,000
$345,000
$585,000
$346,750
$301,500
$228,750
$213,000
The York Gate
$826
Avg. Price / ft2
Past 12 months
Past 12 months
$947
$829
$701
-
$847
-
$771
$780
$831
$672
$598
$571
$614
$673
$533
$772
$698
$655
$630
$469
$432
The York Gate
$497,500
Avg. Price
Past 12 months
Past 12 months
$350,000
$605,000
$564,667
-
$678,750
$609,000
$599,375
$508,333
$724,750
$526,583
$474,438
$438,333
$470,000
$550,000
$480,000
$536,667
$567,875
$498,929
$397,983
$327,500
$352,386
The York Gate
$497,500
Median Price
Past 12 months
Past 12 months
$350,000
$605,000
$545,000
-
$658,500
$609,000
$597,500
$575,000
$619,250
$518,750
$482,000
$437,500
$450,000
$530,000
$480,000
$460,000
$577,500
$549,000
$375,000
$267,500
$356,750
The York Gate
N/A
Avg. Price / ft2
Past 12 months
Past 12 months
-
-
-
-
-
-
-
-
-
-
-
-
-
-
-
-
-
-
-
-
$347
The York Gate
N/A
Avg. Price
Past 12 months
Past 12 months
-
-
-
-
-
-
-
$920,000
-
-
$775,000
-
-
-
-
-
-
$940,000
-
$550,000
$562,500
The York Gate
N/A
Median Price
Past 12 months
Past 12 months
-
-
-
-
-
-
-
$920,000
-
-
$775,000
-
-
-
-
-
-
$940,000
-
$550,000
$562,500
The York Gate
N/A
Avg. Price / ft2
Past 12 months
Past 12 months
-
-
-
-
-
-
-
-
-
-
-
-
-
-
-
-
-
-
-
-
-
The York Gate
N/A
Avg. Price
Past 12 months
Past 12 months
-
-
-
-
-
-
$1,325,000
-
-
-
-
-
-
-
-
-
-
-
-
-
-
The York Gate
N/A
Median Price
Past 12 months
Past 12 months
-
-
-
-
-
-
$1,325,000
-
-
-
-
-
-
-
-
-
-
-
-
-
-
The York Gate
N/A
Avg. Price / ft2
Past 12 months
Past 12 months
-
-
$913
-
-
-
-
-
-
-
-
-
-
-
-
-
-
-
-
-
-
The York Gate
N/A
Avg. Price
Past 12 months
Past 12 months
-
-
$1,825,000
-
-
-
-
-
-
-
-
-
-
-
-
-
-
-
-
-
-
The York Gate
N/A
Median Price
Past 12 months
Past 12 months
-
-
$1,825,000
-
-
-
-
-
-
-
-
-
-
-
-
-
-
-
-
-
-
The York Gate
N/A
Avg. Price / ft2
Past 12 months
Past 12 months
-
-
-
-
-
$886
-
-
-
-
-
-
-
-
-
-
-
-
-
-
-
The York Gate
N/A
Avg. Price
Past 12 months
Past 12 months
-
-
-
-
-
$1,950,000
-
-
-
-
-
-
-
-
-
-
-
-
-
-
-
The York Gate
N/A
Median Price
Past 12 months
Past 12 months
-
-
-
-
-
$1,950,000
-
-
-
-
-
-
-
-
-
-
-
-
-
-
-
The John Jay House
$682
Avg. Price / ft2
Past 12 months
Past 12 months
$751
$792
$811
$756
$753
$741
$798
$834
$733
$507
$583
$728
$658
$681
$567
$705
$669
$606
$557
$573
$333
The John Jay House
$417,833
Avg. Price
Past 12 months
Past 12 months
$437,333
$614,167
$761,250
$570,500
$565,000
$666,333
$602,500
$579,450
$758,250
$417,750
$423,625
$657,066
$510,729
$549,000
$350,000
$532,750
$472,407
$401,020
$441,820
$458,882
$250,000
The John Jay House
$410,000
Median Price
Past 12 months
Past 12 months
$420,000
$540,000
$741,250
$570,500
$565,000
$612,000
$597,500
$570,000
$781,500
$343,000
$411,250
$657,066
$430,965
$529,000
$350,000
$532,750
$434,350
$421,060
$422,500
$320,000
$250,000
The John Jay House
$782
Avg. Price / ft2
Past 12 months
Past 12 months
$840
$917
$770
-
-
-
-
-
-
$600
$674
$620
$709
-
$600
-
$810
$684
$627
$507
-
The John Jay House
$405,500
Avg. Price
Past 12 months
Past 12 months
$401,000
$550,000
$385,000
-
-
-
-
$327,500
-
$300,000
$337,000
$310,000
$354,450
-
$300,000
-
$405,000
$342,000
$313,442
$253,500
-
The John Jay House
$410,000
Median Price
Past 12 months
Past 12 months
$401,000
$550,000
$385,000
-
-
-
-
$327,500
-
$300,000
$337,000
$310,000
$354,450
-
$300,000
-
$405,000
$342,000
$313,442
$265,000
-
The John Jay House
$581
Avg. Price / ft2
Past 12 months
Past 12 months
$662
$768
$744
$756
$753
$741
$798
$817
$623
$387
$551
-
$648
$681
$533
$705
$645
$566
$563
$597
$333
The John Jay House
$442,500
Avg. Price
Past 12 months
Past 12 months
$510,000
$627,000
$565,000
$570,500
$565,000
$556,000
$602,500
$621,250
$474,000
$293,000
$414,000
-
$482,983
$549,000
$400,000
$532,750
$483,642
$430,530
$422,500
$484,565
$250,000
The John Jay House
$442,500
Median Price
Past 12 months
Past 12 months
$510,000
$530,000
$565,000
$570,500
$565,000
$556,000
$597,500
$621,250
$474,000
$293,000
$417,500
-
$430,965
$529,000
$400,000
$532,750
$475,925
$430,530
$422,500
$504,504
$250,000
The John Jay House
N/A
Avg. Price / ft2
Past 12 months
Past 12 months
-
-
$870
-
-
-
-
$869
$955
$654
$561
$837
$627
-
-
-
-
-
$483
$625
-
The John Jay House
N/A
Avg. Price
Past 12 months
Past 12 months
-
-
$1,017,500
-
-
$887,000
-
$999,750
$1,042,500
$785,000
$645,000
$1,004,131
$722,500
-
-
-
-
-
$579,858
$715,589
-
The John Jay House
N/A
Median Price
Past 12 months
Past 12 months
-
-
$920,000
-
-
$887,000
-
$999,750
$1,042,500
$785,000
$645,000
$1,004,131
$722,500
-
-
-
-
-
$579,858
$715,589
-
The John Jay House
N/A
Avg. Price / ft2
Past 12 months
Past 12 months
-
-
-
-
-
-
-
-
-
-
-
-
-
-
-
-
-
-
-
-
-
The John Jay House
N/A
Avg. Price
Past 12 months
Past 12 months
-
-
-
-
-
-
-
-
-
-
-
-
-
-
-
-
-
-
-
-
-
The John Jay House
N/A
Median Price
Past 12 months
Past 12 months
-
-
-
-
-
-
-
-
-
-
-
-
-
-
-
-
-
-
-
-
-
The John Jay House
N/A
Avg. Price / ft2
Past 12 months
Past 12 months
-
-
-
-
-
-
-
-
-
-
-
-
-
-
-
-
-
-
-
-
-
The John Jay House
N/A
Avg. Price
Past 12 months
Past 12 months
-
-
-
-
-
-
-
-
-
-
-
-
-
-
-
-
-
-
-
-
-
The John Jay House
N/A
Median Price
Past 12 months
Past 12 months
-
-
-
-
-
-
-
-
-
-
-
-
-
-
-
-
-
-
-
-
-
Gracie Gardens
N/A
Avg. Price / ft2
Past 12 months
Past 12 months
$950
-
$673
$625
-
-
-
$537
$774
$467
$545
$699
-
-
$596
$666
$676
$554
$571
-
$367
Gracie Gardens
$505,000
Avg. Price
Past 12 months
Past 12 months
$822,500
$635,000
$817,083
$656,250
-
$1,050,000
-
$510,000
$773,333
$687,800
$545,000
$1,314,500
-
-
$715,000
$757,500
$712,250
$665,000
$526,333
$558,400
$385,000
Gracie Gardens
$505,000
Median Price
Past 12 months
Past 12 months
$822,500
$635,000
$640,000
$656,250
-
$1,050,000
-
$510,000
$695,000
$550,000
$545,000
$1,314,500
-
-
$715,000
$732,500
$697,000
$665,000
$500,000
$449,000
$385,000
Gracie Gardens
N/A
Avg. Price / ft2
Past 12 months
Past 12 months
-
-
-
-
-
-
-
-
-
-
-
-
-
-
-
-
-
-
-
-
-
Gracie Gardens
$505,000
Avg. Price
Past 12 months
Past 12 months
$505,000
-
-
-
-
-
-
-
-
-
-
-
-
-
-
-
-
-
-
$295,000
-
Gracie Gardens
$505,000
Median Price
Past 12 months
Past 12 months
$505,000
-
-
-
-
-
-
-
-
-
-
-
-
-
-
-
-
-
-
$295,000
-
Gracie Gardens
N/A
Avg. Price / ft2
Past 12 months
Past 12 months
-
-
$692
-
-
-
-
-
$774
$200
$545
-
-
-
-
-
$702
-
$571
-
-
Gracie Gardens
N/A
Avg. Price
Past 12 months
Past 12 months
-
$635,000
$610,625
-
-
-
-
-
$685,000
$419,667
$545,000
-
-
-
-
-
$612,500
-
$526,333
$428,000
-
Gracie Gardens
N/A
Median Price
Past 12 months
Past 12 months
-
$635,000
$612,500
-
-
-
-
-
$685,000
$529,000
$545,000
-
-
-
-
-
$612,500
-
$500,000
$428,000
-
Gracie Gardens
N/A
Avg. Price / ft2
Past 12 months
Past 12 months
$950
-
$595
$625
-
-
-
$537
-
$733
-
$699
-
-
$596
$666
$625
$554
-
-
$367
Gracie Gardens
N/A
Avg. Price
Past 12 months
Past 12 months
$1,140,000
-
$655,000
$656,250
-
$1,050,000
-
$510,000
$950,000
$880,000
-
$979,000
-
-
$715,000
$757,500
$812,000
$665,000
-
$689,667
$385,000
Gracie Gardens
N/A
Median Price
Past 12 months
Past 12 months
$1,140,000
-
$655,000
$656,250
-
$1,050,000
-
$510,000
$950,000
$880,000
-
$979,000
-
-
$715,000
$732,500
$812,000
$665,000
-
$775,000
$385,000
Gracie Gardens
N/A
Avg. Price / ft2
Past 12 months
Past 12 months
-
-
-
-
-
-
-
-
-
-
-
-
-
-
-
-
-
-
-
-
-
Gracie Gardens
N/A
Avg. Price
Past 12 months
Past 12 months
-
-
$1,805,000
-
-
-
-
-
-
$1,300,000
-
-
-
-
-
-
-
-
-
-
-
Gracie Gardens
N/A
Median Price
Past 12 months
Past 12 months
-
-
$1,805,000
-
-
-
-
-
-
$1,300,000
-
-
-
-
-
-
-
-
-
-
-
Gracie Gardens
N/A
Avg. Price / ft2
Past 12 months
Past 12 months
-
-
-
-
-
-
-
-
-
-
-
-
-
-
-
-
-
-
-
-
-
Gracie Gardens
N/A
Avg. Price
Past 12 months
Past 12 months
-
-
-
-
-
-
-
-
-
-
-
$1,650,000
-
-
-
-
-
-
-
-
-
Gracie Gardens
N/A
Median Price
Past 12 months
Past 12 months
-
-
-
-
-
-
-
-
-
-
-
$1,650,000
-
-
-
-
-
-
-
-
-
Gracie Gardens
N/A
Avg. Price / ft2
Past 12 months
Past 12 months
-
-
-
-
-
-
-
-
-
-
-
-
-
-
-
-
-
-
-
-
-
Gracie Gardens
N/A
Avg. Price
Past 12 months
Past 12 months
-
-
-
-
-
-
-
-
-
-
-
-
-
-
-
-
-
-
-
-
-
Gracie Gardens
N/A
Median Price
Past 12 months
Past 12 months
-
-
-
-
-
-
-
-
-
-
-
-
-
-
-
-
-
-
-
-
-
Southgate
N/A
Avg. Price / ft2
Past 12 months
Past 12 months
-
-
$836
$947
$990
$813
$905
$824
-
$806
-
$835
$712
$693
$853
-
$844
$920
$625
$578
$536
Southgate
$2,205,000
Avg. Price
Past 12 months
Past 12 months
$2,765,000
-
$937,500
$1,297,500
$850,000
$856,833
$1,045,000
$714,069
$1,291,875
$601,000
$610,656
$961,250
$874,451
$485,000
$683,750
$500,000
$774,572
$1,684,857
$566,667
$457,523
$479,853
Southgate
$1,147,500
Median Price
Past 12 months
Past 12 months
$1,660,000
-
$1,015,000
$1,297,500
$850,000
$675,000
$740,000
$718,138
$1,291,875
$650,000
$588,313
$995,000
$865,000
$485,000
$690,000
$500,000
$774,572
$1,150,000
$545,000
$487,800
$439,000
Southgate
N/A
Avg. Price / ft2
Past 12 months
Past 12 months
-
-
-
-
-
-
-
-
-
-
-
-
-
-
-
-
-
$681
$638
-
-
Southgate
N/A
Avg. Price
Past 12 months
Past 12 months
-
-
-
-
-
-
-
-
-
-
$316,000
-
-
-
-
-
-
$395,000
$435,000
-
$214,968
Southgate
N/A
Median Price
Past 12 months
Past 12 months
-
-
-
-
-
-
-
-
-
-
$316,000
-
-
-
-
-
-
$395,000
$370,000
-
$214,968
Southgate
N/A
Avg. Price / ft2
Past 12 months
Past 12 months
-
-
$758
-
$990
$813
$767
$824
-
$806
-
-
$683
$693
-
-
$844
$688
$514
$578
$546
Southgate
$580,000
Avg. Price
Past 12 months
Past 12 months
$635,000
-
$617,500
-
$850,000
$594,000
$633,333
$714,069
-
$601,000
$588,313
-
$544,667
$485,000
$605,000
$500,000
$774,572
$464,500
$430,000
$457,523
$426,667
Southgate
$580,000
Median Price
Past 12 months
Past 12 months
$635,000
-
$617,500
-
$850,000
$617,500
$595,000
$718,138
-
$650,000
$588,313
-
$601,500
$485,000
$605,000
$500,000
$774,572
$464,500
$400,000
$487,800
$390,000
Southgate
N/A
Avg. Price / ft2
Past 12 months
Past 12 months
-
-
$914
$959
-
-
-
-
-
-
-
$835
$740
-
$853
-
-
$920
$835
-
$516
Southgate
N/A
Avg. Price
Past 12 months
Past 12 months
-
-
$1,257,500
$815,000
-
$1,382,500
$1,200,000
-
$1,291,875
-
$950,000
$961,250
$1,121,789
-
$762,500
-
-
$2,987,500
$835,000
-
$621,333
Southgate
N/A
Median Price
Past 12 months
Past 12 months
-
-
$1,257,500
$815,000
-
$1,382,500
$1,200,000
-
$1,291,875
-
$950,000
$995,000
$1,011,078
-
$762,500
-
-
$2,987,500
$710,000
-
$650,000
Southgate
N/A
Avg. Price / ft2
Past 12 months
Past 12 months
-
-
-
$934
-
-
$1,181
-
-
-
-
-
-
-
-
-
-
$1,389
-
-
-
Southgate
$6,000,000
Avg. Price
Past 12 months
Past 12 months
$6,000,000
-
-
$1,780,000
-
-
$2,125,000
-
-
-
-
-
-
-
-
-
-
$2,247,500
-
-
-
Southgate
$6,000,000
Median Price
Past 12 months
Past 12 months
$6,000,000
-
-
$1,780,000
-
-
$2,125,000
-
-
-
-
-
-
-
-
-
-
$2,247,500
-
-
-
Southgate
N/A
Avg. Price / ft2
Past 12 months
Past 12 months
-
-
-
-
-
-
-
-
-
-
-
-
-
-
-
-
-
-
-
-
-
Southgate
N/A
Avg. Price
Past 12 months
Past 12 months
-
-
-
-
-
-
-
-
-
-
-
-
-
-
-
-
-
-
-
-
-
Southgate
N/A
Median Price
Past 12 months
Past 12 months
-
-
-
-
-
-
-
-
-
-
-
-
-
-
-
-
-
-
-
-
-
Southgate
N/A
Avg. Price / ft2
Past 12 months
Past 12 months
-
-
-
-
-
-
-
-
-
-
-
-
-
-
-
-
-
-
-
-
-
Southgate
N/A
Avg. Price
Past 12 months
Past 12 months
-
-
-
-
-
-
-
-
-
-
-
-
-
-
-
-
-
-
-
-
-
Southgate
N/A
Median Price
Past 12 months
Past 12 months
-
-
-
-
-
-
-
-
-
-
-
-
-
-
-
-
-
-
-
-
-
519 East 86th Street
N/A
Avg. Price / ft2
Past 12 months
Past 12 months
-
$701
-
-
$881
$974
-
-
-
$649
$773
$742
$589
-
$583
$689
$826
$555
-
$520
$333
519 East 86th Street
$879,500
Avg. Price
Past 12 months
Past 12 months
$879,500
$1,493,500
-
-
$749,000
$1,442,500
$750,000
$1,670,000
$2,650,000
$990,100
$850,000
$1,178,750
$795,000
-
$700,000
$620,000
$729,500
$499,550
-
$510,000
$336,250
519 East 86th Street
$879,500
Median Price
Past 12 months
Past 12 months
$879,500
$1,493,500
-
-
$749,000
$1,442,500
$750,000
$1,670,000
$2,650,000
$600,000
$850,000
$1,178,750
$795,000
-
$700,000
$620,000
$729,500
$499,550
-
$510,000
$336,250
519 East 86th Street
N/A
Avg. Price / ft2
Past 12 months
Past 12 months
-
-
-
-
-
-
-
-
-
-
-
-
-
-
-
-
-
-
-
-
-
519 East 86th Street
N/A
Avg. Price
Past 12 months
Past 12 months
-
-
-
-
-
-
-
-
-
-
-
-
-
-
-
-
-
-
-
-
-
519 East 86th Street
N/A
Median Price
Past 12 months
Past 12 months
-
-
-
-
-
-
-
-
-
-
-
-
-
-
-
-
-
-
-
-
-
519 East 86th Street
N/A
Avg. Price / ft2
Past 12 months
Past 12 months
-
-
-
-
$881
-
-
-
-
$649
-
-
-
-
-
$689
-
$555
-
$520
$333
519 East 86th Street
N/A
Avg. Price
Past 12 months
Past 12 months
-
-
-
-
$749,000
-
-
$545,000
-
$581,375
-
-
-
-
-
$620,000
$650,000
$499,550
-
$510,000
$336,250
519 East 86th Street
N/A
Median Price
Past 12 months
Past 12 months
-
-
-
-
$749,000
-
-
$545,000
-
$580,000
-
-
-
-
-
$620,000
$650,000
$499,550
-
$510,000
$336,250
519 East 86th Street
N/A
Avg. Price / ft2
Past 12 months
Past 12 months
-
$701
-
-
-
-
-
-
-
-
$773
$551
-
-
$583
-
$826
-
-
-
-
519 East 86th Street
$879,500
Avg. Price
Past 12 months
Past 12 months
$879,500
$687,000
-
-
-
$985,000
$750,000
-
-
-
$850,000
$540,000
-
-
$700,000
-
$809,000
-
-
-
-
519 East 86th Street
$879,500
Median Price
Past 12 months
Past 12 months
$879,500
$687,000
-
-
-
$985,000
$750,000
-
-
-
$850,000
$540,000
-
-
$700,000
-
$809,000
-
-
-
-
519 East 86th Street
N/A
Avg. Price / ft2
Past 12 months
Past 12 months
-
-
-
-
-
-
-
-
-
-
-
-
$589
-
-
-
-
-
-
-
-
519 East 86th Street
N/A
Avg. Price
Past 12 months
Past 12 months
-
-
-
-
-
-
-
-
-
$2,625,000
-
-
$795,000
-
-
-
-
-
-
-
-
519 East 86th Street
N/A
Median Price
Past 12 months
Past 12 months
-
-
-
-
-
-
-
-
-
$2,625,000
-
-
$795,000
-
-
-
-
-
-
-
-
519 East 86th Street
N/A
Avg. Price / ft2
Past 12 months
Past 12 months
-
-
-
-
-
$974
-
-
-
-
-
$932
-
-
-
-
-
-
-
-
-
519 East 86th Street
N/A
Avg. Price
Past 12 months
Past 12 months
-
$2,300,000
-
-
-
$1,900,000
-
$2,795,000
-
-
-
$1,817,500
-
-
-
-
-
-
-
-
-
519 East 86th Street
N/A
Median Price
Past 12 months
Past 12 months
-
$2,300,000
-
-
-
$1,900,000
-
$2,795,000
-
-
-
$1,817,500
-
-
-
-
-
-
-
-
-
519 East 86th Street
N/A
Avg. Price / ft2
Past 12 months
Past 12 months
-
-
-
-
-
-
-
-
-
-
-
-
-
-
-
-
-
-
-
-
-
519 East 86th Street
N/A
Avg. Price
Past 12 months
Past 12 months
-
-
-
-
-
-
-
-
-
-
-
-
-
-
-
-
-
-
-
-
-
519 East 86th Street
N/A
Median Price
Past 12 months
Past 12 months
-
-
-
-
-
-
-
-
-
-
-
-
-
-
-
-
-
-
-
-
-
The Black & Whites
N/A
Avg. Price / ft2
Past 12 months
Past 12 months
-
-
-
-
-
-
-
-
-
-
-
-
$665
-
-
-
-
$668
$795
-
-
The Black & Whites
N/A
Avg. Price
Past 12 months
Past 12 months
-
-
-
$475,000
-
-
-
-
-
$775,000
$1,236,000
-
$399,000
-
-
-
-
$735,000
$477,000
-
-
The Black & Whites
N/A
Median Price
Past 12 months
Past 12 months
-
-
-
$475,000
-
-
-
-
-
$775,000
$1,236,000
-
$399,000
-
-
-
-
$735,000
$477,000
-
-
The Black & Whites
N/A
Avg. Price / ft2
Past 12 months
Past 12 months
-
-
-
-
-
-
-
-
-
-
-
-
-
-
-
-
-
-
-
-
-
The Black & Whites
N/A
Avg. Price
Past 12 months
Past 12 months
-
-
-
-
-
-
-
-
-
-
-
-
-
-
-
-
-
-
-
-
-
The Black & Whites
N/A
Median Price
Past 12 months
Past 12 months
-
-
-
-
-
-
-
-
-
-
-
-
-
-
-
-
-
-
-
-
-
The Black & Whites
N/A
Avg. Price / ft2
Past 12 months
Past 12 months
-
-
-
-
-
-
-
-
-
-
-
-
$665
-
-
-
-
-
$795
-
-
The Black & Whites
N/A
Avg. Price
Past 12 months
Past 12 months
-
-
-
$475,000
-
-
-
-
-
$450,000
-
-
$399,000
-
-
-
-
-
$477,000
-
-
The Black & Whites
N/A
Median Price
Past 12 months
Past 12 months
-
-
-
$475,000
-
-
-
-
-
$450,000
-
-
$399,000
-
-
-
-
-
$477,000
-
-
The Black & Whites
N/A
Avg. Price / ft2
Past 12 months
Past 12 months
-
-
-
-
-
-
-
-
-
-
-
-
-
-
-
-
-
$668
-
-
-
The Black & Whites
N/A
Avg. Price
Past 12 months
Past 12 months
-
-
-
-
-
-
-
-
-
-
-
-
-
-
-
-
-
$735,000
-
-
-
The Black & Whites
N/A
Median Price
Past 12 months
Past 12 months
-
-
-
-
-
-
-
-
-
-
-
-
-
-
-
-
-
$735,000
-
-
-
The Black & Whites
N/A
Avg. Price / ft2
Past 12 months
Past 12 months
-
-
-
-
-
-
-
-
-
-
-
-
-
-
-
-
-
-
-
-
-
The Black & Whites
N/A
Avg. Price
Past 12 months
Past 12 months
-
-
-
-
-
-
-
-
-
$1,100,000
$1,236,000
-
-
-
-
-
-
-
-
-
-
The Black & Whites
N/A
Median Price
Past 12 months
Past 12 months
-
-
-
-
-
-
-
-
-
$1,100,000
$1,236,000
-
-
-
-
-
-
-
-
-
-
The Black & Whites
N/A
Avg. Price / ft2
Past 12 months
Past 12 months
-
-
-
-
-
-
-
-
-
-
-
-
-
-
-
-
-
-
-
-
-
The Black & Whites
N/A
Avg. Price
Past 12 months
Past 12 months
-
-
-
-
-
-
-
-
-
-
-
-
-
-
-
-
-
-
-
-
-
The Black & Whites
N/A
Median Price
Past 12 months
Past 12 months
-
-
-
-
-
-
-
-
-
-
-
-
-
-
-
-
-
-
-
-
-
The Black & Whites
N/A
Avg. Price / ft2
Past 12 months
Past 12 months
-
-
-
-
-
-
-
-
-
-
-
-
-
-
-
-
-
-
-
-
-
The Black & Whites
N/A
Avg. Price
Past 12 months
Past 12 months
-
-
-
-
-
-
-
-
-
-
-
-
-
-
-
-
-
-
-
-
-
The Black & Whites
N/A
Median Price
Past 12 months
Past 12 months
-
-
-
-
-
-
-
-
-
-
-
-
-
-
-
-
-
-
-
-
-
315 East 77th Street
N/A
Avg. Price / ft2
Past 12 months
Past 12 months
$815
$929
-
-
$856
$963
$878
-
$756
$756
$685
-
$715
$668
-
$769
$763
$531
$603
$519
$462
315 East 77th Street
$387,500
Avg. Price
Past 12 months
Past 12 months
$540,000
$512,500
-
$505,000
$770,000
$744,781
$566,667
$449,500
$762,483
$460,000
$472,167
$506,500
$517,500
$493,333
-
$481,666
$468,750
$405,200
$424,400
$472,000
$286,200
315 East 77th Street
$387,500
Median Price
Past 12 months
Past 12 months
$540,000
$512,500
-
$505,000
$770,000
$702,500
$590,000
$449,500
$807,500
$460,000
$437,500
$439,500
$450,000
$497,500
-
$499,999
$468,750
$425,000
$320,000
$442,000
$300,000
315 East 77th Street
N/A
Avg. Price / ft2
Past 12 months
Past 12 months
-
-
-
-
-
-
-
-
-
-
-
-
-
-
-
-
-
-
-
-
-
315 East 77th Street
N/A
Avg. Price
Past 12 months
Past 12 months
-
-
-
-
-
-
$320,000
$300,000
-
-
-
-
-
-
-
$255,000
-
$260,000
-
$159,000
-
315 East 77th Street
N/A
Median Price
Past 12 months
Past 12 months
-
-
-
-
-
-
$320,000
$300,000
-
-
-
-
-
-
-
$255,000
-
$260,000
-
$159,000
-
315 East 77th Street
N/A
Avg. Price / ft2
Past 12 months
Past 12 months
$815
$929
-
-
-
$1,017
-
-
$673
$756
-
-
$701
$719
-
$769
$763
$531
$498
$484
$462
315 East 77th Street
$387,500
Avg. Price
Past 12 months
Past 12 months
$540,000
$512,500
-
$505,000
-
$592,563
$590,000
$599,000
$475,000
$460,000
$408,750
$402,250
$438,750
$485,000
-
$499,999
$468,750
$441,500
$318,100
$339,000
$255,250
315 East 77th Street
$387,500
Median Price
Past 12 months
Past 12 months
$540,000
$512,500
-
$505,000
-
$592,563
$590,000
$599,000
$475,000
$460,000
$408,750
$402,250
$438,750
$485,000
-
$499,999
$468,750
$440,000
$318,100
$339,000
$266,500
315 East 77th Street
N/A
Avg. Price / ft2
Past 12 months
Past 12 months
-
-
-
-
$856
$909
$878
-
$923
-
$685
-
$730
$567
-
-
-
-
$708
$554
-
315 East 77th Street
N/A
Avg. Price
Past 12 months
Past 12 months
-
-
-
-
$770,000
$897,000
$790,000
-
$954,139
-
$599,000
$715,000
$675,000
$510,000
-
$690,000
-
-
$637,000
$583,500
$410,000
315 East 77th Street
N/A
Median Price
Past 12 months
Past 12 months
-
-
-
-
$770,000
$897,000
$790,000
-
$849,000
-
$599,000
$715,000
$675,000
$510,000
-
$690,000
-
-
$637,000
$604,500
$410,000
315 East 77th Street
N/A
Avg. Price / ft2
Past 12 months
Past 12 months
-
-
-
-
-
-
-
-
-
-
-
-
-
-
-
-
-
-
-
-
-
315 East 77th Street
N/A
Avg. Price
Past 12 months
Past 12 months
-
-
-
-
-
-
-
-
-
-
-
-
-
-
-
-
-
-
-
-
-
315 East 77th Street
N/A
Median Price
Past 12 months
Past 12 months
-
-
-
-
-
-
-
-
-
-
-
-
-
-
-
-
-
-
-
-
-
315 East 77th Street
N/A
Avg. Price / ft2
Past 12 months
Past 12 months
-
-
-
-
-
-
-
-
-
-
-
-
-
-
-
-
-
-
-
-
-
315 East 77th Street
N/A
Avg. Price
Past 12 months
Past 12 months
-
-
-
-
-
-
-
-
-
-
-
-
-
-
-
-
-
-
-
-
-
315 East 77th Street
N/A
Median Price
Past 12 months
Past 12 months
-
-
-
-
-
-
-
-
-
-
-
-
-
-
-
-
-
-
-
-
-
325 East 77th Street
N/A
Avg. Price / ft2
Past 12 months
Past 12 months
-
-
$872
$860
-
$1,105
$907
-
$926
$841
$730
$723
-
$681
$633
$906
$836
$800
$820
$551
$487
325 East 77th Street
N/A
Avg. Price
Past 12 months
Past 12 months
-
$515,000
$729,979
$692,410
-
$1,115,167
$901,000
$540,000
$907,500
$688,786
$725,000
$574,000
$765,000
$691,250
$570,000
$739,572
$723,683
$760,000
$880,750
$497,083
$363,000
325 East 77th Street
N/A
Median Price
Past 12 months
Past 12 months
-
$515,000
$736,707
$692,410
-
$1,145,000
$901,000
$360,000
$875,000
$620,000
$725,000
$575,500
$765,000
$691,250
$570,000
$721,000
$681,050
$675,000
$880,750
$490,000
$350,000
325 East 77th Street
N/A
Avg. Price / ft2
Past 12 months
Past 12 months
-
-
-
-
-
-
-
-
-
$748
-
-
-
-
-
-
$839
-
-
-
-
325 East 77th Street
N/A
Avg. Price
Past 12 months
Past 12 months
-
-
-
-
-
-
-
$340,000
-
$367,500
-
-
-
-
-
$340,000
$365,000
-
-
$220,000
$215,000
325 East 77th Street
N/A
Median Price
Past 12 months
Past 12 months
-
-
-
-
-
-
-
$340,000
-
$367,500
-
-
-
-
-
$340,000
$365,000
-
-
$220,000
$215,000
325 East 77th Street
N/A
Avg. Price / ft2
Past 12 months
Past 12 months
-
-
$881
$860
-
-
-
-
$839
$729
-
-
-
$575
-
$843
-
$804
-
$524
$389
325 East 77th Street
N/A
Avg. Price
Past 12 months
Past 12 months
-
$515,000
$731,638
$692,410
-
-
-
-
$755,000
$602,500
-
$528,000
-
$517,500
-
$691,431
$681,050
$675,000
-
$398,750
$397,500
325 East 77th Street
N/A
Median Price
Past 12 months
Past 12 months
-
$515,000
$748,414
$692,410
-
-
-
-
$755,000
$602,500
-
$528,000
-
$517,500
-
$691,431
$681,050
$675,000
-
$398,750
$397,500
325 East 77th Street
N/A
Avg. Price / ft2
Past 12 months
Past 12 months
-
-
$853
-
-
$1,105
$907
-
$955
$990
$730
$723
-
$786
$633
$969
$833
$798
$820
$578
$584
325 East 77th Street
N/A
Avg. Price
Past 12 months
Past 12 months
-
-
$725,000
-
-
$1,115,167
$901,000
$940,000
$958,333
$960,500
$725,000
$730,000
$765,000
$865,000
$570,000
$987,500
$1,125,000
$802,500
$880,750
$712,500
$590,000
325 East 77th Street
N/A
Median Price
Past 12 months
Past 12 months
-
-
$725,000
-
-
$1,145,000
$901,000
$940,000
$950,000
$784,000
$725,000
$730,000
$765,000
$865,000
$570,000
$987,500
$1,125,000
$802,500
$880,750
$712,500
$590,000
325 East 77th Street
N/A
Avg. Price / ft2
Past 12 months
Past 12 months
-
-
-
-
-
-
-
-
-
-
-
-
-
-
-
-
-
-
-
-
-
325 East 77th Street
N/A
Avg. Price
Past 12 months
Past 12 months
-
-
-
-
-
-
-
-
-
-
-
-
-
-
-
-
-
-
-
-
-
325 East 77th Street
N/A
Median Price
Past 12 months
Past 12 months
-
-
-
-
-
-
-
-
-
-
-
-
-
-
-
-
-
-
-
-
-
325 East 77th Street
N/A
Avg. Price / ft2
Past 12 months
Past 12 months
-
-
-
-
-
-
-
-
-
-
-
-
-
-
-
-
-
-
-
-
-
325 East 77th Street
N/A
Avg. Price
Past 12 months
Past 12 months
-
-
-
-
-
-
-
-
-
-
-
-
-
-
-
-
-
-
-
-
-
325 East 77th Street
N/A
Median Price
Past 12 months
Past 12 months
-
-
-
-
-
-
-
-
-
-
-
-
-
-
-
-
-
-
-
-
-