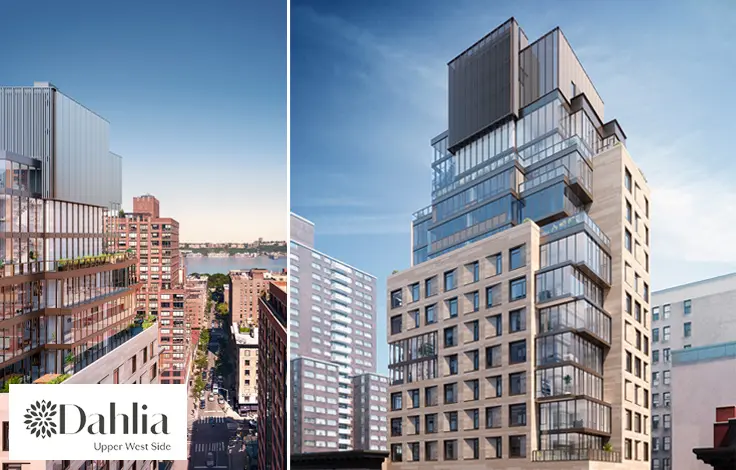
The Schuyler Arms, 305 West 98th Street: Price Comparison
between West End Avenue & Riverside Drive View Full Building Profile
The Schuyler Arms
$1,209,000
Avg. Price
Past 12 months
Past 12 months
2023
-
2022
$1,238,333
2021
$1,200,000
2020
-
2019
$1,461,667
2018
$1,022,250
2017
$1,185,800
2016
$958,500
2015
$1,087,500
2014
$1,200,000
2013
$1,220,000
2012
$891,250
2011
$1,238,750
2010
-
2009
$663,333
2008
$946,500
2007
$1,175,600
2006
$767,500
2005
$985,600
2004
$903,667
2003
$295,000
The Schuyler Arms
$1,209,000
Median Price
Past 12 months
Past 12 months
2023
-
2022
$1,150,000
2021
$1,200,000
2020
-
2019
$1,475,000
2018
$1,022,250
2017
$1,075,000
2016
$958,500
2015
$1,068,750
2014
$1,025,000
2013
$1,220,000
2012
$891,250
2011
$965,000
2010
-
2009
$670,000
2008
$900,000
2007
$1,140,000
2006
$767,500
2005
$999,000
2004
$800,000
2003
$295,000
The Schuyler Arms
N/A
Avg. Price
Past 12 months
Past 12 months
2023
-
2022
-
2021
-
2020
-
2019
-
2018
-
2017
-
2016
-
2015
-
2014
-
2013
-
2012
-
2011
-
2010
-
2009
-
2008
-
2007
-
2006
-
2005
-
2004
-
2003
-
The Schuyler Arms
N/A
Median Price
Past 12 months
Past 12 months
2023
-
2022
-
2021
-
2020
-
2019
-
2018
-
2017
-
2016
-
2015
-
2014
-
2013
-
2012
-
2011
-
2010
-
2009
-
2008
-
2007
-
2006
-
2005
-
2004
-
2003
-
The Schuyler Arms
$768,000
Avg. Price
Past 12 months
Past 12 months
2023
-
2022
$840,000
2021
-
2020
-
2019
$810,000
2018
$929,500
2017
$968,000
2016
$958,500
2015
$762,500
2014
$760,000
2013
-
2012
$783,500
2011
-
2010
-
2009
$625,000
2008
$675,000
2007
-
2006
$650,000
2005
$699,000
2004
-
2003
-
The Schuyler Arms
$768,000
Median Price
Past 12 months
Past 12 months
2023
-
2022
$840,000
2021
-
2020
-
2019
$810,000
2018
$929,500
2017
$968,000
2016
$958,500
2015
$762,500
2014
$760,000
2013
-
2012
$783,500
2011
-
2010
-
2009
$625,000
2008
$675,000
2007
-
2006
$650,000
2005
$699,000
2004
-
2003
-
The Schuyler Arms
N/A
Avg. Price
Past 12 months
Past 12 months
2023
-
2022
$1,150,000
2021
$1,200,000
2020
-
2019
-
2018
$1,115,000
2017
$1,240,250
2016
-
2015
$1,387,500
2014
$1,025,000
2013
$1,220,000
2012
$999,000
2011
$951,667
2010
-
2009
$682,500
2008
$1,052,500
2007
$1,044,750
2006
$885,000
2005
$1,057,250
2004
$903,667
2003
$295,000
The Schuyler Arms
N/A
Median Price
Past 12 months
Past 12 months
2023
-
2022
$1,150,000
2021
$1,200,000
2020
-
2019
-
2018
$1,115,000
2017
$1,200,000
2016
-
2015
$1,387,500
2014
$1,025,000
2013
$1,220,000
2012
$999,000
2011
$935,000
2010
-
2009
$682,500
2008
$1,130,000
2007
$1,072,000
2006
$885,000
2005
$1,134,500
2004
$800,000
2003
$295,000
The Schuyler Arms
$1,650,000
Avg. Price
Past 12 months
Past 12 months
2023
-
2022
$1,725,000
2021
-
2020
-
2019
$1,787,500
2018
-
2017
-
2016
-
2015
-
2014
-
2013
-
2012
-
2011
-
2010
-
2009
-
2008
-
2007
$1,699,000
2006
-
2005
-
2004
-
2003
-
The Schuyler Arms
$1,650,000
Median Price
Past 12 months
Past 12 months
2023
-
2022
$1,725,000
2021
-
2020
-
2019
$1,787,500
2018
-
2017
-
2016
-
2015
-
2014
-
2013
-
2012
-
2011
-
2010
-
2009
-
2008
-
2007
$1,699,000
2006
-
2005
-
2004
-
2003
-
The Schuyler Arms
N/A
Avg. Price
Past 12 months
Past 12 months
2023
-
2022
-
2021
-
2020
-
2019
-
2018
-
2017
-
2016
-
2015
-
2014
$1,990,000
2013
-
2012
-
2011
$2,100,000
2010
-
2009
-
2008
$900,000
2007
-
2006
-
2005
-
2004
-
2003
-
The Schuyler Arms
N/A
Median Price
Past 12 months
Past 12 months
2023
-
2022
-
2021
-
2020
-
2019
-
2018
-
2017
-
2016
-
2015
-
2014
$1,990,000
2013
-
2012
-
2011
$2,100,000
2010
-
2009
-
2008
$900,000
2007
-
2006
-
2005
-
2004
-
2003
-
The Schuyler Arms
N/A
Avg. Price
Past 12 months
Past 12 months
2023
-
2022
-
2021
-
2020
-
2019
-
2018
-
2017
-
2016
-
2015
-
2014
-
2013
-
2012
-
2011
-
2010
-
2009
-
2008
-
2007
-
2006
-
2005
-
2004
-
2003
-
The Schuyler Arms
N/A
Median Price
Past 12 months
Past 12 months
2023
-
2022
-
2021
-
2020
-
2019
-
2018
-
2017
-
2016
-
2015
-
2014
-
2013
-
2012
-
2011
-
2010
-
2009
-
2008
-
2007
-
2006
-
2005
-
2004
-
2003
-
320 West 83rd Street
N/A
Avg. Price / ft2
Past 12 months
Past 12 months
-
$1,116
-
$958
$886
-
-
-
-
$908
$752
$956
$508
-
$779
-
$883
$857
-
$602
-
320 West 83rd Street
N/A
Avg. Price
Past 12 months
Past 12 months
-
$1,591,000
-
$575,000
$620,000
-
$695,000
-
-
$545,000
$790,435
$592,500
$432,500
-
$545,000
-
$568,750
$562,192
$1,300,000
$415,400
-
320 West 83rd Street
N/A
Median Price
Past 12 months
Past 12 months
-
$1,591,000
-
$575,000
$620,000
-
$695,000
-
-
$545,000
$526,305
$592,500
$432,500
-
$545,000
-
$560,000
$562,192
$1,300,000
$432,000
-
320 West 83rd Street
N/A
Avg. Price / ft2
Past 12 months
Past 12 months
-
-
-
-
-
-
-
-
-
-
-
-
-
-
-
-
-
-
-
-
-
320 West 83rd Street
N/A
Avg. Price
Past 12 months
Past 12 months
-
-
-
-
-
-
-
-
-
-
-
-
-
-
-
-
-
-
-
-
-
320 West 83rd Street
N/A
Median Price
Past 12 months
Past 12 months
-
-
-
-
-
-
-
-
-
-
-
-
-
-
-
-
-
-
-
-
-
320 West 83rd Street
N/A
Avg. Price / ft2
Past 12 months
Past 12 months
-
-
-
$958
$886
-
-
-
-
$908
$752
$956
$508
-
$779
-
$883
$857
-
$602
-
320 West 83rd Street
N/A
Avg. Price
Past 12 months
Past 12 months
-
-
-
$575,000
$620,000
-
$695,000
-
-
$545,000
$488,153
$592,500
$432,500
-
$545,000
-
$568,750
$562,192
-
$415,400
-
320 West 83rd Street
N/A
Median Price
Past 12 months
Past 12 months
-
-
-
$575,000
$620,000
-
$695,000
-
-
$545,000
$488,153
$592,500
$432,500
-
$545,000
-
$560,000
$562,192
-
$432,000
-
320 West 83rd Street
N/A
Avg. Price / ft2
Past 12 months
Past 12 months
-
$1,116
-
-
-
-
-
-
-
-
-
-
-
-
-
-
-
-
-
-
-
320 West 83rd Street
N/A
Avg. Price
Past 12 months
Past 12 months
-
$1,591,000
-
-
-
-
-
-
-
-
$1,395,000
-
-
-
-
-
-
-
$1,300,000
-
-
320 West 83rd Street
N/A
Median Price
Past 12 months
Past 12 months
-
$1,591,000
-
-
-
-
-
-
-
-
$1,395,000
-
-
-
-
-
-
-
$1,300,000
-
-
320 West 83rd Street
N/A
Avg. Price / ft2
Past 12 months
Past 12 months
-
-
-
-
-
-
-
-
-
-
-
-
-
-
-
-
-
-
-
-
-
320 West 83rd Street
N/A
Avg. Price
Past 12 months
Past 12 months
-
-
-
-
-
-
-
-
-
-
-
-
-
-
-
-
-
-
-
-
-
320 West 83rd Street
N/A
Median Price
Past 12 months
Past 12 months
-
-
-
-
-
-
-
-
-
-
-
-
-
-
-
-
-
-
-
-
-
320 West 83rd Street
N/A
Avg. Price / ft2
Past 12 months
Past 12 months
-
-
-
-
-
-
-
-
-
-
-
-
-
-
-
-
-
-
-
-
-
320 West 83rd Street
N/A
Avg. Price
Past 12 months
Past 12 months
-
-
-
-
-
-
-
-
-
-
-
-
-
-
-
-
-
-
-
-
-
320 West 83rd Street
N/A
Median Price
Past 12 months
Past 12 months
-
-
-
-
-
-
-
-
-
-
-
-
-
-
-
-
-
-
-
-
-
353 Riverside Drive
N/A
Avg. Price / ft2
Past 12 months
Past 12 months
-
-
-
-
-
$1,056
-
-
-
-
-
-
$719
-
-
-
-
-
-
$725
-
353 Riverside Drive
N/A
Avg. Price
Past 12 months
Past 12 months
-
-
-
-
-
$840,000
-
-
-
$685,000
$1,480,000
-
$602,500
-
-
-
-
$1,230,000
-
$665,000
-
353 Riverside Drive
N/A
Median Price
Past 12 months
Past 12 months
-
-
-
-
-
$840,000
-
-
-
$685,000
$1,480,000
-
$602,500
-
-
-
-
$1,230,000
-
$665,000
-
353 Riverside Drive
N/A
Avg. Price / ft2
Past 12 months
Past 12 months
-
-
-
-
-
-
-
-
-
-
-
-
-
-
-
-
-
-
-
-
-
353 Riverside Drive
N/A
Avg. Price
Past 12 months
Past 12 months
-
-
-
-
-
-
-
-
-
-
-
-
-
-
-
-
-
-
-
-
-
353 Riverside Drive
N/A
Median Price
Past 12 months
Past 12 months
-
-
-
-
-
-
-
-
-
-
-
-
-
-
-
-
-
-
-
-
-
353 Riverside Drive
N/A
Avg. Price / ft2
Past 12 months
Past 12 months
-
-
-
-
-
$1,056
-
-
-
-
-
-
$719
-
-
-
-
-
-
$725
-
353 Riverside Drive
N/A
Avg. Price
Past 12 months
Past 12 months
-
-
-
-
-
$840,000
-
-
-
$685,000
-
-
$602,500
-
-
-
-
-
-
$580,000
-
353 Riverside Drive
N/A
Median Price
Past 12 months
Past 12 months
-
-
-
-
-
$840,000
-
-
-
$685,000
-
-
$602,500
-
-
-
-
-
-
$580,000
-
353 Riverside Drive
N/A
Avg. Price / ft2
Past 12 months
Past 12 months
-
-
-
-
-
-
-
-
-
-
-
-
-
-
-
-
-
-
-
-
-
353 Riverside Drive
N/A
Avg. Price
Past 12 months
Past 12 months
-
-
-
-
-
-
-
-
-
-
$1,480,000
-
-
-
-
-
-
$1,230,000
-
$750,000
-
353 Riverside Drive
N/A
Median Price
Past 12 months
Past 12 months
-
-
-
-
-
-
-
-
-
-
$1,480,000
-
-
-
-
-
-
$1,230,000
-
$750,000
-
353 Riverside Drive
N/A
Avg. Price / ft2
Past 12 months
Past 12 months
-
-
-
-
-
-
-
-
-
-
-
-
-
-
-
-
-
-
-
-
-
353 Riverside Drive
N/A
Avg. Price
Past 12 months
Past 12 months
-
-
-
-
-
-
-
-
-
-
-
-
-
-
-
-
-
-
-
-
-
353 Riverside Drive
N/A
Median Price
Past 12 months
Past 12 months
-
-
-
-
-
-
-
-
-
-
-
-
-
-
-
-
-
-
-
-
-
353 Riverside Drive
N/A
Avg. Price / ft2
Past 12 months
Past 12 months
-
-
-
-
-
-
-
-
-
-
-
-
-
-
-
-
-
-
-
-
-
353 Riverside Drive
N/A
Avg. Price
Past 12 months
Past 12 months
-
-
-
-
-
-
-
-
-
-
-
-
-
-
-
-
-
-
-
-
-
353 Riverside Drive
N/A
Median Price
Past 12 months
Past 12 months
-
-
-
-
-
-
-
-
-
-
-
-
-
-
-
-
-
-
-
-
-
The Broadmoor
N/A
Avg. Price / ft2
Past 12 months
Past 12 months
$900
$896
$949
$786
$955
$1,028
$1,365
$1,044
$920
$888
$721
$714
$674
$712
$703
$799
$745
$840
$746
$518
$378
The Broadmoor
$469,750
Avg. Price
Past 12 months
Past 12 months
$440,775
$443,352
$967,500
$393,398
$560,400
$533,132
$607,503
$587,925
$431,343
$458,481
$361,218
$382,367
$381,845
$474,569
$278,370
$350,844
$403,813
$415,026
$360,097
$220,469
$193,734
The Broadmoor
$382,500
Median Price
Past 12 months
Past 12 months
$374,626
$375,000
$727,500
$390,000
$367,000
$428,016
$453,141
$403,500
$351,000
$330,000
$279,000
$267,500
$329,000
$326,638
$260,000
$335,000
$432,500
$315,000
$290,000
$196,315
$179,500
The Broadmoor
N/A
Avg. Price / ft2
Past 12 months
Past 12 months
$900
$865
$778
$786
$844
$969
-
$1,134
$923
$758
$721
$619
$611
$661
$703
$798
$745
$700
$663
-
$378
The Broadmoor
$354,250
Avg. Price
Past 12 months
Past 12 months
$349,239
$362,493
$370,000
$393,398
$362,333
$440,793
$394,397
$362,143
$337,758
$296,125
$282,938
$309,646
$232,729
$301,092
$278,370
$322,652
$327,000
$287,083
$276,567
$194,611
$175,450
The Broadmoor
$365,000
Median Price
Past 12 months
Past 12 months
$360,000
$365,000
$370,000
$390,000
$365,000
$391,000
$389,000
$366,000
$332,500
$289,000
$274,500
$260,000
$244,420
$310,776
$260,000
$331,500
$327,000
$285,500
$276,750
$190,658
$172,000
The Broadmoor
N/A
Avg. Price / ft2
Past 12 months
Past 12 months
-
$989
-
-
$1,177
$1,146
-
$921
$919
$968
-
$761
$638
-
-
$800
$745
-
$870
$518
-
The Broadmoor
$700,750
Avg. Price
Past 12 months
Past 12 months
$616,667
$645,500
-
-
$765,000
$691,429
$695,667
$655,033
$578,301
$527,700
$417,500
$496,643
$480,153
-
-
$520,000
$429,417
$490,125
$506,193
$323,900
$340,000
The Broadmoor
$714,000
Median Price
Past 12 months
Past 12 months
$600,000
$645,500
-
-
$765,000
$680,000
$690,000
$670,000
$639,000
$565,000
$417,500
$494,500
$475,000
-
-
$520,000
$484,500
$497,500
$458,791
$323,900
$340,000
The Broadmoor
N/A
Avg. Price / ft2
Past 12 months
Past 12 months
-
-
$1,121
-
-
-
$1,365
$1,200
-
$1,456
-
-
$897
$865
-
-
-
$980
-
-
-
The Broadmoor
N/A
Avg. Price
Past 12 months
Past 12 months
$920,000
-
$1,065,000
-
$950,000
-
$1,221,128
$1,277,500
$900,000
$1,153,049
$874,900
-
$785,000
$995,000
-
-
-
$882,284
$795,000
-
-
The Broadmoor
N/A
Median Price
Past 12 months
Past 12 months
$920,000
-
$1,065,000
-
$950,000
-
$1,221,128
$1,277,500
$900,000
$1,153,049
$874,900
-
$785,000
$995,000
-
-
-
$882,284
$795,000
-
-
The Broadmoor
N/A
Avg. Price / ft2
Past 12 months
Past 12 months
-
-
-
-
-
-
-
-
-
-
-
-
-
-
-
-
-
-
-
-
-
The Broadmoor
N/A
Avg. Price
Past 12 months
Past 12 months
-
-
$2,065,000
-
-
-
-
-
-
-
-
-
-
-
-
-
-
-
-
-
-
The Broadmoor
N/A
Median Price
Past 12 months
Past 12 months
-
-
$2,065,000
-
-
-
-
-
-
-
-
-
-
-
-
-
-
-
-
-
-
The Broadmoor
N/A
Avg. Price / ft2
Past 12 months
Past 12 months
-
-
-
-
-
-
-
-
-
-
-
-
-
-
-
-
-
-
-
-
-
The Broadmoor
N/A
Avg. Price
Past 12 months
Past 12 months
-
-
-
-
-
-
-
-
-
-
-
-
-
-
-
-
-
-
-
-
-
The Broadmoor
N/A
Median Price
Past 12 months
Past 12 months
-
-
-
-
-
-
-
-
-
-
-
-
-
-
-
-
-
-
-
-
-
The Broadmoor
N/A
Avg. Price / ft2
Past 12 months
Past 12 months
-
-
-
-
-
-
-
-
-
-
-
-
-
-
-
-
-
-
-
-
-
The Broadmoor
N/A
Avg. Price
Past 12 months
Past 12 months
-
-
-
-
-
-
-
-
-
-
-
-
-
-
-
-
-
-
-
-
-
The Broadmoor
N/A
Median Price
Past 12 months
Past 12 months
-
-
-
-
-
-
-
-
-
-
-
-
-
-
-
-
-
-
-
-
-
315 West 106th Street
N/A
Avg. Price / ft2
Past 12 months
Past 12 months
-
-
-
-
-
-
-
-
-
-
-
-
-
-
$917
-
$807
$920
-
-
-
315 West 106th Street
N/A
Avg. Price
Past 12 months
Past 12 months
-
$2,900,000
-
-
-
$1,665,000
-
$1,525,000
$1,950,000
-
-
$2,465,000
$2,795,000
-
$1,337,500
-
$1,251,250
$920,000
$2,224,435
$193,905
$1,035,000
315 West 106th Street
N/A
Median Price
Past 12 months
Past 12 months
-
$2,900,000
-
-
-
$1,665,000
-
$1,525,000
$1,950,000
-
-
$2,465,000
$2,795,000
-
$1,460,000
-
$1,251,250
$920,000
$2,224,435
$193,905
$1,035,000
315 West 106th Street
N/A
Avg. Price / ft2
Past 12 months
Past 12 months
-
-
-
-
-
-
-
-
-
-
-
-
-
-
-
-
-
-
-
-
-
315 West 106th Street
N/A
Avg. Price
Past 12 months
Past 12 months
-
-
-
-
-
-
-
-
-
-
-
-
-
-
$305,000
-
-
-
-
$193,905
-
315 West 106th Street
N/A
Median Price
Past 12 months
Past 12 months
-
-
-
-
-
-
-
-
-
-
-
-
-
-
$305,000
-
-
-
-
$193,905
-
315 West 106th Street
N/A
Avg. Price / ft2
Past 12 months
Past 12 months
-
-
-
-
-
-
-
-
-
-
-
-
-
-
-
-
-
-
-
-
-
315 West 106th Street
N/A
Avg. Price
Past 12 months
Past 12 months
-
-
-
-
-
$580,000
-
-
-
-
-
-
-
-
-
-
-
-
-
-
-
315 West 106th Street
N/A
Median Price
Past 12 months
Past 12 months
-
-
-
-
-
$580,000
-
-
-
-
-
-
-
-
-
-
-
-
-
-
-
315 West 106th Street
N/A
Avg. Price / ft2
Past 12 months
Past 12 months
-
-
-
-
-
-
-
-
-
-
-
-
-
-
-
-
$807
$920
-
-
-
315 West 106th Street
N/A
Avg. Price
Past 12 months
Past 12 months
-
-
-
-
-
-
-
$1,525,000
$1,950,000
-
-
-
-
-
$1,270,000
-
$1,251,250
$920,000
-
-
$1,035,000
315 West 106th Street
N/A
Median Price
Past 12 months
Past 12 months
-
-
-
-
-
-
-
$1,525,000
$1,950,000
-
-
-
-
-
$1,270,000
-
$1,251,250
$920,000
-
-
$1,035,000
315 West 106th Street
N/A
Avg. Price / ft2
Past 12 months
Past 12 months
-
-
-
-
-
-
-
-
-
-
-
-
-
-
$917
-
-
-
-
-
-
315 West 106th Street
N/A
Avg. Price
Past 12 months
Past 12 months
-
$2,900,000
-
-
-
$2,750,000
-
-
-
-
-
$2,465,000
$2,795,000
-
$1,650,000
-
-
-
$2,224,435
-
-
315 West 106th Street
N/A
Median Price
Past 12 months
Past 12 months
-
$2,900,000
-
-
-
$2,750,000
-
-
-
-
-
$2,465,000
$2,795,000
-
$1,650,000
-
-
-
$2,224,435
-
-
315 West 106th Street
N/A
Avg. Price / ft2
Past 12 months
Past 12 months
-
-
-
-
-
-
-
-
-
-
-
-
-
-
-
-
-
-
-
-
-
315 West 106th Street
N/A
Avg. Price
Past 12 months
Past 12 months
-
-
-
-
-
-
-
-
-
-
-
-
-
-
$2,125,000
-
-
-
-
-
-
315 West 106th Street
N/A
Median Price
Past 12 months
Past 12 months
-
-
-
-
-
-
-
-
-
-
-
-
-
-
$2,125,000
-
-
-
-
-
-
315 West 106th Street
N/A
Avg. Price / ft2
Past 12 months
Past 12 months
-
-
-
-
-
-
-
-
-
-
-
-
-
-
-
-
-
-
-
-
-
315 West 106th Street
N/A
Avg. Price
Past 12 months
Past 12 months
-
-
-
-
-
-
-
-
-
-
-
-
-
-
-
-
-
-
-
-
-
315 West 106th Street
N/A
Median Price
Past 12 months
Past 12 months
-
-
-
-
-
-
-
-
-
-
-
-
-
-
-
-
-
-
-
-
-
309 West 104th Street
N/A
Avg. Price / ft2
Past 12 months
Past 12 months
-
-
-
$791
$960
$954
$1,008
-
$771
-
-
$780
-
$730
$590
-
-
-
$851
$628
-
309 West 104th Street
N/A
Avg. Price
Past 12 months
Past 12 months
-
$950,000
-
$935,000
$960,000
$1,745,000
$1,150,000
-
$1,335,000
-
$870,000
$1,290,000
-
$730,000
$590,000
-
-
$1,309,500
$878,000
$627,500
-
309 West 104th Street
N/A
Median Price
Past 12 months
Past 12 months
-
$950,000
-
$935,000
$960,000
$1,590,000
$1,150,000
-
$880,000
-
$870,000
$1,290,000
-
$730,000
$590,000
-
-
$1,309,500
$878,000
$627,500
-
309 West 104th Street
N/A
Avg. Price / ft2
Past 12 months
Past 12 months
-
-
-
-
-
-
-
-
-
-
-
-
-
-
-
-
-
-
-
-
-
309 West 104th Street
N/A
Avg. Price
Past 12 months
Past 12 months
-
-
-
-
-
-
-
-
-
-
-
-
-
-
-
-
-
-
-
-
-
309 West 104th Street
N/A
Median Price
Past 12 months
Past 12 months
-
-
-
-
-
-
-
-
-
-
-
-
-
-
-
-
-
-
-
-
-
309 West 104th Street
N/A
Avg. Price / ft2
Past 12 months
Past 12 months
-
-
-
-
-
-
-
-
-
-
-
-
-
-
-
-
-
-
-
-
-
309 West 104th Street
N/A
Avg. Price
Past 12 months
Past 12 months
-
-
-
-
-
-
-
-
-
-
-
-
-
-
-
-
-
-
$905,000
-
-
309 West 104th Street
N/A
Median Price
Past 12 months
Past 12 months
-
-
-
-
-
-
-
-
-
-
-
-
-
-
-
-
-
-
$905,000
-
-
309 West 104th Street
N/A
Avg. Price / ft2
Past 12 months
Past 12 months
-
-
-
$791
$960
$954
$1,008
-
$771
-
-
$780
-
$730
$590
-
-
-
$851
$628
-
309 West 104th Street
N/A
Avg. Price
Past 12 months
Past 12 months
-
$950,000
-
$935,000
$960,000
$1,517,500
$1,150,000
-
$877,500
-
$870,000
$780,000
-
$730,000
$590,000
-
-
-
$851,000
$627,500
-
309 West 104th Street
N/A
Median Price
Past 12 months
Past 12 months
-
$950,000
-
$935,000
$960,000
$1,517,500
$1,150,000
-
$877,500
-
$870,000
$780,000
-
$730,000
$590,000
-
-
-
$851,000
$627,500
-
309 West 104th Street
N/A
Avg. Price / ft2
Past 12 months
Past 12 months
-
-
-
-
-
-
-
-
-
-
-
-
-
-
-
-
-
-
-
-
-
309 West 104th Street
N/A
Avg. Price
Past 12 months
Past 12 months
-
-
-
-
-
$2,200,000
-
-
-
-
-
$1,800,000
-
-
-
-
-
$1,309,500
-
-
-
309 West 104th Street
N/A
Median Price
Past 12 months
Past 12 months
-
-
-
-
-
$2,200,000
-
-
-
-
-
$1,800,000
-
-
-
-
-
$1,309,500
-
-
-
309 West 104th Street
N/A
Avg. Price / ft2
Past 12 months
Past 12 months
-
-
-
-
-
-
-
-
-
-
-
-
-
-
-
-
-
-
-
-
-
309 West 104th Street
N/A
Avg. Price
Past 12 months
Past 12 months
-
-
-
-
-
-
-
-
$2,250,000
-
-
-
-
-
-
-
-
-
-
-
-
309 West 104th Street
N/A
Median Price
Past 12 months
Past 12 months
-
-
-
-
-
-
-
-
$2,250,000
-
-
-
-
-
-
-
-
-
-
-
-
309 West 104th Street
N/A
Avg. Price / ft2
Past 12 months
Past 12 months
-
-
-
-
-
-
-
-
-
-
-
-
-
-
-
-
-
-
-
-
-
309 West 104th Street
N/A
Avg. Price
Past 12 months
Past 12 months
-
-
-
-
-
-
-
-
-
-
-
-
-
-
-
-
-
-
-
-
-
309 West 104th Street
N/A
Median Price
Past 12 months
Past 12 months
-
-
-
-
-
-
-
-
-
-
-
-
-
-
-
-
-
-
-
-
-
The Gramont
N/A
Avg. Price / ft2
Past 12 months
Past 12 months
-
$641
$1,180
-
-
-
$1,307
$977
-
$1,191
$1,000
$967
-
-
$913
$920
$1,169
-
-
$747
$1,328
The Gramont
$1,495,000
Avg. Price
Past 12 months
Past 12 months
$1,495,000
$615,000
$1,710,000
-
-
$2,176,425
$2,537,503
$1,147,500
$2,732,500
$2,294,591
$1,450,000
$1,417,250
-
-
$1,775,000
$1,945,000
$1,765,833
$1,000,000
$1,262,000
$1,201,667
$1,295,000
The Gramont
$1,495,000
Median Price
Past 12 months
Past 12 months
$1,495,000
$615,000
$1,710,000
-
-
$2,176,425
$2,537,503
$1,147,500
$2,732,500
$2,365,000
$1,450,000
$1,668,500
-
-
$1,775,000
$1,945,000
$2,260,000
$1,200,000
$1,260,000
$1,410,000
$1,295,000
The Gramont
N/A
Avg. Price / ft2
Past 12 months
Past 12 months
-
-
-
-
-
-
-
-
-
-
-
-
-
-
-
-
-
-
-
-
-
The Gramont
N/A
Avg. Price
Past 12 months
Past 12 months
-
-
-
-
-
-
-
-
-
-
-
-
-
-
-
-
-
-
-
-
-
The Gramont
N/A
Median Price
Past 12 months
Past 12 months
-
-
-
-
-
-
-
-
-
-
-
-
-
-
-
-
-
-
-
-
-
The Gramont
N/A
Avg. Price / ft2
Past 12 months
Past 12 months
-
$641
-
-
-
-
-
$977
-
-
-
-
-
-
-
-
-
-
-
-
-
The Gramont
N/A
Avg. Price
Past 12 months
Past 12 months
-
$615,000
-
-
-
-
-
$645,000
-
-
-
-
-
-
-
-
-
-
-
-
-
The Gramont
N/A
Median Price
Past 12 months
Past 12 months
-
$615,000
-
-
-
-
-
$645,000
-
-
-
-
-
-
-
-
-
-
-
-
-
The Gramont
N/A
Avg. Price / ft2
Past 12 months
Past 12 months
-
-
$1,210
-
-
-
-
-
-
-
-
-
-
-
-
-
-
-
-
-
$1,328
The Gramont
N/A
Avg. Price
Past 12 months
Past 12 months
-
-
$1,120,000
-
-
-
-
-
-
$2,027,500
-
-
-
-
-
-
-
-
-
-
$1,295,000
The Gramont
N/A
Median Price
Past 12 months
Past 12 months
-
-
$1,120,000
-
-
-
-
-
-
$2,027,500
-
-
-
-
-
-
-
-
-
-
$1,295,000
The Gramont
N/A
Avg. Price / ft2
Past 12 months
Past 12 months
-
-
$1,150
-
-
-
-
-
-
$1,155
$1,000
$967
-
-
$913
$920
$1,169
-
-
$747
-
The Gramont
$1,495,000
Avg. Price
Past 12 months
Past 12 months
$1,495,000
-
$2,300,000
-
-
$2,176,425
$2,199,000
-
$2,490,000
$2,425,000
$1,450,000
$1,668,500
-
-
$2,100,000
$1,510,000
$2,486,250
-
-
$1,635,000
-
The Gramont
$1,495,000
Median Price
Past 12 months
Past 12 months
$1,495,000
-
$2,300,000
-
-
$2,176,425
$2,199,000
-
$2,490,000
$2,425,000
$1,450,000
$1,668,500
-
-
$2,100,000
$1,510,000
$2,486,250
-
-
$1,635,000
-
The Gramont
N/A
Avg. Price / ft2
Past 12 months
Past 12 months
-
-
-
-
-
-
$1,307
-
-
$1,227
-
-
-
-
-
-
-
-
-
-
-
The Gramont
N/A
Avg. Price
Past 12 months
Past 12 months
-
-
-
-
-
-
$2,876,006
-
-
$2,698,362
-
-
-
-
-
-
-
-
-
-
-
The Gramont
N/A
Median Price
Past 12 months
Past 12 months
-
-
-
-
-
-
$2,876,006
-
-
$2,698,362
-
-
-
-
-
-
-
-
-
-
-
The Gramont
N/A
Avg. Price / ft2
Past 12 months
Past 12 months
-
-
-
-
-
-
-
-
-
-
-
-
-
-
-
-
-
-
-
-
-
The Gramont
N/A
Avg. Price
Past 12 months
Past 12 months
-
-
-
-
-
-
-
-
-
-
-
-
-
-
-
-
-
-
-
-
-
The Gramont
N/A
Median Price
Past 12 months
Past 12 months
-
-
-
-
-
-
-
-
-
-
-
-
-
-
-
-
-
-
-
-
-
Fowler Court
N/A
Avg. Price / ft2
Past 12 months
Past 12 months
-
$870
$829
-
$781
$1,533
$993
$1,000
-
-
$780
$747
$714
$903
-
$803
$903
$957
$862
-
-
Fowler Court
$1,047,500
Avg. Price
Past 12 months
Past 12 months
$1,795,000
$1,150,000
$870,000
-
$637,000
$2,300,000
$662,500
$1,315,000
$2,506,250
$690,000
$780,000
$821,250
$895,000
$542,000
-
$684,500
$1,625,000
$1,435,000
$977,500
-
-
Fowler Court
$1,047,500
Median Price
Past 12 months
Past 12 months
$1,795,000
$1,150,000
$870,000
-
$637,000
$2,300,000
$662,500
$1,315,000
$2,506,250
$690,000
$780,000
$821,250
$700,000
$542,000
-
$689,000
$1,625,000
$1,435,000
$1,140,000
-
-
Fowler Court
N/A
Avg. Price / ft2
Past 12 months
Past 12 months
-
-
-
-
-
-
-
-
-
-
-
-
-
-
-
-
-
-
-
-
-
Fowler Court
N/A
Avg. Price
Past 12 months
Past 12 months
-
-
-
-
-
-
-
-
-
-
-
-
-
-
-
-
-
-
-
-
-
Fowler Court
N/A
Median Price
Past 12 months
Past 12 months
-
-
-
-
-
-
-
-
-
-
-
-
-
-
-
-
-
-
-
-
-
Fowler Court
N/A
Avg. Price / ft2
Past 12 months
Past 12 months
-
-
-
-
$766
-
$993
-
-
-
-
-
$759
$903
-
$876
-
-
-
-
-
Fowler Court
N/A
Avg. Price
Past 12 months
Past 12 months
-
-
-
-
$479,000
-
$662,500
-
-
$690,000
-
-
$550,000
$542,000
-
$635,000
-
-
-
-
-
Fowler Court
N/A
Median Price
Past 12 months
Past 12 months
-
-
-
-
$479,000
-
$662,500
-
-
$690,000
-
-
$550,000
$542,000
-
$635,000
-
-
-
-
-
Fowler Court
N/A
Avg. Price / ft2
Past 12 months
Past 12 months
-
-
$829
-
$795
$1,533
-
-
-
-
$780
$747
$538
-
-
$730
-
$957
$862
-
-
Fowler Court
N/A
Avg. Price
Past 12 months
Past 12 months
-
-
$870,000
-
$795,000
$2,300,000
-
$730,000
-
-
$780,000
$821,250
$700,000
-
-
$709,250
-
$1,435,000
$791,250
-
-
Fowler Court
N/A
Median Price
Past 12 months
Past 12 months
-
-
$870,000
-
$795,000
$2,300,000
-
$730,000
-
-
$780,000
$821,250
$700,000
-
-
$709,250
-
$1,435,000
$791,250
-
-
Fowler Court
N/A
Avg. Price / ft2
Past 12 months
Past 12 months
-
-
-
-
-
-
-
-
-
-
-
-
$844
-
-
-
$903
-
-
-
-
Fowler Court
$1,795,000
Avg. Price
Past 12 months
Past 12 months
$1,795,000
-
-
-
-
-
-
-
-
-
-
-
$1,435,000
-
-
-
$1,625,000
-
$1,350,000
-
-
Fowler Court
$1,795,000
Median Price
Past 12 months
Past 12 months
$1,795,000
-
-
-
-
-
-
-
-
-
-
-
$1,435,000
-
-
-
$1,625,000
-
$1,350,000
-
-
Fowler Court
N/A
Avg. Price / ft2
Past 12 months
Past 12 months
-
$870
-
-
-
-
-
$1,000
-
-
-
-
-
-
-
-
-
-
-
-
-
Fowler Court
N/A
Avg. Price
Past 12 months
Past 12 months
-
$1,150,000
-
-
-
-
-
$1,900,000
$2,506,250
-
-
-
-
-
-
-
-
-
-
-
-
Fowler Court
N/A
Median Price
Past 12 months
Past 12 months
-
$1,150,000
-
-
-
-
-
$1,900,000
$2,506,250
-
-
-
-
-
-
-
-
-
-
-
-
Fowler Court
N/A
Avg. Price / ft2
Past 12 months
Past 12 months
-
-
-
-
-
-
-
-
-
-
-
-
-
-
-
-
-
-
-
-
-
Fowler Court
N/A
Avg. Price
Past 12 months
Past 12 months
-
-
-
-
-
-
-
-
-
-
-
-
-
-
-
-
-
-
-
-
-
Fowler Court
N/A
Median Price
Past 12 months
Past 12 months
-
-
-
-
-
-
-
-
-
-
-
-
-
-
-
-
-
-
-
-
-
The Cliff Dwelling
N/A
Avg. Price / ft2
Past 12 months
Past 12 months
-
-
$949
-
-
-
-
-
-
-
-
-
-
$741
$907
-
-
-
$754
$567
-
The Cliff Dwelling
$1,191,400
Avg. Price
Past 12 months
Past 12 months
$765,000
-
$729,500
-
-
$570,000
-
$959,000
-
$766,438
$824,500
$599,000
$995,000
$444,444
$1,225,000
$692,500
$891,000
-
$679,000
$617,500
$445,000
The Cliff Dwelling
$1,324,200
Median Price
Past 12 months
Past 12 months
$765,000
-
$729,500
-
-
$570,000
-
$959,000
-
$590,000
$824,500
$599,000
$995,000
$444,444
$1,225,000
$692,500
$974,000
-
$679,000
$617,500
$445,000
The Cliff Dwelling
N/A
Avg. Price / ft2
Past 12 months
Past 12 months
-
-
-
-
-
-
-
-
-
-
-
-
-
-
-
-
-
-
-
-
-
The Cliff Dwelling
N/A
Avg. Price
Past 12 months
Past 12 months
-
-
-
-
-
-
-
-
-
-
-
-
-
-
-
-
-
-
-
-
-
The Cliff Dwelling
N/A
Median Price
Past 12 months
Past 12 months
-
-
-
-
-
-
-
-
-
-
-
-
-
-
-
-
-
-
-
-
-
The Cliff Dwelling
N/A
Avg. Price / ft2
Past 12 months
Past 12 months
-
-
$949
-
-
-
-
-
-
-
-
-
-
$741
-
-
-
-
$754
$567
-
The Cliff Dwelling
$600,000
Avg. Price
Past 12 months
Past 12 months
$600,000
-
$729,500
-
-
-
-
-
-
$590,000
$484,000
$599,000
-
$444,444
-
$415,000
$399,000
-
$679,000
$340,000
-
The Cliff Dwelling
$600,000
Median Price
Past 12 months
Past 12 months
$600,000
-
$729,500
-
-
-
-
-
-
$590,000
$484,000
$599,000
-
$444,444
-
$415,000
$399,000
-
$679,000
$340,000
-
The Cliff Dwelling
N/A
Avg. Price / ft2
Past 12 months
Past 12 months
-
-
-
-
-
-
-
-
-
-
-
-
-
-
$907
-
-
-
-
-
-
The Cliff Dwelling
N/A
Avg. Price
Past 12 months
Past 12 months
$930,000
-
-
-
-
-
-
$959,000
-
$1,365,000
$1,165,000
-
$995,000
-
$1,225,000
$970,000
$1,137,000
-
-
$895,000
$445,000
The Cliff Dwelling
N/A
Median Price
Past 12 months
Past 12 months
$930,000
-
-
-
-
-
-
$959,000
-
$1,365,000
$1,165,000
-
$995,000
-
$1,225,000
$970,000
$1,137,000
-
-
$895,000
$445,000
The Cliff Dwelling
N/A
Avg. Price / ft2
Past 12 months
Past 12 months
-
-
-
-
-
-
-
-
-
-
-
-
-
-
-
-
-
-
-
-
-
The Cliff Dwelling
N/A
Avg. Price
Past 12 months
Past 12 months
-
-
-
-
-
-
-
-
-
-
-
-
-
-
-
-
-
-
-
-
-
The Cliff Dwelling
N/A
Median Price
Past 12 months
Past 12 months
-
-
-
-
-
-
-
-
-
-
-
-
-
-
-
-
-
-
-
-
-
The Cliff Dwelling
N/A
Avg. Price / ft2
Past 12 months
Past 12 months
-
-
-
-
-
-
-
-
-
-
-
-
-
-
-
-
-
-
-
-
-
The Cliff Dwelling
N/A
Avg. Price
Past 12 months
Past 12 months
-
-
-
-
-
-
-
-
-
-
-
-
-
-
-
-
-
-
-
-
-
The Cliff Dwelling
N/A
Median Price
Past 12 months
Past 12 months
-
-
-
-
-
-
-
-
-
-
-
-
-
-
-
-
-
-
-
-
-
The Strathmore
N/A
Avg. Price / ft2
Past 12 months
Past 12 months
-
$1,417
-
-
-
-
$1,425
-
-
-
-
-
-
-
-
-
$700
-
-
$521
-
The Strathmore
N/A
Avg. Price
Past 12 months
Past 12 months
-
$1,700,000
-
-
-
-
$3,013,750
$2,200,000
$2,250,000
$1,627,500
-
$2,019,662
$1,630,000
-
-
$1,752,000
$3,143,333
$1,722,500
$2,202,500
$688,000
$525,000
The Strathmore
N/A
Median Price
Past 12 months
Past 12 months
-
$1,700,000
-
-
-
-
$2,685,000
$2,200,000
$2,250,000
$1,627,500
-
$2,019,662
$1,630,000
-
-
$1,752,000
$4,200,000
$1,722,500
$1,467,500
$730,000
$525,000
The Strathmore
N/A
Avg. Price / ft2
Past 12 months
Past 12 months
-
-
-
-
-
-
-
-
-
-
-
-
-
-
-
-
-
-
-
-
-
The Strathmore
N/A
Avg. Price
Past 12 months
Past 12 months
-
-
-
-
-
-
-
-
-
-
-
-
-
-
-
-
-
-
-
-
-
The Strathmore
N/A
Median Price
Past 12 months
Past 12 months
-
-
-
-
-
-
-
-
-
-
-
-
-
-
-
-
-
-
-
-
-
The Strathmore
N/A
Avg. Price / ft2
Past 12 months
Past 12 months
-
-
-
-
-
-
-
-
-
-
-
-
-
-
-
-
-
-
-
-
-
The Strathmore
N/A
Avg. Price
Past 12 months
Past 12 months
-
-
-
-
-
-
$1,720,000
-
-
-
-
$2,019,662
-
-
-
$1,379,000
-
-
$980,000
$585,000
$525,000
The Strathmore
N/A
Median Price
Past 12 months
Past 12 months
-
-
-
-
-
-
$1,720,000
-
-
-
-
$2,019,662
-
-
-
$1,379,000
-
-
$980,000
$585,000
$525,000
The Strathmore
N/A
Avg. Price / ft2
Past 12 months
Past 12 months
-
$1,417
-
-
-
-
-
-
-
-
-
-
-
-
-
-
$700
-
-
$521
-
The Strathmore
N/A
Avg. Price
Past 12 months
Past 12 months
-
$1,700,000
-
-
-
-
$1,485,000
$2,200,000
$2,250,000
$1,627,500
-
-
$1,630,000
-
-
-
$980,000
$1,795,000
-
$739,500
-
The Strathmore
N/A
Median Price
Past 12 months
Past 12 months
-
$1,700,000
-
-
-
-
$1,485,000
$2,200,000
$2,250,000
$1,627,500
-
-
$1,630,000
-
-
-
$980,000
$1,795,000
-
$739,500
-
The Strathmore
N/A
Avg. Price / ft2
Past 12 months
Past 12 months
-
-
-
-
-
-
-
-
-
-
-
-
-
-
-
-
-
-
-
-
-
The Strathmore
N/A
Avg. Price
Past 12 months
Past 12 months
-
-
-
-
-
-
$3,650,000
-
-
-
-
-
-
-
-
-
-
-
-
-
-
The Strathmore
N/A
Median Price
Past 12 months
Past 12 months
-
-
-
-
-
-
$3,650,000
-
-
-
-
-
-
-
-
-
-
-
-
-
-
The Strathmore
N/A
Avg. Price / ft2
Past 12 months
Past 12 months
-
-
-
-
-
-
$1,425
-
-
-
-
-
-
-
-
-
-
-
-
-
-
The Strathmore
N/A
Avg. Price
Past 12 months
Past 12 months
-
-
-
-
-
-
$5,200,000
-
-
-
-
-
-
-
-
-
$4,225,000
-
-
-
-
The Strathmore
N/A
Median Price
Past 12 months
Past 12 months
-
-
-
-
-
-
$5,200,000
-
-
-
-
-
-
-
-
-
$4,225,000
-
-
-
-
The Strathmore
N/A
Avg. Price / ft2
Past 12 months
Past 12 months
-
-
-
-
-
-
-
-
-
-
-
-
-
-
-
-
-
-
-
-
-
The Strathmore
N/A
Avg. Price
Past 12 months
Past 12 months
-
-
-
-
-
-
-
-
-
-
-
-
-
-
-
-
-
-
$4,950,000
-
-
The Strathmore
N/A
Median Price
Past 12 months
Past 12 months
-
-
-
-
-
-
-
-
-
-
-
-
-
-
-
-
-
-
$4,950,000
-
-
The Cornwall
N/A
Avg. Price / ft2
Past 12 months
Past 12 months
-
$1,687
-
-
$1,061
-
-
$1,000
-
$1,479
-
$1,470
$761
-
-
-
-
-
$1,250
-
$515
The Cornwall
$4,650,000
Avg. Price
Past 12 months
Past 12 months
-
$3,600,000
-
-
$875,000
$2,087,413
-
$1,562,500
$1,977,500
$2,898,000
$2,778,400
$2,185,000
$1,515,833
-
-
-
$2,941,667
$1,092,667
$2,562,550
-
$425,000
The Cornwall
$4,650,000
Median Price
Past 12 months
Past 12 months
-
$3,600,000
-
-
$875,000
$2,087,413
-
$1,562,500
$1,977,500
$2,898,000
$2,667,000
$2,185,000
$1,725,000
-
-
-
$3,200,000
$700,000
$2,562,550
-
$425,000
The Cornwall
N/A
Avg. Price / ft2
Past 12 months
Past 12 months
-
-
-
-
-
-
-
-
-
-
-
-
-
-
-
-
-
-
-
-
-
The Cornwall
N/A
Avg. Price
Past 12 months
Past 12 months
-
-
-
-
-
-
-
-
-
-
-
-
-
-
-
-
-
-
-
-
-
The Cornwall
N/A
Median Price
Past 12 months
Past 12 months
-
-
-
-
-
-
-
-
-
-
-
-
-
-
-
-
-
-
-
-
-
The Cornwall
N/A
Avg. Price / ft2
Past 12 months
Past 12 months
-
-
-
-
$1,061
-
-
$1,000
-
-
-
-
$761
-
-
-
-
-
-
-
$515
The Cornwall
N/A
Avg. Price
Past 12 months
Past 12 months
-
-
-
-
$875,000
-
-
$825,000
-
-
-
-
$627,500
-
-
-
-
-
-
-
$425,000
The Cornwall
N/A
Median Price
Past 12 months
Past 12 months
-
-
-
-
$875,000
-
-
$825,000
-
-
-
-
$627,500
-
-
-
-
-
-
-
$425,000
The Cornwall
N/A
Avg. Price / ft2
Past 12 months
Past 12 months
-
-
-
-
-
-
-
-
-
-
-
-
-
-
-
-
-
-
-
-
-
The Cornwall
N/A
Avg. Price
Past 12 months
Past 12 months
-
-
-
-
-
-
-
-
$780,000
-
-
$695,000
-
-
-
-
-
$664,000
-
-
-
The Cornwall
N/A
Median Price
Past 12 months
Past 12 months
-
-
-
-
-
-
-
-
$780,000
-
-
$695,000
-
-
-
-
-
$664,000
-
-
-
The Cornwall
N/A
Avg. Price / ft2
Past 12 months
Past 12 months
-
-
-
-
-
-
-
-
-
$1,552
-
-
-
-
-
-
-
-
-
-
-
The Cornwall
N/A
Avg. Price
Past 12 months
Past 12 months
-
-
-
-
-
-
-
$2,300,000
-
$2,796,000
$2,297,333
-
$1,960,000
-
-
-
$1,425,000
$1,950,000
$2,000,100
-
-
The Cornwall
N/A
Median Price
Past 12 months
Past 12 months
-
-
-
-
-
-
-
$2,300,000
-
$2,796,000
$2,250,000
-
$1,960,000
-
-
-
$1,425,000
$1,950,000
$2,000,100
-
-
The Cornwall
N/A
Avg. Price / ft2
Past 12 months
Past 12 months
-
$1,687
-
-
-
-
-
-
-
$1,406
-
$1,470
-
-
-
-
-
-
$1,250
-
-
The Cornwall
$4,650,000
Avg. Price
Past 12 months
Past 12 months
-
$3,600,000
-
-
-
$2,087,413
-
-
$3,175,000
$3,000,000
$3,500,000
$3,675,000
-
-
-
-
$3,700,000
-
$3,125,000
-
-
The Cornwall
$4,650,000
Median Price
Past 12 months
Past 12 months
-
$3,600,000
-
-
-
$2,087,413
-
-
$3,175,000
$3,000,000
$3,500,000
$3,675,000
-
-
-
-
$3,700,000
-
$3,125,000
-
-
The Cornwall
N/A
Avg. Price / ft2
Past 12 months
Past 12 months
-
-
-
-
-
-
-
-
-
-
-
-
-
-
-
-
-
-
-
-
-
The Cornwall
N/A
Avg. Price
Past 12 months
Past 12 months
-
-
-
-
-
-
-
-
-
-
-
-
-
-
-
-
-
-
-
-
-
The Cornwall
N/A
Median Price
Past 12 months
Past 12 months
-
-
-
-
-
-
-
-
-
-
-
-
-
-
-
-
-
-
-
-
-