451 Clinton Avenue: Price Comparison
between Greene Avenue & Gates Avenue View Full Building Profile
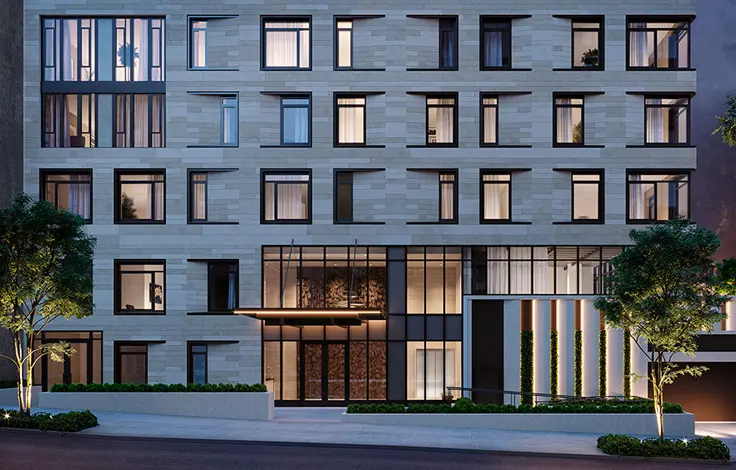
451 Clinton Avenue
$985,000
Avg. Price
Past 12 months
Past 12 months
2023
$800,000
2022
-
2021
$815,137
2020
-
2019
-
2018
$736,959
2017
-
2016
$641,838
2015
$535,500
2014
-
2013
$392,000
2012
-
2011
-
2010
-
2009
-
2008
$509,642
2007
$478,056
2006
$472,000
2005
$329,747
2004
$200,000
2003
$220,000
451 Clinton Avenue
$985,000
Median Price
Past 12 months
Past 12 months
2023
$800,000
2022
-
2021
$815,137
2020
-
2019
-
2018
$736,959
2017
-
2016
$480,000
2015
$535,500
2014
-
2013
$392,000
2012
-
2011
-
2010
-
2009
-
2008
$474,926
2007
$465,000
2006
$472,000
2005
$350,000
2004
$200,000
2003
$220,000
451 Clinton Avenue
N/A
Avg. Price
Past 12 months
Past 12 months
2023
-
2022
-
2021
-
2020
-
2019
-
2018
-
2017
-
2016
$370,513
2015
-
2014
-
2013
-
2012
-
2011
-
2010
-
2009
-
2008
-
2007
$334,167
2006
-
2005
$239,241
2004
$200,000
2003
-
451 Clinton Avenue
N/A
Median Price
Past 12 months
Past 12 months
2023
-
2022
-
2021
-
2020
-
2019
-
2018
-
2017
-
2016
$370,513
2015
-
2014
-
2013
-
2012
-
2011
-
2010
-
2009
-
2008
-
2007
$334,167
2006
-
2005
$239,241
2004
$200,000
2003
-
451 Clinton Avenue
$800,000
Avg. Price
Past 12 months
Past 12 months
2023
$800,000
2022
-
2021
$655,000
2020
-
2019
-
2018
$592,793
2017
-
2016
$480,000
2015
$535,500
2014
-
2013
$392,000
2012
-
2011
-
2010
-
2009
-
2008
$399,000
2007
$465,000
2006
$315,000
2005
$400,000
2004
-
2003
$220,000
451 Clinton Avenue
$800,000
Median Price
Past 12 months
Past 12 months
2023
$800,000
2022
-
2021
$655,000
2020
-
2019
-
2018
$592,793
2017
-
2016
$480,000
2015
$535,500
2014
-
2013
$392,000
2012
-
2011
-
2010
-
2009
-
2008
$399,000
2007
$465,000
2006
$315,000
2005
$400,000
2004
-
2003
$220,000
451 Clinton Avenue
$1,170,000
Avg. Price
Past 12 months
Past 12 months
2023
-
2022
-
2021
$975,273
2020
-
2019
-
2018
$881,124
2017
-
2016
$1,075,000
2015
-
2014
-
2013
-
2012
-
2011
-
2010
-
2009
-
2008
$655,000
2007
$635,000
2006
$629,000
2005
-
2004
-
2003
-
451 Clinton Avenue
$1,170,000
Median Price
Past 12 months
Past 12 months
2023
-
2022
-
2021
$975,273
2020
-
2019
-
2018
$881,124
2017
-
2016
$1,075,000
2015
-
2014
-
2013
-
2012
-
2011
-
2010
-
2009
-
2008
$655,000
2007
$635,000
2006
$629,000
2005
-
2004
-
2003
-
451 Clinton Avenue
N/A
Avg. Price
Past 12 months
Past 12 months
2023
-
2022
-
2021
-
2020
-
2019
-
2018
-
2017
-
2016
-
2015
-
2014
-
2013
-
2012
-
2011
-
2010
-
2009
-
2008
-
2007
-
2006
-
2005
-
2004
-
2003
-
451 Clinton Avenue
N/A
Median Price
Past 12 months
Past 12 months
2023
-
2022
-
2021
-
2020
-
2019
-
2018
-
2017
-
2016
-
2015
-
2014
-
2013
-
2012
-
2011
-
2010
-
2009
-
2008
-
2007
-
2006
-
2005
-
2004
-
2003
-
451 Clinton Avenue
N/A
Avg. Price
Past 12 months
Past 12 months
2023
-
2022
-
2021
-
2020
-
2019
-
2018
-
2017
-
2016
-
2015
-
2014
-
2013
-
2012
-
2011
-
2010
-
2009
-
2008
-
2007
-
2006
-
2005
-
2004
-
2003
-
451 Clinton Avenue
N/A
Median Price
Past 12 months
Past 12 months
2023
-
2022
-
2021
-
2020
-
2019
-
2018
-
2017
-
2016
-
2015
-
2014
-
2013
-
2012
-
2011
-
2010
-
2009
-
2008
-
2007
-
2006
-
2005
-
2004
-
2003
-
Clinton Hill Cooperatives
N/A
Avg. Price / ft2
Past 12 months
Past 12 months
-
-
-
$988
-
-
$833
-
-
-
-
-
$662
-
$692
-
-
$559
-
-
-
Clinton Hill Cooperatives
N/A
Avg. Price
Past 12 months
Past 12 months
-
-
-
$1,185,000
-
-
$999,000
-
-
-
-
-
$645,000
-
$830,126
-
-
$545,000
-
-
-
Clinton Hill Cooperatives
N/A
Median Price
Past 12 months
Past 12 months
-
-
-
$1,185,000
-
-
$999,000
-
-
-
-
-
$645,000
-
$830,126
-
-
$545,000
-
-
-
Clinton Hill Cooperatives
N/A
Avg. Price / ft2
Past 12 months
Past 12 months
-
-
-
-
-
-
-
-
-
-
-
-
-
-
-
-
-
-
-
-
-
Clinton Hill Cooperatives
N/A
Avg. Price
Past 12 months
Past 12 months
-
-
-
-
-
-
-
-
-
-
-
-
-
-
-
-
-
-
-
-
-
Clinton Hill Cooperatives
N/A
Median Price
Past 12 months
Past 12 months
-
-
-
-
-
-
-
-
-
-
-
-
-
-
-
-
-
-
-
-
-
Clinton Hill Cooperatives
N/A
Avg. Price / ft2
Past 12 months
Past 12 months
-
-
-
$988
-
-
$833
-
-
-
-
-
-
-
$692
-
-
-
-
-
-
Clinton Hill Cooperatives
N/A
Avg. Price
Past 12 months
Past 12 months
-
-
-
$1,185,000
-
-
$999,000
-
-
-
-
-
-
-
$830,126
-
-
-
-
-
-
Clinton Hill Cooperatives
N/A
Median Price
Past 12 months
Past 12 months
-
-
-
$1,185,000
-
-
$999,000
-
-
-
-
-
-
-
$830,126
-
-
-
-
-
-
Clinton Hill Cooperatives
N/A
Avg. Price / ft2
Past 12 months
Past 12 months
-
-
-
-
-
-
-
-
-
-
-
-
$662
-
-
-
-
$559
-
-
-
Clinton Hill Cooperatives
N/A
Avg. Price
Past 12 months
Past 12 months
-
-
-
-
-
-
-
-
-
-
-
-
$645,000
-
-
-
-
$545,000
-
-
-
Clinton Hill Cooperatives
N/A
Median Price
Past 12 months
Past 12 months
-
-
-
-
-
-
-
-
-
-
-
-
$645,000
-
-
-
-
$545,000
-
-
-
Clinton Hill Cooperatives
N/A
Avg. Price / ft2
Past 12 months
Past 12 months
-
-
-
-
-
-
-
-
-
-
-
-
-
-
-
-
-
-
-
-
-
Clinton Hill Cooperatives
N/A
Avg. Price
Past 12 months
Past 12 months
-
-
-
-
-
-
-
-
-
-
-
-
-
-
-
-
-
-
-
-
-
Clinton Hill Cooperatives
N/A
Median Price
Past 12 months
Past 12 months
-
-
-
-
-
-
-
-
-
-
-
-
-
-
-
-
-
-
-
-
-
Clinton Hill Cooperatives
N/A
Avg. Price / ft2
Past 12 months
Past 12 months
-
-
-
-
-
-
-
-
-
-
-
-
-
-
-
-
-
-
-
-
-
Clinton Hill Cooperatives
N/A
Avg. Price
Past 12 months
Past 12 months
-
-
-
-
-
-
-
-
-
-
-
-
-
-
-
-
-
-
-
-
-
Clinton Hill Cooperatives
N/A
Median Price
Past 12 months
Past 12 months
-
-
-
-
-
-
-
-
-
-
-
-
-
-
-
-
-
-
-
-
-
Copper House
N/A
Avg. Price / ft2
Past 12 months
Past 12 months
-
-
$1,040
-
-
-
-
$841
-
-
-
-
-
-
-
-
-
-
-
-
-
Copper House
N/A
Avg. Price
Past 12 months
Past 12 months
-
-
$1,725,000
-
-
-
-
$1,263,695
-
-
-
-
-
-
-
-
-
-
-
-
-
Copper House
N/A
Median Price
Past 12 months
Past 12 months
-
-
$1,725,000
-
-
-
-
$1,333,908
-
-
-
-
-
-
-
-
-
-
-
-
-
Copper House
N/A
Avg. Price / ft2
Past 12 months
Past 12 months
-
-
-
-
-
-
-
-
-
-
-
-
-
-
-
-
-
-
-
-
-
Copper House
N/A
Avg. Price
Past 12 months
Past 12 months
-
-
-
-
-
-
-
-
-
-
-
-
-
-
-
-
-
-
-
-
-
Copper House
N/A
Median Price
Past 12 months
Past 12 months
-
-
-
-
-
-
-
-
-
-
-
-
-
-
-
-
-
-
-
-
-
Copper House
N/A
Avg. Price / ft2
Past 12 months
Past 12 months
-
-
-
-
-
-
-
$819
-
-
-
-
-
-
-
-
-
-
-
-
-
Copper House
N/A
Avg. Price
Past 12 months
Past 12 months
-
-
-
-
-
-
-
$1,162,403
-
-
-
-
-
-
-
-
-
-
-
-
-
Copper House
N/A
Median Price
Past 12 months
Past 12 months
-
-
-
-
-
-
-
$1,153,169
-
-
-
-
-
-
-
-
-
-
-
-
-
Copper House
N/A
Avg. Price / ft2
Past 12 months
Past 12 months
-
-
$1,040
-
-
-
-
$884
-
-
-
-
-
-
-
-
-
-
-
-
-
Copper House
N/A
Avg. Price
Past 12 months
Past 12 months
-
-
$1,725,000
-
-
-
-
$1,466,281
-
-
-
-
-
-
-
-
-
-
-
-
-
Copper House
N/A
Median Price
Past 12 months
Past 12 months
-
-
$1,725,000
-
-
-
-
$1,466,281
-
-
-
-
-
-
-
-
-
-
-
-
-
Copper House
N/A
Avg. Price / ft2
Past 12 months
Past 12 months
-
-
-
-
-
-
-
-
-
-
-
-
-
-
-
-
-
-
-
-
-
Copper House
N/A
Avg. Price
Past 12 months
Past 12 months
-
-
-
-
-
-
-
-
-
-
-
-
-
-
-
-
-
-
-
-
-
Copper House
N/A
Median Price
Past 12 months
Past 12 months
-
-
-
-
-
-
-
-
-
-
-
-
-
-
-
-
-
-
-
-
-
Copper House
N/A
Avg. Price / ft2
Past 12 months
Past 12 months
-
-
-
-
-
-
-
-
-
-
-
-
-
-
-
-
-
-
-
-
-
Copper House
N/A
Avg. Price
Past 12 months
Past 12 months
-
-
-
-
-
-
-
-
-
-
-
-
-
-
-
-
-
-
-
-
-
Copper House
N/A
Median Price
Past 12 months
Past 12 months
-
-
-
-
-
-
-
-
-
-
-
-
-
-
-
-
-
-
-
-
-
Willoughby Walk
$893
Avg. Price / ft2
Past 12 months
Past 12 months
$893
-
$738
-
$808
-
$610
-
$608
$625
-
-
-
-
-
$406
$483
-
$357
$235
$258
Willoughby Walk
$610,000
Avg. Price
Past 12 months
Past 12 months
$810,000
-
$581,000
-
$485,000
-
$553,333
$509,857
$318,333
$436,333
-
-
-
-
$283,250
$507,500
$277,000
$311,250
$225,250
$196,657
$148,836
Willoughby Walk
$550,000
Median Price
Past 12 months
Past 12 months
$810,000
-
$564,000
-
$485,000
-
$495,000
$484,000
$260,000
$385,000
-
-
-
-
$272,500
$507,500
$262,500
$302,500
$240,000
$182,000
$154,000
Willoughby Walk
N/A
Avg. Price / ft2
Past 12 months
Past 12 months
-
-
$755
-
-
-
-
-
$628
-
-
-
-
-
-
-
-
-
-
$210
-
Willoughby Walk
$347,500
Avg. Price
Past 12 months
Past 12 months
-
-
$315,000
-
-
-
-
-
$257,500
$220,000
-
-
-
-
-
-
$213,333
-
$162,500
$85,000
$112,500
Willoughby Walk
$347,500
Median Price
Past 12 months
Past 12 months
-
-
$315,000
-
-
-
-
-
$257,500
$220,000
-
-
-
-
-
-
$210,000
-
$162,500
$85,000
$93,500
Willoughby Walk
$893
Avg. Price / ft2
Past 12 months
Past 12 months
$893
-
$709
-
$808
-
$629
-
$568
$622
-
-
-
-
-
-
$483
-
$357
$260
$258
Willoughby Walk
$680,000
Avg. Price
Past 12 months
Past 12 months
$810,000
-
$538,333
-
$485,000
-
$472,500
$477,800
$440,000
$387,833
-
-
-
-
$286,000
-
$262,333
$280,000
$241,625
$182,000
$137,333
Willoughby Walk
$680,000
Median Price
Past 12 months
Past 12 months
$810,000
-
$564,000
-
$485,000
-
$472,500
$475,000
$440,000
$382,500
-
-
-
-
$270,000
-
$290,000
$280,000
$252,500
$182,000
$154,000
Willoughby Walk
N/A
Avg. Price / ft2
Past 12 months
Past 12 months
-
-
$808
-
-
-
$572
-
-
-
-
-
-
-
-
$406
-
-
-
-
-
Willoughby Walk
$995,000
Avg. Price
Past 12 months
Past 12 months
-
-
$975,000
-
-
-
$715,000
$590,000
-
$515,000
-
-
-
-
-
$507,500
$385,000
$385,000
-
-
$200,000
Willoughby Walk
$995,000
Median Price
Past 12 months
Past 12 months
-
-
$975,000
-
-
-
$715,000
$590,000
-
$515,000
-
-
-
-
-
$507,500
$385,000
$385,000
-
-
$200,000
Willoughby Walk
N/A
Avg. Price / ft2
Past 12 months
Past 12 months
-
-
-
-
-
-
-
-
-
$632
-
-
-
-
-
-
-
-
-
-
-
Willoughby Walk
N/A
Avg. Price
Past 12 months
Past 12 months
-
-
-
-
-
-
-
-
-
$865,000
-
-
-
-
-
-
-
-
-
$400,000
-
Willoughby Walk
N/A
Median Price
Past 12 months
Past 12 months
-
-
-
-
-
-
-
-
-
$865,000
-
-
-
-
-
-
-
-
-
$400,000
-
Willoughby Walk
N/A
Avg. Price / ft2
Past 12 months
Past 12 months
-
-
-
-
-
-
-
-
-
-
-
-
-
-
-
-
-
-
-
-
-
Willoughby Walk
N/A
Avg. Price
Past 12 months
Past 12 months
-
-
-
-
-
-
-
-
-
-
-
-
-
-
-
-
-
-
-
-
-
Willoughby Walk
N/A
Median Price
Past 12 months
Past 12 months
-
-
-
-
-
-
-
-
-
-
-
-
-
-
-
-
-
-
-
-
-
Willoughby Walk
N/A
Avg. Price / ft2
Past 12 months
Past 12 months
-
-
-
-
-
-
-
-
-
-
-
-
-
-
-
-
-
-
-
-
-
Willoughby Walk
N/A
Avg. Price
Past 12 months
Past 12 months
-
-
-
-
-
-
-
-
-
-
-
-
-
-
-
-
-
-
-
-
-
Willoughby Walk
N/A
Median Price
Past 12 months
Past 12 months
-
-
-
-
-
-
-
-
-
-
-
-
-
-
-
-
-
-
-
-
-
Clinton Hill Coops
$924
Avg. Price / ft2
Past 12 months
Past 12 months
$932
$1,041
$874
-
$842
$889
$794
$705
$705
$563
-
-
-
-
-
$395
$451
$412
$349
$217
$207
Clinton Hill Coops
$822,000
Avg. Price
Past 12 months
Past 12 months
$875,500
$823,333
$699,000
-
$705,800
$764,667
$635,000
$529,271
$574,400
$488,455
-
-
-
-
$365,417
$312,800
$372,857
$347,296
$294,250
$201,320
$161,817
Clinton Hill Coops
$810,000
Median Price
Past 12 months
Past 12 months
$875,500
$860,000
$699,000
-
$660,000
$699,000
$635,000
$544,063
$550,000
$485,000
-
-
-
-
$335,000
$358,000
$365,000
$360,000
$297,500
$192,650
$166,450
Clinton Hill Coops
N/A
Avg. Price / ft2
Past 12 months
Past 12 months
-
-
-
-
-
-
-
-
-
-
-
-
-
-
-
-
-
-
-
-
-
Clinton Hill Coops
N/A
Avg. Price
Past 12 months
Past 12 months
-
-
-
-
-
-
-
-
-
$350,000
-
-
-
-
-
-
-
-
-
-
-
Clinton Hill Coops
N/A
Median Price
Past 12 months
Past 12 months
-
-
-
-
-
-
-
-
-
$350,000
-
-
-
-
-
-
-
-
-
-
-
Clinton Hill Coops
N/A
Avg. Price / ft2
Past 12 months
Past 12 months
-
$1,102
-
-
$849
$879
-
$705
$699
$587
-
-
-
-
-
$395
$394
$403
$379
$225
$207
Clinton Hill Coops
$780,000
Avg. Price
Past 12 months
Past 12 months
-
$867,500
-
-
$676,667
$692,000
-
$529,271
$575,000
$469,000
-
-
-
-
$321,250
$298,500
$371,000
$340,000
$307,333
$180,050
$166,250
Clinton Hill Coops
$780,000
Median Price
Past 12 months
Past 12 months
-
$867,500
-
-
$660,000
$692,000
-
$544,063
$575,000
$467,000
-
-
-
-
$321,250
$324,000
$355,000
$340,000
$300,000
$192,650
$168,000
Clinton Hill Coops
$924
Avg. Price / ft2
Past 12 months
Past 12 months
$932
$919
$874
-
$831
$910
$794
-
$709
$539
-
-
-
-
-
-
$507
$430
$334
$209
$207
Clinton Hill Coops
$906,000
Avg. Price
Past 12 months
Past 12 months
$875,500
$735,000
$699,000
-
$749,500
$910,000
$635,000
-
$574,000
$552,250
-
-
-
-
$405,000
$370,000
$380,000
$439,500
$297,500
$188,000
$165,900
Clinton Hill Coops
$906,000
Median Price
Past 12 months
Past 12 months
$875,500
$735,000
$699,000
-
$749,500
$910,000
$635,000
-
$550,000
$572,500
-
-
-
-
$415,000
$370,000
$380,000
$439,500
$297,500
$188,000
$165,900
Clinton Hill Coops
N/A
Avg. Price / ft2
Past 12 months
Past 12 months
-
-
-
-
-
-
-
-
-
-
-
-
-
-
-
-
-
-
-
-
-
Clinton Hill Coops
N/A
Avg. Price
Past 12 months
Past 12 months
-
-
-
-
-
-
-
-
-
-
-
-
-
-
-
-
-
-
-
-
-
Clinton Hill Coops
N/A
Median Price
Past 12 months
Past 12 months
-
-
-
-
-
-
-
-
-
-
-
-
-
-
-
-
-
-
-
-
-
Clinton Hill Coops
N/A
Avg. Price / ft2
Past 12 months
Past 12 months
-
-
-
-
-
-
-
-
-
-
-
-
-
-
-
-
-
-
-
-
-
Clinton Hill Coops
N/A
Avg. Price
Past 12 months
Past 12 months
-
-
-
-
-
-
-
-
-
-
-
-
-
-
-
-
-
-
-
-
-
Clinton Hill Coops
N/A
Median Price
Past 12 months
Past 12 months
-
-
-
-
-
-
-
-
-
-
-
-
-
-
-
-
-
-
-
-
-
Clinton Mews
$1,025
Avg. Price / ft2
Past 12 months
Past 12 months
$1,024
$910
$1,056
$960
$756
$845
$788
$807
$749
$864
$579
$509
$514
-
$372
$475
$504
$874
$461
$382
$308
Clinton Mews
$963,333
Avg. Price
Past 12 months
Past 12 months
$963,333
$914,883
$971,200
$752,500
$975,000
$742,750
$611,500
$789,167
$670,250
$832,500
$562,000
$480,000
$475,000
-
$404,586
$389,625
$507,232
$746,827
$410,496
$290,000
$299,000
Clinton Mews
$950,000
Median Price
Past 12 months
Past 12 months
$950,000
$885,000
$885,000
$752,500
$975,000
$730,000
$611,500
$815,000
$680,500
$832,500
$592,500
$515,000
$475,000
-
$404,586
$380,000
$503,900
$511,699
$399,000
$290,000
$299,000
Clinton Mews
N/A
Avg. Price / ft2
Past 12 months
Past 12 months
-
-
-
-
-
-
-
-
-
-
-
-
-
-
-
-
-
-
-
-
-
Clinton Mews
N/A
Avg. Price
Past 12 months
Past 12 months
-
-
-
-
-
-
-
-
-
-
-
-
-
-
-
-
-
-
-
-
-
Clinton Mews
N/A
Median Price
Past 12 months
Past 12 months
-
-
-
-
-
-
-
-
-
-
-
-
-
-
-
-
-
-
-
-
-
Clinton Mews
$1,023
Avg. Price / ft2
Past 12 months
Past 12 months
$1,023
$1,022
$1,126
$787
-
$845
$788
$813
$726
$905
$561
$523
$514
-
$372
$475
$444
$970
$507
$382
$308
Clinton Mews
$970,000
Avg. Price
Past 12 months
Past 12 months
$970,000
$930,000
$995,500
$655,000
-
$742,750
$611,500
$761,786
$611,000
$815,000
$446,000
$400,000
$475,000
-
$404,586
$389,625
$494,896
$838,946
$393,976
$290,000
$299,000
Clinton Mews
$970,000
Median Price
Past 12 months
Past 12 months
$970,000
$930,000
$890,000
$655,000
-
$730,000
$611,500
$745,000
$611,000
$815,000
$446,000
$400,000
$475,000
-
$404,586
$380,000
$515,000
$475,000
$399,000
$290,000
$299,000
Clinton Mews
$1,027
Avg. Price / ft2
Past 12 months
Past 12 months
$1,027
$686
$776
$1,133
$756
-
-
$786
$772
$824
$589
$502
-
-
-
-
$549
$540
$415
-
-
Clinton Mews
$950,000
Avg. Price
Past 12 months
Past 12 months
$950,000
$884,650
$874,000
$850,000
$975,000
-
-
$885,000
$729,500
$850,000
$620,000
$520,000
-
-
-
-
$549,542
$573,533
$431,147
-
-
Clinton Mews
$950,000
Median Price
Past 12 months
Past 12 months
$950,000
$884,650
$874,000
$850,000
$975,000
-
-
$885,000
$729,500
$850,000
$622,500
$520,000
-
-
-
-
$552,130
$541,689
$437,294
-
-
Clinton Mews
N/A
Avg. Price / ft2
Past 12 months
Past 12 months
-
-
-
-
-
-
-
-
-
-
-
-
-
-
-
-
-
-
-
-
-
Clinton Mews
N/A
Avg. Price
Past 12 months
Past 12 months
-
-
-
-
-
-
-
-
-
-
-
-
-
-
-
-
-
-
-
-
-
Clinton Mews
N/A
Median Price
Past 12 months
Past 12 months
-
-
-
-
-
-
-
-
-
-
-
-
-
-
-
-
-
-
-
-
-
Clinton Mews
N/A
Avg. Price / ft2
Past 12 months
Past 12 months
-
-
-
-
-
-
-
-
-
-
-
-
-
-
-
-
-
-
-
-
-
Clinton Mews
N/A
Avg. Price
Past 12 months
Past 12 months
-
-
-
-
-
-
-
-
-
-
-
-
-
-
-
-
-
-
-
-
-
Clinton Mews
N/A
Median Price
Past 12 months
Past 12 months
-
-
-
-
-
-
-
-
-
-
-
-
-
-
-
-
-
-
-
-
-

 6sqft delivers the latest on real estate, architecture, and design, straight from New York City.
