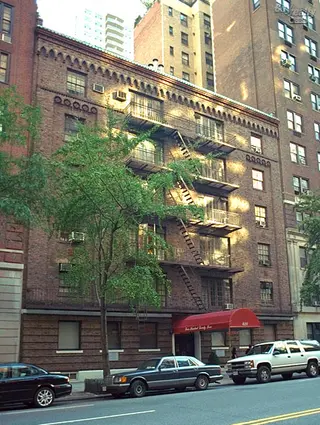
424 East 57th Street: Price Comparison
between First Avenue & Sutton Place Building Profile
424 East 57th Street
$665,000
Avg. Price
Past 12 months
Past 12 months
2024
-
2023
-
2022
-
2021
$1,075,000
2020
-
2019
$699,500
2018
$1,245,000
2017
$750,000
2016
$999,500
2015
$1,304,375
2014
$906,667
2013
$880,000
2012
$413,334
2011
$712,840
2010
-
2009
$1,123,000
2008
$585,000
2007
-
2006
$752,500
2005
$550,000
2004
$899,000
2003
$715,000
424 East 57th Street
$665,000
Median Price
Past 12 months
Past 12 months
2024
-
2023
-
2022
-
2021
$1,075,000
2020
-
2019
$699,500
2018
$1,245,000
2017
$750,000
2016
$999,500
2015
$1,322,500
2014
$1,200,000
2013
$880,000
2012
$441,669
2011
$689,864
2010
-
2009
$1,123,000
2008
$585,000
2007
-
2006
$752,500
2005
$550,000
2004
$899,000
2003
$715,000
424 East 57th Street
N/A
Avg. Price
Past 12 months
Past 12 months
2024
-
2023
-
2022
-
2021
-
2020
-
2019
$300,000
2018
-
2017
-
2016
-
2015
$322,500
2014
$300,000
2013
-
2012
$180,000
2011
-
2010
-
2009
-
2008
-
2007
-
2006
-
2005
-
2004
-
2003
-
424 East 57th Street
N/A
Median Price
Past 12 months
Past 12 months
2024
-
2023
-
2022
-
2021
-
2020
-
2019
$300,000
2018
-
2017
-
2016
-
2015
$322,500
2014
$300,000
2013
-
2012
$180,000
2011
-
2010
-
2009
-
2008
-
2007
-
2006
-
2005
-
2004
-
2003
-
424 East 57th Street
$665,000
Avg. Price
Past 12 months
Past 12 months
2024
-
2023
-
2022
-
2021
-
2020
-
2019
-
2018
-
2017
$750,000
2016
-
2015
-
2014
-
2013
-
2012
$456,650
2011
-
2010
-
2009
-
2008
$585,000
2007
-
2006
$580,000
2005
$550,000
2004
-
2003
-
424 East 57th Street
$665,000
Median Price
Past 12 months
Past 12 months
2024
-
2023
-
2022
-
2021
-
2020
-
2019
-
2018
-
2017
$750,000
2016
-
2015
-
2014
-
2013
-
2012
$456,650
2011
-
2010
-
2009
-
2008
$585,000
2007
-
2006
$580,000
2005
$550,000
2004
-
2003
-
424 East 57th Street
N/A
Avg. Price
Past 12 months
Past 12 months
2024
-
2023
-
2022
-
2021
$1,075,000
2020
-
2019
$1,099,000
2018
$890,000
2017
-
2016
$999,500
2015
$850,000
2014
$1,210,000
2013
$880,000
2012
$560,037
2011
$712,840
2010
-
2009
$940,000
2008
-
2007
-
2006
$925,000
2005
-
2004
$899,000
2003
$715,000
424 East 57th Street
N/A
Median Price
Past 12 months
Past 12 months
2024
-
2023
-
2022
-
2021
$1,075,000
2020
-
2019
$1,099,000
2018
$890,000
2017
-
2016
$999,500
2015
$850,000
2014
$1,210,000
2013
$880,000
2012
$560,037
2011
$689,864
2010
-
2009
$940,000
2008
-
2007
-
2006
$925,000
2005
-
2004
$899,000
2003
$715,000
424 East 57th Street
N/A
Avg. Price
Past 12 months
Past 12 months
2024
-
2023
-
2022
-
2021
-
2020
-
2019
-
2018
$1,600,000
2017
-
2016
-
2015
$2,022,500
2014
-
2013
-
2012
-
2011
-
2010
-
2009
$1,306,000
2008
-
2007
-
2006
-
2005
-
2004
-
2003
-
424 East 57th Street
N/A
Median Price
Past 12 months
Past 12 months
2024
-
2023
-
2022
-
2021
-
2020
-
2019
-
2018
$1,600,000
2017
-
2016
-
2015
$2,022,500
2014
-
2013
-
2012
-
2011
-
2010
-
2009
$1,306,000
2008
-
2007
-
2006
-
2005
-
2004
-
2003
-
424 East 57th Street
N/A
Avg. Price
Past 12 months
Past 12 months
2024
-
2023
-
2022
-
2021
-
2020
-
2019
-
2018
-
2017
-
2016
-
2015
-
2014
-
2013
-
2012
-
2011
-
2010
-
2009
-
2008
-
2007
-
2006
-
2005
-
2004
-
2003
-
424 East 57th Street
N/A
Median Price
Past 12 months
Past 12 months
2024
-
2023
-
2022
-
2021
-
2020
-
2019
-
2018
-
2017
-
2016
-
2015
-
2014
-
2013
-
2012
-
2011
-
2010
-
2009
-
2008
-
2007
-
2006
-
2005
-
2004
-
2003
-
424 East 57th Street
N/A
Avg. Price
Past 12 months
Past 12 months
2024
-
2023
-
2022
-
2021
-
2020
-
2019
-
2018
-
2017
-
2016
-
2015
-
2014
-
2013
-
2012
-
2011
-
2010
-
2009
-
2008
-
2007
-
2006
-
2005
-
2004
-
2003
-
424 East 57th Street
N/A
Median Price
Past 12 months
Past 12 months
2024
-
2023
-
2022
-
2021
-
2020
-
2019
-
2018
-
2017
-
2016
-
2015
-
2014
-
2013
-
2012
-
2011
-
2010
-
2009
-
2008
-
2007
-
2006
-
2005
-
2004
-
2003
-
440 East 57th Street
N/A
Avg. Price / ft2
Past 12 months
Past 12 months
-
$786
$860
$980
$867
$926
$905
$895
$1,014
$931
$859
$768
$722
$668
$678
-
$890
$775
-
$617
$511
$485
440 East 57th Street
$1,842,500
Avg. Price
Past 12 months
Past 12 months
-
$1,147,500
$1,014,750
$1,447,500
$1,300,000
$1,197,500
$690,558
$955,000
$1,777,729
$1,325,000
$1,101,250
$930,875
$943,000
$945,400
$909,667
-
$1,145,000
$892,506
$750,000
$775,000
$735,833
$554,375
440 East 57th Street
$1,842,500
Median Price
Past 12 months
Past 12 months
-
$1,147,500
$997,000
$1,447,500
$1,300,000
$1,197,500
$690,558
$835,000
$1,485,688
$1,325,000
$1,077,500
$880,750
$1,035,000
$740,000
$985,000
-
$1,185,000
$825,000
$750,000
$767,500
$718,750
$530,000
440 East 57th Street
N/A
Avg. Price / ft2
Past 12 months
Past 12 months
-
-
-
-
-
-
-
-
-
-
-
-
-
-
-
-
-
-
-
-
-
-
440 East 57th Street
N/A
Avg. Price
Past 12 months
Past 12 months
-
-
-
-
-
-
$431,116
-
-
-
-
-
-
-
-
-
-
-
-
-
-
-
440 East 57th Street
N/A
Median Price
Past 12 months
Past 12 months
-
-
-
-
-
-
$431,116
-
-
-
-
-
-
-
-
-
-
-
-
-
-
-
440 East 57th Street
N/A
Avg. Price / ft2
Past 12 months
Past 12 months
-
$786
$850
-
-
$955
$905
$791
-
-
$832
$745
$682
$637
$638
-
$905
$750
-
$657
$511
$469
440 East 57th Street
N/A
Avg. Price
Past 12 months
Past 12 months
-
$865,000
$928,000
-
-
$1,050,000
$950,000
$818,750
$960,000
-
$882,500
$731,000
$750,000
$720,667
$670,000
-
$995,000
$758,500
$750,000
$695,000
$570,833
$505,417
440 East 57th Street
N/A
Median Price
Past 12 months
Past 12 months
-
$865,000
$995,000
-
-
$1,050,000
$950,000
$827,500
$960,000
-
$882,500
$731,000
$750,000
$715,000
$670,000
-
$995,000
$758,500
$750,000
$695,000
$562,500
$510,000
440 East 57th Street
N/A
Avg. Price / ft2
Past 12 months
Past 12 months
-
-
$879
$980
$867
$897
-
$1,000
$1,014
$931
$886
$792
$762
$761
$698
-
$883
$800
-
$576
-
$500
440 East 57th Street
$1,435,000
Avg. Price
Past 12 months
Past 12 months
-
$1,430,000
$1,275,000
$1,447,500
$1,300,000
$1,345,000
-
$1,500,000
$1,648,792
$1,325,000
$1,320,000
$1,130,750
$1,071,667
$1,282,500
$1,029,500
-
$1,220,000
$1,160,518
-
$855,000
$900,833
$701,250
440 East 57th Street
$1,435,000
Median Price
Past 12 months
Past 12 months
-
$1,430,000
$1,275,000
$1,447,500
$1,300,000
$1,345,000
-
$1,500,000
$1,521,375
$1,325,000
$1,320,000
$1,130,750
$1,075,000
$1,282,500
$1,029,500
-
$1,220,000
$1,160,518
-
$855,000
$925,000
$701,250
440 East 57th Street
N/A
Avg. Price / ft2
Past 12 months
Past 12 months
-
-
-
-
-
-
-
-
-
-
-
-
-
-
-
-
-
-
-
-
-
-
440 East 57th Street
$2,250,000
Avg. Price
Past 12 months
Past 12 months
-
-
-
-
-
-
-
-
-
-
-
-
-
-
-
-
-
-
-
-
-
-
440 East 57th Street
$2,250,000
Median Price
Past 12 months
Past 12 months
-
-
-
-
-
-
-
-
-
-
-
-
-
-
-
-
-
-
-
-
-
-
440 East 57th Street
N/A
Avg. Price / ft2
Past 12 months
Past 12 months
-
-
-
-
-
-
-
-
-
-
-
-
-
-
-
-
-
-
-
-
-
-
440 East 57th Street
N/A
Avg. Price
Past 12 months
Past 12 months
-
-
-
-
-
-
-
-
$3,800,000
-
-
-
-
-
-
-
-
-
-
-
-
-
440 East 57th Street
N/A
Median Price
Past 12 months
Past 12 months
-
-
-
-
-
-
-
-
$3,800,000
-
-
-
-
-
-
-
-
-
-
-
-
-
440 East 57th Street
N/A
Avg. Price / ft2
Past 12 months
Past 12 months
-
-
-
-
-
-
-
-
-
-
-
-
-
-
-
-
-
-
-
-
-
-
440 East 57th Street
N/A
Avg. Price
Past 12 months
Past 12 months
-
-
-
-
-
-
-
-
-
-
-
-
-
-
-
-
-
-
-
-
-
-
440 East 57th Street
N/A
Median Price
Past 12 months
Past 12 months
-
-
-
-
-
-
-
-
-
-
-
-
-
-
-
-
-
-
-
-
-
-
435 East 57th Street
N/A
Avg. Price / ft2
Past 12 months
Past 12 months
$762
-
$1,020
-
$1,112
$821
-
-
-
$688
$705
$658
$758
$685
$1,014
-
-
-
-
$784
-
$402
435 East 57th Street
$975,000
Avg. Price
Past 12 months
Past 12 months
$750,000
$1,156,250
$1,453,833
-
$1,612,000
$948,774
$1,520,000
$1,325,000
$1,200,000
$1,156,750
$877,500
$837,500
$1,072,900
$953,750
$1,450,000
$970,000
$890,000
-
$1,470,000
$827,250
$1,187,000
$687,500
435 East 57th Street
$962,500
Median Price
Past 12 months
Past 12 months
$645,000
$1,160,000
$1,395,000
-
$1,612,000
$1,102,547
$1,520,000
$1,325,000
$1,200,000
$1,175,000
$877,500
$837,500
$994,500
$953,750
$1,450,000
$970,000
$890,000
-
$1,245,000
$824,500
$1,187,000
$745,000
435 East 57th Street
N/A
Avg. Price / ft2
Past 12 months
Past 12 months
-
-
-
-
-
-
-
-
-
-
-
-
-
-
-
-
-
-
-
-
-
-
435 East 57th Street
N/A
Avg. Price
Past 12 months
Past 12 months
-
-
-
-
-
-
-
-
-
-
-
-
-
-
-
-
-
-
-
-
-
-
435 East 57th Street
N/A
Median Price
Past 12 months
Past 12 months
-
-
-
-
-
-
-
-
-
-
-
-
-
-
-
-
-
-
-
-
-
-
435 East 57th Street
N/A
Avg. Price / ft2
Past 12 months
Past 12 months
-
-
-
-
-
-
-
-
-
-
-
-
-
-
-
-
-
-
-
-
-
-
435 East 57th Street
$550,000
Avg. Price
Past 12 months
Past 12 months
$565,000
$710,000
$459,000
-
-
$440,000
-
-
-
$682,000
-
-
$440,000
-
-
-
$890,000
-
$715,000
$525,000
-
$422,500
435 East 57th Street
$550,000
Median Price
Past 12 months
Past 12 months
$565,000
$710,000
$459,000
-
-
$440,000
-
-
-
$682,000
-
-
$440,000
-
-
-
$890,000
-
$715,000
$525,000
-
$422,500
435 East 57th Street
N/A
Avg. Price / ft2
Past 12 months
Past 12 months
-
-
$1,020
-
$1,112
$821
-
-
-
$688
$705
-
$710
$685
$1,014
-
-
-
-
$784
-
$402
435 East 57th Street
$1,075,000
Avg. Price
Past 12 months
Past 12 months
$645,000
$1,160,000
$1,951,250
-
$1,612,000
$1,118,365
$1,520,000
$1,325,000
$1,200,000
$1,210,000
$877,500
$425,000
$1,131,500
$953,750
$1,450,000
$970,000
-
-
$1,245,000
$1,129,500
$1,187,000
$753,750
435 East 57th Street
$1,075,000
Median Price
Past 12 months
Past 12 months
$645,000
$1,160,000
$1,951,250
-
$1,612,000
$1,150,000
$1,520,000
$1,325,000
$1,200,000
$1,210,000
$877,500
$425,000
$994,500
$953,750
$1,450,000
$970,000
-
-
$1,245,000
$1,129,500
$1,187,000
$767,500
435 East 57th Street
N/A
Avg. Price / ft2
Past 12 months
Past 12 months
$762
-
-
-
-
-
-
-
-
-
-
$658
-
-
-
-
-
-
-
-
-
-
435 East 57th Street
$1,200,000
Avg. Price
Past 12 months
Past 12 months
$1,040,000
$1,595,000
-
-
-
-
-
-
-
$1,525,000
-
$1,250,000
-
-
-
-
-
-
$2,450,000
-
-
-
435 East 57th Street
$1,200,000
Median Price
Past 12 months
Past 12 months
$1,040,000
$1,595,000
-
-
-
-
-
-
-
$1,525,000
-
$1,250,000
-
-
-
-
-
-
$2,450,000
-
-
-
435 East 57th Street
N/A
Avg. Price / ft2
Past 12 months
Past 12 months
-
-
-
-
-
-
-
-
-
-
-
-
$805
-
-
-
-
-
-
-
-
-
435 East 57th Street
N/A
Avg. Price
Past 12 months
Past 12 months
-
-
-
-
-
-
-
-
-
-
-
-
$1,530,000
-
-
-
-
-
-
-
-
-
435 East 57th Street
N/A
Median Price
Past 12 months
Past 12 months
-
-
-
-
-
-
-
-
-
-
-
-
$1,530,000
-
-
-
-
-
-
-
-
-
435 East 57th Street
N/A
Avg. Price / ft2
Past 12 months
Past 12 months
-
-
-
-
-
-
-
-
-
-
-
-
-
-
-
-
-
-
-
-
-
-
435 East 57th Street
N/A
Avg. Price
Past 12 months
Past 12 months
-
-
-
-
-
-
-
-
-
-
-
-
-
-
-
-
-
-
-
-
-
-
435 East 57th Street
N/A
Median Price
Past 12 months
Past 12 months
-
-
-
-
-
-
-
-
-
-
-
-
-
-
-
-
-
-
-
-
-
-
320 East 57th Street
N/A
Avg. Price / ft2
Past 12 months
Past 12 months
$816
$758
$867
$899
$887
$904
$920
-
$785
$916
$811
$632
$665
$693
$730
$747
$790
$777
$743
$635
$645
$462
320 East 57th Street
$655,000
Avg. Price
Past 12 months
Past 12 months
$652,500
$633,500
$858,333
$1,072,500
$1,106,833
$1,175,000
$915,900
-
$688,500
$919,833
$739,800
$690,929
$688,750
$627,500
$847,500
$635,000
$831,350
$808,000
$991,900
$557,720
$859,375
$547,143
320 East 57th Street
$655,000
Median Price
Past 12 months
Past 12 months
$652,500
$633,500
$630,000
$812,500
$1,100,000
$1,175,000
$725,000
-
$682,500
$884,500
$650,000
$515,000
$822,500
$627,500
$817,500
$635,000
$687,500
$645,000
$770,000
$568,790
$665,000
$590,000
320 East 57th Street
N/A
Avg. Price / ft2
Past 12 months
Past 12 months
-
-
-
-
-
-
-
-
-
-
-
-
-
-
-
-
-
-
-
-
-
-
320 East 57th Street
N/A
Avg. Price
Past 12 months
Past 12 months
-
-
-
-
-
-
-
-
-
-
-
-
-
-
-
-
-
-
-
-
-
-
320 East 57th Street
N/A
Median Price
Past 12 months
Past 12 months
-
-
-
-
-
-
-
-
-
-
-
-
-
-
-
-
-
-
-
-
-
-
320 East 57th Street
N/A
Avg. Price / ft2
Past 12 months
Past 12 months
$816
$758
$599
$697
-
-
$822
-
$785
$724
$762
$553
-
$693
$971
$747
$723
$749
$700
$683
$524
$463
320 East 57th Street
$655,000
Avg. Price
Past 12 months
Past 12 months
$652,500
$633,500
$550,000
$713,333
-
-
$660,833
-
$688,500
$531,667
$624,750
$473,750
$260,000
$627,500
$825,000
$635,000
$554,917
$636,667
$619,750
$518,627
$432,500
$357,500
320 East 57th Street
$655,000
Median Price
Past 12 months
Past 12 months
$652,500
$633,500
$550,000
$630,000
-
-
$632,500
-
$682,500
$575,000
$619,500
$502,500
$260,000
$627,500
$825,000
$635,000
$582,250
$640,000
$619,750
$478,580
$432,500
$357,500
320 East 57th Street
N/A
Avg. Price / ft2
Past 12 months
Past 12 months
-
-
$1,135
$1,303
$887
$904
$1,017
-
-
$1,043
$960
$749
$665
-
$649
-
$873
$820
$710
$540
$685
$462
320 East 57th Street
N/A
Avg. Price
Past 12 months
Past 12 months
-
-
$1,475,000
$2,150,000
$1,106,833
$1,175,000
$1,298,500
-
-
$1,308,000
$1,200,000
$980,500
$831,667
-
$855,000
-
$1,246,000
$1,065,000
$922,500
$675,000
$1,001,667
$623,000
320 East 57th Street
N/A
Median Price
Past 12 months
Past 12 months
-
-
$1,475,000
$2,150,000
$1,100,000
$1,175,000
$1,298,500
-
-
$1,200,000
$1,200,000
$987,500
$830,000
-
$810,000
-
$1,029,500
$1,065,000
$922,500
$675,000
$755,000
$625,000
320 East 57th Street
N/A
Avg. Price / ft2
Past 12 months
Past 12 months
-
-
-
-
-
-
-
-
-
-
-
-
-
-
-
-
-
-
-
-
-
-
320 East 57th Street
N/A
Avg. Price
Past 12 months
Past 12 months
-
-
-
-
-
-
-
-
-
-
-
-
-
-
-
-
-
-
-
-
-
-
320 East 57th Street
N/A
Median Price
Past 12 months
Past 12 months
-
-
-
-
-
-
-
-
-
-
-
-
-
-
-
-
-
-
-
-
-
-
320 East 57th Street
N/A
Avg. Price / ft2
Past 12 months
Past 12 months
-
-
-
-
-
-
-
-
-
-
-
-
-
-
-
-
-
-
$852
-
-
-
320 East 57th Street
N/A
Avg. Price
Past 12 months
Past 12 months
-
-
-
-
-
-
-
-
-
-
-
-
-
-
-
-
-
-
$1,875,000
-
-
-
320 East 57th Street
N/A
Median Price
Past 12 months
Past 12 months
-
-
-
-
-
-
-
-
-
-
-
-
-
-
-
-
-
-
$1,875,000
-
-
-
320 East 57th Street
N/A
Avg. Price / ft2
Past 12 months
Past 12 months
-
-
-
-
-
-
-
-
-
-
-
-
-
-
-
-
-
-
-
-
-
-
320 East 57th Street
N/A
Avg. Price
Past 12 months
Past 12 months
-
-
-
-
-
-
-
-
-
-
-
-
-
-
-
-
-
-
-
-
-
-
320 East 57th Street
N/A
Median Price
Past 12 months
Past 12 months
-
-
-
-
-
-
-
-
-
-
-
-
-
-
-
-
-
-
-
-
-
-
339 East 58th Street
$659
Avg. Price / ft2
Past 12 months
Past 12 months
-
$675
$663
$692
-
$1,054
-
$817
$914
-
$1,079
$727
$563
$622
$625
-
$848
$811
$608
$698
$530
$398
339 East 58th Street
$365,667
Avg. Price
Past 12 months
Past 12 months
$421,250
$340,000
$292,500
$288,750
-
$930,000
$655,000
$358,167
$405,000
$339,250
$850,000
$597,500
$459,331
$260,375
$250,000
-
$404,800
$342,786
$253,333
$306,808
$274,023
$165,000
339 East 58th Street
$308,000
Median Price
Past 12 months
Past 12 months
$392,500
$340,000
$292,500
$287,500
-
$930,000
$655,000
$367,500
$340,000
$339,250
$560,000
$280,000
$459,331
$265,750
$250,000
-
$339,000
$295,000
$250,000
$270,430
$220,000
$170,000
339 East 58th Street
$738
Avg. Price / ft2
Past 12 months
Past 12 months
-
$675
$663
$692
-
$838
-
$817
$914
-
-
$622
-
$622
$625
-
$848
$834
$608
$708
$530
$398
339 East 58th Street
$282,667
Avg. Price
Past 12 months
Past 12 months
$328,750
$270,000
$292,500
$288,750
-
$335,000
-
$358,167
$333,333
$339,250
$332,500
$272,500
-
$260,375
$250,000
-
$315,333
$291,583
$253,333
$267,955
$192,018
$165,000
339 East 58th Street
$289,000
Median Price
Past 12 months
Past 12 months
$328,750
$270,000
$292,500
$287,500
-
$335,000
-
$367,500
$330,000
$339,250
$332,500
$272,500
-
$265,750
$250,000
-
$326,000
$293,500
$250,000
$269,000
$194,000
$170,000
339 East 58th Street
$580
Avg. Price / ft2
Past 12 months
Past 12 months
-
-
-
-
-
-
-
-
-
-
$700
-
$563
-
-
-
-
$788
-
$645
-
-
339 East 58th Street
$460,000
Avg. Price
Past 12 months
Past 12 months
-
$410,000
-
-
-
-
$655,000
-
$620,000
-
$560,000
-
$459,331
-
-
-
$539,000
$650,000
-
$516,000
$253,068
-
339 East 58th Street
$460,000
Median Price
Past 12 months
Past 12 months
-
$410,000
-
-
-
-
$655,000
-
$620,000
-
$560,000
-
$459,331
-
-
-
$539,000
$650,000
-
$516,000
$253,068
-
339 East 58th Street
N/A
Avg. Price / ft2
Past 12 months
Past 12 months
-
-
-
-
-
$1,271
-
-
-
-
$1,458
-
-
-
-
-
-
-
-
-
-
-
339 East 58th Street
$675,000
Avg. Price
Past 12 months
Past 12 months
$606,250
-
-
-
-
$1,525,000
-
-
-
-
$1,512,500
-
-
-
-
-
-
-
-
-
$705,000
-
339 East 58th Street
$675,000
Median Price
Past 12 months
Past 12 months
$606,250
-
-
-
-
$1,525,000
-
-
-
-
$1,512,500
-
-
-
-
-
-
-
-
-
$705,000
-
339 East 58th Street
N/A
Avg. Price / ft2
Past 12 months
Past 12 months
-
-
-
-
-
-
-
-
-
-
-
$832
-
-
-
-
-
-
-
-
-
-
339 East 58th Street
N/A
Avg. Price
Past 12 months
Past 12 months
-
-
-
-
-
-
-
-
-
-
-
$1,247,500
-
-
-
-
-
-
-
$525,000
-
-
339 East 58th Street
N/A
Median Price
Past 12 months
Past 12 months
-
-
-
-
-
-
-
-
-
-
-
$1,247,500
-
-
-
-
-
-
-
$525,000
-
-
339 East 58th Street
N/A
Avg. Price / ft2
Past 12 months
Past 12 months
-
-
-
-
-
-
-
-
-
-
-
-
-
-
-
-
-
-
-
-
-
-
339 East 58th Street
N/A
Avg. Price
Past 12 months
Past 12 months
-
-
-
-
-
-
-
-
-
-
-
-
-
-
-
-
-
-
-
-
-
-
339 East 58th Street
N/A
Median Price
Past 12 months
Past 12 months
-
-
-
-
-
-
-
-
-
-
-
-
-
-
-
-
-
-
-
-
-
-
339 East 58th Street
N/A
Avg. Price / ft2
Past 12 months
Past 12 months
-
-
-
-
-
-
-
-
-
-
-
-
-
-
-
-
-
-
-
-
-
-
339 East 58th Street
N/A
Avg. Price
Past 12 months
Past 12 months
-
-
-
-
-
-
-
-
-
-
-
-
-
-
-
-
-
-
-
-
-
-
339 East 58th Street
N/A
Median Price
Past 12 months
Past 12 months
-
-
-
-
-
-
-
-
-
-
-
-
-
-
-
-
-
-
-
-
-
-
430 East 57th Street
$877
Avg. Price / ft2
Past 12 months
Past 12 months
-
$1,425
-
$790
-
$1,016
$867
-
-
$925
$971
$850
-
-
-
-
-
$895
-
-
-
$606
430 East 57th Street
$1,463,336
Avg. Price
Past 12 months
Past 12 months
$1,327,500
$1,666,667
$1,460,000
$1,335,000
-
$1,680,000
$1,040,000
$1,227,500
$1,900,000
$1,584,167
$1,658,333
$1,161,250
$1,287,500
$1,125,000
-
-
$1,450,000
$1,340,833
$1,650,000
$1,096,667
$855,625
$1,010,833
430 East 57th Street
$1,350,000
Median Price
Past 12 months
Past 12 months
$1,327,500
$1,400,000
$1,460,000
$1,335,000
-
$1,350,000
$1,040,000
$1,227,500
$1,900,000
$1,460,000
$1,750,000
$1,161,250
$1,287,500
$1,125,000
-
-
$1,450,000
$1,300,000
$1,650,000
$915,000
$833,750
$1,017,500
430 East 57th Street
N/A
Avg. Price / ft2
Past 12 months
Past 12 months
-
-
-
-
-
-
-
-
-
-
-
-
-
-
-
-
-
-
-
-
-
-
430 East 57th Street
N/A
Avg. Price
Past 12 months
Past 12 months
-
-
-
-
-
-
-
-
-
-
-
-
-
-
-
-
-
-
-
-
-
-
430 East 57th Street
N/A
Median Price
Past 12 months
Past 12 months
-
-
-
-
-
-
-
-
-
-
-
-
-
-
-
-
-
-
-
-
-
-
430 East 57th Street
N/A
Avg. Price / ft2
Past 12 months
Past 12 months
-
-
-
-
-
-
-
-
-
-
-
-
-
-
-
-
-
-
-
-
-
-
430 East 57th Street
N/A
Avg. Price
Past 12 months
Past 12 months
-
-
-
-
-
-
-
-
-
-
-
-
-
-
-
-
-
-
-
-
-
-
430 East 57th Street
N/A
Median Price
Past 12 months
Past 12 months
-
-
-
-
-
-
-
-
-
-
-
-
-
-
-
-
-
-
-
-
-
-
430 East 57th Street
$941
Avg. Price / ft2
Past 12 months
Past 12 months
-
-
-
$790
-
$675
$867
-
-
$925
$942
$850
-
-
-
-
-
$895
-
-
-
$606
430 East 57th Street
$1,295,000
Avg. Price
Past 12 months
Past 12 months
$1,327,500
$750,000
$1,460,000
$1,335,000
-
$1,162,500
$1,040,000
$1,227,500
$2,200,000
$1,569,000
$1,487,500
$1,161,250
$1,287,500
$1,125,000
-
-
$1,150,000
$1,123,750
$1,650,000
$1,096,667
$815,833
$1,010,833
430 East 57th Street
$1,350,000
Median Price
Past 12 months
Past 12 months
$1,327,500
$750,000
$1,460,000
$1,335,000
-
$1,162,500
$1,040,000
$1,227,500
$2,200,000
$1,260,000
$1,487,500
$1,161,250
$1,287,500
$1,125,000
-
-
$1,150,000
$1,123,750
$1,650,000
$915,000
$810,000
$1,017,500
430 East 57th Street
$788
Avg. Price / ft2
Past 12 months
Past 12 months
-
$1,425
-
-
-
$1,358
-
-
-
-
$1,000
-
-
-
-
-
-
-
-
-
-
-
430 East 57th Street
$1,715,840
Avg. Price
Past 12 months
Past 12 months
-
$2,125,000
-
-
-
$2,715,000
-
-
$1,600,000
$1,660,000
$2,000,000
-
-
-
-
-
-
$1,775,000
-
-
$975,000
-
430 East 57th Street
$1,715,840
Median Price
Past 12 months
Past 12 months
-
$2,125,000
-
-
-
$2,715,000
-
-
$1,600,000
$1,660,000
$2,000,000
-
-
-
-
-
-
$1,775,000
-
-
$975,000
-
430 East 57th Street
N/A
Avg. Price / ft2
Past 12 months
Past 12 months
-
-
-
-
-
-
-
-
-
-
-
-
-
-
-
-
-
-
-
-
-
-
430 East 57th Street
N/A
Avg. Price
Past 12 months
Past 12 months
-
-
-
-
-
-
-
-
-
-
-
-
-
-
-
-
$1,750,000
-
-
-
-
-
430 East 57th Street
N/A
Median Price
Past 12 months
Past 12 months
-
-
-
-
-
-
-
-
-
-
-
-
-
-
-
-
$1,750,000
-
-
-
-
-
430 East 57th Street
N/A
Avg. Price / ft2
Past 12 months
Past 12 months
-
-
-
-
-
-
-
-
-
-
-
-
-
-
-
-
-
-
-
-
-
-
430 East 57th Street
N/A
Avg. Price
Past 12 months
Past 12 months
-
-
-
-
-
-
-
-
-
-
-
-
-
-
-
-
-
-
-
-
-
-
430 East 57th Street
N/A
Median Price
Past 12 months
Past 12 months
-
-
-
-
-
-
-
-
-
-
-
-
-
-
-
-
-
-
-
-
-
-
455 East 57th Street
$727
Avg. Price / ft2
Past 12 months
Past 12 months
$539
$1,063
$892
$1,098
-
-
$938
-
-
-
-
-
-
-
-
-
$1,333
-
$563
-
-
-
455 East 57th Street
$1,684,375
Avg. Price
Past 12 months
Past 12 months
$700,047
$850,000
$1,420,500
$2,856,000
$599,000
-
$750,000
$1,160,000
$1,492,500
$720,000
-
$2,900,000
$850,000
$1,586,667
-
-
$1,988,750
-
$722,500
$1,995,000
-
-
455 East 57th Street
$1,750,000
Median Price
Past 12 months
Past 12 months
$700,047
$850,000
$1,420,500
$2,856,000
$599,000
-
$750,000
$1,160,000
$1,492,500
$720,000
-
$2,900,000
$850,000
$1,115,000
-
-
$1,940,000
-
$722,500
$1,995,000
-
-
455 East 57th Street
N/A
Avg. Price / ft2
Past 12 months
Past 12 months
-
-
-
-
-
-
-
-
-
-
-
-
-
-
-
-
-
-
-
-
-
-
455 East 57th Street
N/A
Avg. Price
Past 12 months
Past 12 months
-
-
-
-
-
-
-
-
-
-
-
-
-
-
-
-
-
-
-
-
-
-
455 East 57th Street
N/A
Median Price
Past 12 months
Past 12 months
-
-
-
-
-
-
-
-
-
-
-
-
-
-
-
-
-
-
-
-
-
-
455 East 57th Street
N/A
Avg. Price / ft2
Past 12 months
Past 12 months
-
$1,063
-
-
-
-
$938
-
-
-
-
-
-
-
-
-
-
-
$563
-
-
-
455 East 57th Street
N/A
Avg. Price
Past 12 months
Past 12 months
-
$850,000
$986,000
-
-
-
$750,000
-
-
-
-
-
-
-
-
-
-
-
$450,000
-
-
-
455 East 57th Street
N/A
Median Price
Past 12 months
Past 12 months
-
$850,000
$986,000
-
-
-
$750,000
-
-
-
-
-
-
-
-
-
-
-
$450,000
-
-
-
455 East 57th Street
N/A
Avg. Price / ft2
Past 12 months
Past 12 months
-
-
-
$1,098
-
-
-
-
-
-
-
-
-
-
-
-
-
-
-
-
-
-
455 East 57th Street
$1,425,000
Avg. Price
Past 12 months
Past 12 months
-
-
-
$2,856,000
$599,000
-
-
$1,160,000
$760,000
$720,000
-
-
$850,000
$955,000
-
-
$885,000
-
$995,000
-
-
-
455 East 57th Street
$1,425,000
Median Price
Past 12 months
Past 12 months
-
-
-
$2,856,000
$599,000
-
-
$1,160,000
$760,000
$720,000
-
-
$850,000
$955,000
-
-
$885,000
-
$995,000
-
-
-
455 East 57th Street
$727
Avg. Price / ft2
Past 12 months
Past 12 months
$539
-
$892
-
-
-
-
-
-
-
-
-
-
-
-
-
$1,333
-
-
-
-
-
455 East 57th Street
$1,600,000
Avg. Price
Past 12 months
Past 12 months
$700,047
-
$1,855,000
-
-
-
-
-
$2,225,000
-
-
$2,900,000
-
$2,850,000
-
-
$3,092,500
-
-
$1,995,000
-
-
455 East 57th Street
$1,600,000
Median Price
Past 12 months
Past 12 months
$700,047
-
$1,855,000
-
-
-
-
-
$2,225,000
-
-
$2,900,000
-
$2,850,000
-
-
$3,092,500
-
-
$1,995,000
-
-
455 East 57th Street
N/A
Avg. Price / ft2
Past 12 months
Past 12 months
-
-
-
-
-
-
-
-
-
-
-
-
-
-
-
-
-
-
-
-
-
-
455 East 57th Street
N/A
Avg. Price
Past 12 months
Past 12 months
-
-
-
-
-
-
-
-
-
-
-
-
-
-
-
-
-
-
-
-
-
-
455 East 57th Street
N/A
Median Price
Past 12 months
Past 12 months
-
-
-
-
-
-
-
-
-
-
-
-
-
-
-
-
-
-
-
-
-
-
455 East 57th Street
N/A
Avg. Price / ft2
Past 12 months
Past 12 months
-
-
-
-
-
-
-
-
-
-
-
-
-
-
-
-
-
-
-
-
-
-
455 East 57th Street
$2,287,500
Avg. Price
Past 12 months
Past 12 months
-
-
-
-
-
-
-
-
-
-
-
-
-
-
-
-
-
-
-
-
-
-
455 East 57th Street
$2,287,500
Median Price
Past 12 months
Past 12 months
-
-
-
-
-
-
-
-
-
-
-
-
-
-
-
-
-
-
-
-
-
-
Sutton Manor East
$813
Avg. Price / ft2
Past 12 months
Past 12 months
$792
$763
$592
$636
$847
$731
$674
-
-
$663
$862
$699
$575
-
$595
$572
-
$939
$658
-
$499
$418
Sutton Manor East
$1,950,000
Avg. Price
Past 12 months
Past 12 months
$892,300
$732,500
$400,000
$350,000
$890,000
$567,000
$802,500
$484,000
-
$784,167
$929,000
$824,000
$608,333
-
$595,000
$801,000
$1,392,500
$1,164,100
$695,000
$663,750
$515,500
$417,214
Sutton Manor East
$1,950,000
Median Price
Past 12 months
Past 12 months
$719,000
$732,500
$400,000
$350,000
$995,000
$567,000
$655,000
$435,500
-
$685,000
$1,100,000
$824,000
$515,000
-
$595,000
$801,000
$1,392,500
$1,200,000
$695,000
$663,750
$515,500
$425,000
Sutton Manor East
N/A
Avg. Price / ft2
Past 12 months
Past 12 months
-
$858
$592
$636
-
$664
-
-
-
$642
-
-
$575
-
-
-
-
-
$658
-
$327
$308
Sutton Manor East
N/A
Avg. Price
Past 12 months
Past 12 months
$405,000
$515,000
$400,000
$350,000
-
$415,000
$400,000
$407,000
-
$385,000
-
-
$345,000
-
-
-
-
$450,000
$395,000
-
$180,000
$183,500
Sutton Manor East
N/A
Median Price
Past 12 months
Past 12 months
$405,000
$515,000
$400,000
$350,000
-
$415,000
$400,000
$420,000
-
$385,000
-
-
$345,000
-
-
-
-
$450,000
$395,000
-
$180,000
$188,500
Sutton Manor East
N/A
Avg. Price / ft2
Past 12 months
Past 12 months
$799
-
-
-
$922
$799
$674
-
-
$685
$862
-
-
-
$595
-
-
$931
-
-
-
$529
Sutton Manor East
N/A
Avg. Price
Past 12 months
Past 12 months
$698,250
-
-
-
$837,500
$719,000
$655,000
$715,000
-
$685,000
$831,000
$669,000
$515,000
-
$595,000
-
-
$930,500
-
$663,750
-
$505,000
Sutton Manor East
N/A
Median Price
Past 12 months
Past 12 months
$698,250
-
-
-
$837,500
$719,000
$655,000
$715,000
-
$685,000
$831,000
$669,000
$515,000
-
$595,000
-
-
$930,500
-
$663,750
-
$505,000
Sutton Manor East
N/A
Avg. Price / ft2
Past 12 months
Past 12 months
$786
$667
-
-
$698
-
-
-
-
-
-
$699
-
-
-
$572
-
$947
-
-
$672
-
Sutton Manor East
N/A
Avg. Price
Past 12 months
Past 12 months
$1,330,000
$950,000
-
-
$995,000
-
$1,352,500
-
-
$1,282,500
$1,125,000
$979,000
$965,000
-
-
$801,000
$1,160,000
$1,200,000
$995,000
-
$851,000
$680,000
Sutton Manor East
N/A
Median Price
Past 12 months
Past 12 months
$1,330,000
$950,000
-
-
$995,000
-
$1,352,500
-
-
$1,282,500
$1,125,000
$979,000
$965,000
-
-
$801,000
$1,160,000
$1,200,000
$995,000
-
$851,000
$680,000
Sutton Manor East
$813
Avg. Price / ft2
Past 12 months
Past 12 months
-
-
-
-
-
-
-
-
-
-
-
-
-
-
-
-
-
-
-
-
-
-
Sutton Manor East
$1,950,000
Avg. Price
Past 12 months
Past 12 months
-
-
-
-
-
-
-
-
-
-
-
-
-
-
-
-
-
-
-
-
-
-
Sutton Manor East
$1,950,000
Median Price
Past 12 months
Past 12 months
-
-
-
-
-
-
-
-
-
-
-
-
-
-
-
-
-
-
-
-
-
-
Sutton Manor East
N/A
Avg. Price / ft2
Past 12 months
Past 12 months
-
-
-
-
-
-
-
-
-
-
-
-
-
-
-
-
-
-
-
-
-
-
Sutton Manor East
N/A
Avg. Price
Past 12 months
Past 12 months
-
-
-
-
-
-
-
-
-
-
-
-
-
-
-
-
$1,625,000
$2,040,000
-
-
-
-
Sutton Manor East
N/A
Median Price
Past 12 months
Past 12 months
-
-
-
-
-
-
-
-
-
-
-
-
-
-
-
-
$1,625,000
$2,040,000
-
-
-
-
Sutton Manor East
N/A
Avg. Price / ft2
Past 12 months
Past 12 months
-
-
-
-
-
-
-
-
-
-
-
-
-
-
-
-
-
-
-
-
-
-
Sutton Manor East
N/A
Avg. Price
Past 12 months
Past 12 months
-
-
-
-
-
-
-
-
-
-
-
-
-
-
-
-
-
-
-
-
-
-
Sutton Manor East
N/A
Median Price
Past 12 months
Past 12 months
-
-
-
-
-
-
-
-
-
-
-
-
-
-
-
-
-
-
-
-
-
-
Sutton Manor
$752
Avg. Price / ft2
Past 12 months
Past 12 months
$816
$646
$842
$782
$650
$1,042
$693
$763
-
$958
$700
$577
$712
$527
-
-
-
$640
$560
$429
-
$458
Sutton Manor
$663,750
Avg. Price
Past 12 months
Past 12 months
$548,000
$425,000
$1,123,333
$583,500
$330,000
$1,855,000
$725,000
$973,500
$577,500
$943,857
$667,200
$424,900
$1,010,833
$417,500
-
$870,000
$551,250
$632,167
$475,000
$523,200
$247,500
$605,000
Sutton Manor
$525,000
Median Price
Past 12 months
Past 12 months
$450,000
$425,000
$837,500
$587,000
$330,000
$1,855,000
$725,000
$717,000
$577,500
$415,000
$720,000
$340,000
$957,500
$417,500
-
$870,000
$551,250
$617,500
$475,000
$246,000
$247,500
$475,000
Sutton Manor
$621
Avg. Price / ft2
Past 12 months
Past 12 months
$816
$646
$708
$776
$650
-
-
$742
-
$671
$573
$524
$576
$527
-
-
-
-
$560
$429
-
-
Sutton Manor
$407,500
Avg. Price
Past 12 months
Past 12 months
$449,500
$425,000
$457,500
$432,000
$330,000
-
$500,000
$472,000
$430,000
$360,500
$383,000
$324,833
$325,000
$290,000
-
-
$435,000
-
$350,000
$241,500
$247,500
-
Sutton Manor
$407,500
Median Price
Past 12 months
Past 12 months
$449,500
$425,000
$457,500
$432,000
$330,000
-
$500,000
$472,000
$430,000
$351,000
$383,000
$319,500
$325,000
$290,000
-
-
$435,000
-
$350,000
$225,500
$247,500
-
Sutton Manor
$674
Avg. Price / ft2
Past 12 months
Past 12 months
-
-
$557
$795
-
-
-
$774
-
$767
$763
$684
-
-
-
-
-
$640
-
-
-
$445
Sutton Manor
$640,000
Avg. Price
Past 12 months
Past 12 months
$745,000
-
$515,000
$735,000
-
-
-
$717,000
$725,000
$690,000
$725,000
$575,000
-
$545,000
-
-
$667,500
$632,167
$600,000
-
-
$410,000
Sutton Manor
$640,000
Median Price
Past 12 months
Past 12 months
$745,000
-
$515,000
$735,000
-
-
-
$717,000
$725,000
$690,000
$725,000
$575,000
-
$545,000
-
-
$667,500
$617,500
$600,000
-
-
$410,000
Sutton Manor
$960
Avg. Price / ft2
Past 12 months
Past 12 months
-
-
$892
-
-
$728
$693
-
-
$1,000
-
-
-
-
-
-
-
-
-
-
-
-
Sutton Manor
$1,200,000
Avg. Price
Past 12 months
Past 12 months
-
-
$1,160,000
-
-
$910,000
$950,000
$1,118,000
-
$1,600,000
$1,120,000
-
$957,500
-
-
$870,000
-
-
-
$1,650,000
-
-
Sutton Manor
$1,200,000
Median Price
Past 12 months
Past 12 months
-
-
$1,160,000
-
-
$910,000
$950,000
$1,118,000
-
$1,600,000
$1,120,000
-
$957,500
-
-
$870,000
-
-
-
$1,650,000
-
-
Sutton Manor
N/A
Avg. Price / ft2
Past 12 months
Past 12 months
-
-
$1,211
-
-
$1,357
-
-
-
$1,393
-
-
$848
-
-
-
-
-
-
-
-
$482
Sutton Manor
N/A
Avg. Price
Past 12 months
Past 12 months
-
-
$2,075,000
-
-
$2,800,000
-
-
-
$2,875,000
-
-
$1,750,000
-
-
-
-
-
-
-
-
$995,000
Sutton Manor
N/A
Median Price
Past 12 months
Past 12 months
-
-
$2,075,000
-
-
$2,800,000
-
-
-
$2,875,000
-
-
$1,750,000
-
-
-
-
-
-
-
-
$995,000
Sutton Manor
N/A
Avg. Price / ft2
Past 12 months
Past 12 months
-
-
-
-
-
-
-
-
-
-
-
-
-
-
-
-
-
-
-
-
-
-
Sutton Manor
N/A
Avg. Price
Past 12 months
Past 12 months
-
-
-
-
-
-
-
$2,345,000
-
-
-
-
-
-
-
-
-
-
-
-
-
-
Sutton Manor
N/A
Median Price
Past 12 months
Past 12 months
-
-
-
-
-
-
-
$2,345,000
-
-
-
-
-
-
-
-
-
-
-
-
-
-
Sutton Manor
N/A
Avg. Price / ft2
Past 12 months
Past 12 months
-
-
-
-
-
-
-
-
-
-
-
-
-
-
-
-
-
-
-
-
-
-
Sutton Manor
N/A
Avg. Price
Past 12 months
Past 12 months
-
-
-
-
-
-
-
-
-
-
-
-
-
-
-
-
-
-
-
-
-
-
Sutton Manor
N/A
Median Price
Past 12 months
Past 12 months
-
-
-
-
-
-
-
-
-
-
-
-
-
-
-
-
-
-
-
-
-
-
Sutton Gardens
$783
Avg. Price / ft2
Past 12 months
Past 12 months
$727
$801
$743
$654
$734
$899
$805
$847
$774
$779
$704
$705
$527
$626
$606
-
$785
$705
$718
$726
$568
$468
Sutton Gardens
$836,846
Avg. Price
Past 12 months
Past 12 months
$645,835
$701,500
$627,224
$497,154
$793,299
$874,554
$732,196
$806,139
$630,809
$907,266
$726,460
$622,659
$629,700
$614,246
$423,500
$361,500
$700,056
$595,938
$607,859
$689,677
$465,267
$394,022
Sutton Gardens
$758,557
Median Price
Past 12 months
Past 12 months
$650,076
$725,000
$660,000
$485,000
$610,000
$874,554
$707,378
$680,000
$636,000
$866,798
$670,000
$633,500
$618,653
$599,000
$335,000
$361,500
$655,000
$630,000
$590,011
$627,000
$480,737
$406,144
Sutton Gardens
N/A
Avg. Price / ft2
Past 12 months
Past 12 months
-
$676
$650
$712
$796
-
-
$804
$716
$637
$781
$544
$563
-
$604
-
-
$663
$611
-
$502
$423
Sutton Gardens
N/A
Avg. Price
Past 12 months
Past 12 months
-
$366,500
$407,455
$380,000
$431,457
-
-
$441,100
$398,167
$345,000
$410,117
$299,000
$305,000
-
$330,000
-
-
$375,000
$336,000
$350,000
$338,314
$245,200
Sutton Gardens
N/A
Median Price
Past 12 months
Past 12 months
-
$366,500
$420,000
$380,000
$431,457
-
-
$445,000
$400,000
$345,000
$410,117
$299,000
$305,000
-
$330,000
-
-
$375,000
$336,000
$350,000
$293,750
$245,200
Sutton Gardens
$746
Avg. Price / ft2
Past 12 months
Past 12 months
$704
$851
$701
$634
$763
$899
$805
$868
$803
$779
$654
$709
$607
$627
$610
-
$756
$733
$724
$728
$588
$480
Sutton Gardens
$705,231
Avg. Price
Past 12 months
Past 12 months
$634,044
$758,400
$645,850
$536,205
$708,750
$874,554
$732,196
$806,698
$718,050
$784,532
$600,692
$640,548
$593,583
$534,031
$563,750
$558,000
$642,223
$664,000
$597,588
$626,693
$524,721
$409,415
Sutton Gardens
$645,000
Median Price
Past 12 months
Past 12 months
$650,076
$725,000
$665,050
$512,000
$708,750
$874,554
$707,378
$781,647
$650,932
$858,595
$665,000
$633,500
$593,583
$490,000
$563,750
$558,000
$640,000
$655,000
$586,096
$608,506
$516,620
$406,144
Sutton Gardens
N/A
Avg. Price / ft2
Past 12 months
Past 12 months
$772
$725
$893
-
$482
-
-
-
-
$923
$871
$846
-
$624
-
-
$843
-
$757
$721
$637
-
Sutton Gardens
$995,000
Avg. Price
Past 12 months
Past 12 months
$745,000
$752,500
$901,000
-
$467,539
-
-
$783,000
-
$895,000
$1,114,637
$821,094
$1,048,728
$895,000
-
-
$835,000
-
$784,875
$920,889
$585,963
-
Sutton Gardens
$995,000
Median Price
Past 12 months
Past 12 months
$745,000
$752,500
$901,000
-
$467,539
-
-
$783,000
-
$895,000
$1,114,637
$821,094
$1,048,728
$895,000
-
-
$835,000
-
$784,875
$886,057
$585,963
-
Sutton Gardens
$842
Avg. Price / ft2
Past 12 months
Past 12 months
-
-
-
-
$868
-
-
-
-
-
$808
-
$329
-
-
-
-
-
-
-
-
-
Sutton Gardens
$1,600,000
Avg. Price
Past 12 months
Past 12 months
-
-
-
-
$1,650,000
-
-
-
-
$1,850,000
$1,535,000
-
$625,000
-
-
-
-
-
-
-
-
-
Sutton Gardens
$1,600,000
Median Price
Past 12 months
Past 12 months
-
-
-
-
$1,650,000
-
-
-
-
$1,850,000
$1,535,000
-
$625,000
-
-
-
-
-
-
-
-
-
Sutton Gardens
N/A
Avg. Price / ft2
Past 12 months
Past 12 months
-
-
-
-
-
-
-
-
-
-
-
-
-
-
-
-
-
-
-
-
-
-
Sutton Gardens
N/A
Avg. Price
Past 12 months
Past 12 months
-
-
-
-
-
-
-
$2,650,000
-
-
-
-
-
-
-
-
-
-
-
-
-
-
Sutton Gardens
N/A
Median Price
Past 12 months
Past 12 months
-
-
-
-
-
-
-
$2,650,000
-
-
-
-
-
-
-
-
-
-
-
-
-
-
Sutton Gardens
N/A
Avg. Price / ft2
Past 12 months
Past 12 months
-
-
-
-
-
-
-
-
-
-
-
-
-
-
-
-
-
-
-
-
-
-
Sutton Gardens
N/A
Avg. Price
Past 12 months
Past 12 months
-
-
-
-
-
-
-
-
-
-
-
-
-
-
-
-
-
-
-
-
-
-
Sutton Gardens
N/A
Median Price
Past 12 months
Past 12 months
-
-
-
-
-
-
-
-
-
-
-
-
-
-
-
-
-
-
-
-
-
-


