164 West 79th Street: Price Comparison
between Columbus Avenue & Amsterdam Avenue Building Profile
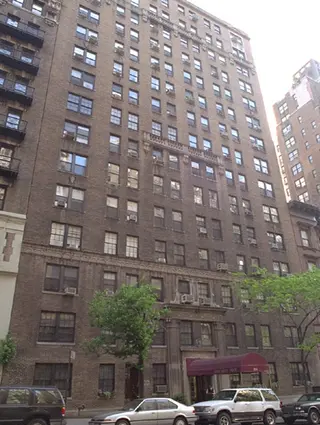
164 West 79th Street
$2,020,278
Avg. Price
Past 12 months
Past 12 months
2024
$1,217,500
2023
$1,912,500
2022
-
2021
$1,266,250
2020
$1,350,000
2019
$2,320,000
2018
$1,736,667
2017
$1,920,000
2016
$1,850,000
2015
-
2014
$1,247,250
2013
-
2012
$1,177,500
2011
$1,391,850
2010
$1,307,500
2009
$985,000
2008
$2,138,800
2007
$1,693,685
2006
$1,200,000
2005
$1,355,000
2004
$1,033,333
2003
$700,000
164 West 79th Street
$1,912,500
Median Price
Past 12 months
Past 12 months
2024
$1,217,500
2023
$1,912,500
2022
-
2021
$1,266,250
2020
$1,350,000
2019
$2,320,000
2018
$1,500,000
2017
$1,875,000
2016
$1,850,000
2015
-
2014
$1,214,500
2013
-
2012
$1,177,500
2011
$1,480,000
2010
$1,307,500
2009
$985,000
2008
$2,010,000
2007
$1,888,425
2006
$1,200,000
2005
$1,355,000
2004
$950,000
2003
$735,000
164 West 79th Street
N/A
Avg. Price
Past 12 months
Past 12 months
2024
-
2023
-
2022
-
2021
-
2020
-
2019
-
2018
-
2017
-
2016
-
2015
-
2014
-
2013
-
2012
-
2011
-
2010
-
2009
-
2008
-
2007
-
2006
-
2005
-
2004
-
2003
-
164 West 79th Street
N/A
Median Price
Past 12 months
Past 12 months
2024
-
2023
-
2022
-
2021
-
2020
-
2019
-
2018
-
2017
-
2016
-
2015
-
2014
-
2013
-
2012
-
2011
-
2010
-
2009
-
2008
-
2007
-
2006
-
2005
-
2004
-
2003
-
164 West 79th Street
N/A
Avg. Price
Past 12 months
Past 12 months
2024
-
2023
-
2022
-
2021
-
2020
-
2019
-
2018
-
2017
-
2016
-
2015
-
2014
-
2013
-
2012
-
2011
-
2010
-
2009
-
2008
-
2007
-
2006
-
2005
-
2004
-
2003
-
164 West 79th Street
N/A
Median Price
Past 12 months
Past 12 months
2024
-
2023
-
2022
-
2021
-
2020
-
2019
-
2018
-
2017
-
2016
-
2015
-
2014
-
2013
-
2012
-
2011
-
2010
-
2009
-
2008
-
2007
-
2006
-
2005
-
2004
-
2003
-
164 West 79th Street
$1,912,500
Avg. Price
Past 12 months
Past 12 months
2024
$1,217,500
2023
$1,912,500
2022
-
2021
$1,266,250
2020
$1,350,000
2019
$2,320,000
2018
$1,736,667
2017
$1,920,000
2016
$1,850,000
2015
-
2014
$1,029,667
2013
-
2012
$1,177,500
2011
$1,391,850
2010
$1,307,500
2009
$985,000
2008
$1,625,000
2007
$1,627,106
2006
$1,200,000
2005
-
2004
$1,033,333
2003
$700,000
164 West 79th Street
$1,912,500
Median Price
Past 12 months
Past 12 months
2024
$1,217,500
2023
$1,912,500
2022
-
2021
$1,266,250
2020
$1,350,000
2019
$2,320,000
2018
$1,500,000
2017
$1,875,000
2016
$1,850,000
2015
-
2014
$1,160,000
2013
-
2012
$1,177,500
2011
$1,480,000
2010
$1,307,500
2009
$985,000
2008
$1,625,000
2007
$1,681,713
2006
$1,200,000
2005
-
2004
$950,000
2003
$735,000
164 West 79th Street
$2,128,057
Avg. Price
Past 12 months
Past 12 months
2024
-
2023
-
2022
-
2021
-
2020
-
2019
-
2018
-
2017
-
2016
-
2015
-
2014
$1,900,000
2013
-
2012
-
2011
-
2010
-
2009
-
2008
$2,481,333
2007
-
2006
-
2005
$1,785,000
2004
-
2003
-
164 West 79th Street
$2,128,057
Median Price
Past 12 months
Past 12 months
2024
-
2023
-
2022
-
2021
-
2020
-
2019
-
2018
-
2017
-
2016
-
2015
-
2014
$1,900,000
2013
-
2012
-
2011
-
2010
-
2009
-
2008
$2,010,000
2007
-
2006
-
2005
$1,785,000
2004
-
2003
-
164 West 79th Street
N/A
Avg. Price
Past 12 months
Past 12 months
2024
-
2023
-
2022
-
2021
-
2020
-
2019
-
2018
-
2017
-
2016
-
2015
-
2014
-
2013
-
2012
-
2011
-
2010
-
2009
-
2008
-
2007
-
2006
-
2005
-
2004
-
2003
-
164 West 79th Street
N/A
Median Price
Past 12 months
Past 12 months
2024
-
2023
-
2022
-
2021
-
2020
-
2019
-
2018
-
2017
-
2016
-
2015
-
2014
-
2013
-
2012
-
2011
-
2010
-
2009
-
2008
-
2007
-
2006
-
2005
-
2004
-
2003
-
164 West 79th Street
N/A
Avg. Price
Past 12 months
Past 12 months
2024
-
2023
-
2022
-
2021
-
2020
-
2019
-
2018
-
2017
-
2016
-
2015
-
2014
-
2013
-
2012
-
2011
-
2010
-
2009
-
2008
-
2007
-
2006
-
2005
-
2004
-
2003
-
164 West 79th Street
N/A
Median Price
Past 12 months
Past 12 months
2024
-
2023
-
2022
-
2021
-
2020
-
2019
-
2018
-
2017
-
2016
-
2015
-
2014
-
2013
-
2012
-
2011
-
2010
-
2009
-
2008
-
2007
-
2006
-
2005
-
2004
-
2003
-
The Gloucester
$1,305
Avg. Price / ft2
Past 12 months
Past 12 months
$988
$1,087
$1,125
$918
$1,099
$1,097
$1,093
$1,212
$1,190
$1,106
$959
$920
$958
$864
$814
$785
$887
$961
$826
$787
$714
$564
The Gloucester
$997,786
Avg. Price
Past 12 months
Past 12 months
$1,058,000
$722,333
$908,111
$591,750
$807,000
$995,800
$991,429
$1,127,000
$1,162,429
$887,922
$1,048,692
$747,616
$860,508
$737,286
$657,000
$634,750
$666,208
$713,533
$693,875
$544,782
$506,743
$417,221
The Gloucester
$1,007,500
Median Price
Past 12 months
Past 12 months
$859,500
$699,500
$825,000
$571,000
$766,000
$715,000
$820,000
$992,500
$783,000
$749,000
$863,300
$587,000
$975,000
$570,000
$585,000
$615,000
$563,250
$604,500
$574,500
$515,500
$431,339
$386,019
The Gloucester
N/A
Avg. Price / ft2
Past 12 months
Past 12 months
$988
-
-
$872
-
-
-
-
-
$950
-
$821
$719
$938
-
-
$894
-
-
-
$613
-
The Gloucester
$425,000
Avg. Price
Past 12 months
Past 12 months
$420,000
-
$690,000
$392,250
-
$420,000
-
-
-
$427,500
-
$349,000
$341,718
$375,000
-
-
$407,500
$345,000
-
-
$258,243
$350,076
The Gloucester
$425,000
Median Price
Past 12 months
Past 12 months
$420,000
-
$690,000
$392,250
-
$420,000
-
-
-
$427,500
-
$349,000
$341,718
$375,000
-
-
$407,500
$345,000
-
-
$260,743
$350,076
The Gloucester
$1,165
Avg. Price / ft2
Past 12 months
Past 12 months
-
$1,087
$1,125
$1,010
$1,099
$1,097
$1,093
$1,039
$1,137
$1,083
$953
$893
$900
$834
$805
$788
$880
$925
$769
$801
$706
$549
The Gloucester
$797,800
Avg. Price
Past 12 months
Past 12 months
$776,000
$722,333
$837,167
$791,250
$766,250
$713,000
$728,750
$799,583
$761,750
$663,000
$668,583
$560,429
$549,233
$576,500
$546,800
$550,833
$565,786
$646,333
$546,786
$663,667
$459,875
$377,092
The Gloucester
$817,500
Median Price
Past 12 months
Past 12 months
$715,000
$699,500
$805,000
$791,250
$757,500
$715,000
$717,500
$737,000
$764,500
$660,000
$640,349
$552,500
$527,000
$560,500
$549,000
$550,000
$544,000
$632,000
$545,000
$540,000
$409,000
$374,339
The Gloucester
$1,480
Avg. Price / ft2
Past 12 months
Past 12 months
-
-
-
-
-
-
-
$1,325
$1,350
$1,309
$977
$1,061
$1,029
$880
$849
$782
$904
$1,009
$941
$761
$806
$608
The Gloucester
$1,159,167
Avg. Price
Past 12 months
Past 12 months
$1,646,667
-
$1,150,000
-
$970,000
$2,420,000
$1,341,667
$1,403,333
$1,205,000
$1,216,600
$884,299
$1,071,625
$1,158,813
$1,240,000
$730,000
$760,625
$949,000
$1,151,300
$980,000
$782,000
$748,587
$596,568
The Gloucester
$1,190,000
Median Price
Past 12 months
Past 12 months
$1,240,000
-
$1,150,000
-
$970,000
$2,420,000
$1,345,000
$1,355,000
$1,205,000
$1,308,800
$887,500
$1,037,500
$1,115,250
$1,240,000
$730,000
$755,000
$949,000
$1,050,000
$882,000
$782,000
$699,250
$620,766
The Gloucester
N/A
Avg. Price / ft2
Past 12 months
Past 12 months
-
-
-
-
-
-
-
$1,271
-
-
-
-
-
-
-
-
$910
-
-
-
-
-
The Gloucester
$1,300,000
Avg. Price
Past 12 months
Past 12 months
-
-
$1,310,000
-
-
-
-
$2,262,500
$2,680,000
-
$2,850,000
$999,500
-
-
-
-
$1,620,000
-
-
-
$820,000
-
The Gloucester
$1,300,000
Median Price
Past 12 months
Past 12 months
-
-
$1,310,000
-
-
-
-
$2,262,500
$2,680,000
-
$2,850,000
$999,500
-
-
-
-
$1,620,000
-
-
-
$820,000
-
The Gloucester
N/A
Avg. Price / ft2
Past 12 months
Past 12 months
-
-
-
-
-
-
-
-
-
-
-
-
-
-
-
-
-
-
-
-
-
-
The Gloucester
N/A
Avg. Price
Past 12 months
Past 12 months
-
-
-
-
-
-
-
-
-
-
-
-
-
-
-
-
-
-
-
-
-
-
The Gloucester
N/A
Median Price
Past 12 months
Past 12 months
-
-
-
-
-
-
-
-
-
-
-
-
-
-
-
-
-
-
-
-
-
-
The Gloucester
N/A
Avg. Price / ft2
Past 12 months
Past 12 months
-
-
-
-
-
-
-
-
-
-
-
-
-
-
-
-
-
-
-
-
-
-
The Gloucester
N/A
Avg. Price
Past 12 months
Past 12 months
-
-
-
-
-
-
-
-
-
-
-
-
-
-
-
-
-
-
-
-
-
-
The Gloucester
N/A
Median Price
Past 12 months
Past 12 months
-
-
-
-
-
-
-
-
-
-
-
-
-
-
-
-
-
-
-
-
-
-
The Endicott
$1,289
Avg. Price / ft2
Past 12 months
Past 12 months
-
$1,330
$1,369
$969
$1,130
$1,521
$1,101
$1,186
$1,190
$718
$1,194
$1,130
$954
$822
$692
$977
$1,068
$832
$1,136
$865
$701
$647
The Endicott
$1,231,304
Avg. Price
Past 12 months
Past 12 months
$855,000
$1,080,750
$890,000
$1,158,000
$1,300,000
$1,086,667
$1,231,000
$1,268,750
$860,000
$1,162,819
$1,639,934
$1,056,250
$928,500
$643,214
$415,000
$846,600
$901,400
$765,200
$940,625
$745,500
$734,375
$498,625
The Endicott
$1,200,000
Median Price
Past 12 months
Past 12 months
$855,000
$1,080,750
$890,000
$905,000
$1,300,000
$1,065,000
$1,250,000
$862,500
$880,000
$795,000
$1,016,000
$1,115,000
$1,149,000
$585,000
$415,000
$785,000
$797,000
$678,750
$937,500
$650,000
$667,500
$446,250
The Endicott
N/A
Avg. Price / ft2
Past 12 months
Past 12 months
-
-
-
-
-
-
-
-
-
-
-
-
-
$796
$692
-
-
-
-
-
-
-
The Endicott
N/A
Avg. Price
Past 12 months
Past 12 months
-
-
-
-
-
-
-
-
-
-
-
-
-
$475,000
$415,000
-
-
-
-
-
-
-
The Endicott
N/A
Median Price
Past 12 months
Past 12 months
-
-
-
-
-
-
-
-
-
-
-
-
-
$475,000
$415,000
-
-
-
-
-
-
-
The Endicott
$1,320
Avg. Price / ft2
Past 12 months
Past 12 months
-
-
$1,369
$969
-
$1,521
$1,101
$1,186
$1,190
-
-
$892
$819
$835
-
$832
-
$832
-
-
$675
$670
The Endicott
$874,375
Avg. Price
Past 12 months
Past 12 months
-
$699,000
$890,000
$760,000
-
$980,000
$752,500
$858,333
$860,000
$778,833
$747,708
$710,000
$487,500
$553,125
-
$526,500
$715,667
$695,400
$737,500
$455,000
$545,000
$434,167
The Endicott
$788,750
Median Price
Past 12 months
Past 12 months
-
$699,000
$890,000
$750,000
-
$980,000
$752,500
$860,000
$880,000
$792,500
$786,125
$710,000
$487,500
$562,500
-
$526,500
$680,000
$640,000
$737,500
$455,000
$545,000
$429,500
The Endicott
$1,245
Avg. Price / ft2
Past 12 months
Past 12 months
-
$1,330
-
-
$1,130
-
-
-
-
$718
$1,011
$1,248
$1,022
-
-
$1,123
$1,068
-
$1,136
$865
$727
$623
The Endicott
$1,707,208
Avg. Price
Past 12 months
Past 12 months
$1,125,000
$1,462,500
-
$1,260,000
$1,300,000
$1,300,000
$1,550,000
$2,500,000
-
$1,521,188
$1,150,336
$1,402,500
$1,149,000
$907,500
-
$1,060,000
$1,180,000
$835,000
$1,077,500
$995,000
$792,500
$692,000
The Endicott
$1,725,000
Median Price
Past 12 months
Past 12 months
$1,125,000
$1,462,500
-
$1,260,000
$1,300,000
$1,300,000
$1,700,000
$2,500,000
-
$1,521,188
$1,243,172
$1,402,500
$1,149,000
$907,500
-
$1,160,000
$1,180,000
$705,000
$1,147,500
$995,000
$792,500
$692,000
The Endicott
N/A
Avg. Price / ft2
Past 12 months
Past 12 months
-
-
-
-
-
-
-
-
-
-
-
-
-
-
-
-
-
-
-
-
-
-
The Endicott
N/A
Avg. Price
Past 12 months
Past 12 months
-
-
-
-
-
-
-
-
-
$2,750,000
-
-
-
-
-
-
-
-
-
-
-
-
The Endicott
N/A
Median Price
Past 12 months
Past 12 months
-
-
-
-
-
-
-
-
-
$2,750,000
-
-
-
-
-
-
-
-
-
-
-
-
The Endicott
N/A
Avg. Price / ft2
Past 12 months
Past 12 months
-
-
-
-
-
-
-
-
-
-
$1,743
-
-
-
-
-
-
-
-
-
-
-
The Endicott
N/A
Avg. Price
Past 12 months
Past 12 months
-
-
-
-
-
-
-
-
-
-
$6,275,000
-
-
-
-
-
-
-
-
-
-
-
The Endicott
N/A
Median Price
Past 12 months
Past 12 months
-
-
-
-
-
-
-
-
-
-
$6,275,000
-
-
-
-
-
-
-
-
-
-
-
The Endicott
N/A
Avg. Price / ft2
Past 12 months
Past 12 months
-
-
-
-
-
-
-
-
-
-
-
-
-
-
-
-
-
-
-
-
-
-
The Endicott
N/A
Avg. Price
Past 12 months
Past 12 months
-
-
-
-
-
-
-
-
-
-
-
-
-
-
-
-
-
-
-
-
-
-
The Endicott
N/A
Median Price
Past 12 months
Past 12 months
-
-
-
-
-
-
-
-
-
-
-
-
-
-
-
-
-
-
-
-
-
-
The Lyons
$1,247
Avg. Price / ft2
Past 12 months
Past 12 months
$1,032
$1,163
$1,245
-
$938
-
$869
$1,010
$1,026
$972
$1,053
-
$855
$883
$903
$845
$950
$909
$906
$887
$716
$672
The Lyons
$978,333
Avg. Price
Past 12 months
Past 12 months
$795,000
$1,033,802
$2,055,500
-
$750,000
-
$863,750
$974,500
$752,500
$752,000
$912,833
$1,165,000
$721,666
$831,248
$802,250
$818,583
$760,000
$870,612
$866,333
$724,657
$600,333
$569,250
The Lyons
$875,000
Median Price
Past 12 months
Past 12 months
$785,000
$930,000
$2,055,500
-
$750,000
-
$710,000
$762,500
$752,500
$752,000
$737,000
$1,165,000
$695,000
$831,248
$802,250
$910,000
$760,000
$957,836
$994,000
$657,314
$585,000
$587,500
The Lyons
N/A
Avg. Price / ft2
Past 12 months
Past 12 months
-
-
-
-
-
-
-
-
-
-
-
-
-
-
-
-
-
-
-
-
-
-
The Lyons
N/A
Avg. Price
Past 12 months
Past 12 months
-
-
-
-
-
-
$510,000
-
-
-
-
-
-
-
-
-
-
-
-
-
-
-
The Lyons
N/A
Median Price
Past 12 months
Past 12 months
-
-
-
-
-
-
$510,000
-
-
-
-
-
-
-
-
-
-
-
-
-
-
-
The Lyons
$1,247
Avg. Price / ft2
Past 12 months
Past 12 months
$1,032
$1,163
$1,076
-
$938
-
$869
$1,010
$1,026
$972
$1,053
-
$855
$883
$807
$780
$950
$819
-
$887
$716
$595
The Lyons
$978,333
Avg. Price
Past 12 months
Past 12 months
$795,000
$920,000
$861,000
-
$750,000
-
$710,000
$724,375
$752,500
$752,000
$731,750
-
$582,500
$662,500
$605,000
$624,000
$760,000
$655,000
$606,000
$649,876
$555,500
$376,000
The Lyons
$875,000
Median Price
Past 12 months
Past 12 months
$785,000
$920,000
$861,000
-
$750,000
-
$710,000
$730,000
$752,500
$752,000
$731,750
-
$582,500
$662,500
$605,000
$624,000
$760,000
$655,000
$606,000
$650,000
$555,500
$376,000
The Lyons
N/A
Avg. Price / ft2
Past 12 months
Past 12 months
-
-
-
-
-
-
-
-
-
-
-
-
-
-
$1,000
$910
-
$999
$906
-
-
$750
The Lyons
N/A
Avg. Price
Past 12 months
Past 12 months
-
$1,261,406
-
-
-
-
$1,525,000
$1,975,000
-
-
$1,275,000
$1,165,000
$999,999
$999,995
$999,500
$915,874
-
$978,418
$996,500
$949,000
$690,000
$762,500
The Lyons
N/A
Median Price
Past 12 months
Past 12 months
-
$1,261,406
-
-
-
-
$1,525,000
$1,975,000
-
-
$1,275,000
$1,165,000
$999,999
$999,995
$999,500
$915,874
-
$978,418
$996,500
$949,000
$690,000
$762,500
The Lyons
N/A
Avg. Price / ft2
Past 12 months
Past 12 months
-
-
-
-
-
-
-
-
-
-
-
-
-
-
-
-
-
-
-
-
-
-
The Lyons
N/A
Avg. Price
Past 12 months
Past 12 months
-
-
-
-
-
-
-
-
-
-
-
-
-
-
-
-
-
-
-
-
-
-
The Lyons
N/A
Median Price
Past 12 months
Past 12 months
-
-
-
-
-
-
-
-
-
-
-
-
-
-
-
-
-
-
-
-
-
-
The Lyons
N/A
Avg. Price / ft2
Past 12 months
Past 12 months
-
-
$1,413
-
-
-
-
-
-
-
-
-
-
-
-
-
-
-
-
-
-
-
The Lyons
N/A
Avg. Price
Past 12 months
Past 12 months
-
-
$3,250,000
-
-
-
-
-
-
-
-
-
-
-
-
-
-
-
-
-
-
-
The Lyons
N/A
Median Price
Past 12 months
Past 12 months
-
-
$3,250,000
-
-
-
-
-
-
-
-
-
-
-
-
-
-
-
-
-
-
-
The Lyons
N/A
Avg. Price / ft2
Past 12 months
Past 12 months
-
-
-
-
-
-
-
-
-
-
-
-
-
-
-
-
-
-
-
-
-
-
The Lyons
N/A
Avg. Price
Past 12 months
Past 12 months
-
-
-
-
-
-
-
-
-
-
-
-
-
-
-
-
-
-
-
-
-
-
The Lyons
N/A
Median Price
Past 12 months
Past 12 months
-
-
-
-
-
-
-
-
-
-
-
-
-
-
-
-
-
-
-
-
-
-
The Clifton House
$1,095
Avg. Price / ft2
Past 12 months
Past 12 months
$1,294
$1,104
$904
$1,052
$918
-
$1,032
-
-
$1,595
-
$927
$840
$979
$943
$753
$1,053
$909
$920
-
$580
$565
The Clifton House
$911,250
Avg. Price
Past 12 months
Past 12 months
$1,606,250
$1,539,000
$800,000
$815,000
$712,500
$350,000
$522,333
-
$827,500
$2,342,000
$762,250
$894,700
$630,000
$2,275,000
$330,000
$744,000
$1,012,500
$855,300
$1,144,980
$635,000
$298,700
$430,000
The Clifton House
$862,500
Median Price
Past 12 months
Past 12 months
$1,527,500
$915,000
$800,000
$815,000
$712,500
$350,000
$407,000
-
$827,500
$1,475,000
$762,250
$782,000
$630,000
$2,275,000
$330,000
$744,000
$647,500
$682,000
$1,100,000
$635,000
$250,000
$430,000
The Clifton House
$944
Avg. Price / ft2
Past 12 months
Past 12 months
$1,343
$956
-
-
-
-
-
-
-
-
-
-
-
-
$943
$753
-
$840
$666
-
$522
-
The Clifton House
$425,000
Avg. Price
Past 12 months
Past 12 months
$423,333
$430,000
$425,000
-
-
$350,000
$383,500
-
-
$372,500
-
-
-
-
$330,000
$339,000
$390,000
$378,000
$299,900
-
$253,625
-
The Clifton House
$425,000
Median Price
Past 12 months
Past 12 months
$400,000
$430,000
$425,000
-
-
$350,000
$383,500
-
-
$372,500
-
-
-
-
$330,000
$339,000
$390,000
$378,000
$299,900
-
$245,000
-
The Clifton House
N/A
Avg. Price / ft2
Past 12 months
Past 12 months
-
$1,253
-
$1,052
$918
-
$1,032
-
-
$1,595
-
$870
$840
-
-
-
$827
$849
$867
-
$639
$565
The Clifton House
$862,500
Avg. Price
Past 12 months
Past 12 months
-
$920,000
-
$815,000
$712,500
-
$800,000
-
$827,500
$1,475,000
$762,250
$695,667
$630,000
-
-
-
$647,500
$680,500
$650,000
$635,000
$479,000
$430,000
The Clifton House
$862,500
Median Price
Past 12 months
Past 12 months
-
$920,000
-
$815,000
$712,500
-
$800,000
-
$827,500
$1,475,000
$762,250
$655,000
$630,000
-
-
-
$647,500
$680,500
$650,000
$635,000
$479,000
$430,000
The Clifton House
$1,246
Avg. Price / ft2
Past 12 months
Past 12 months
$1,246
-
$904
-
-
-
-
-
-
-
-
$1,042
-
$979
-
-
-
$974
$917
-
-
-
The Clifton House
$1,495,000
Avg. Price
Past 12 months
Past 12 months
$1,618,333
-
$1,175,000
-
-
-
-
-
-
-
-
$1,193,250
-
$1,150,000
-
$1,149,000
-
$1,268,750
$1,156,250
-
-
-
The Clifton House
$1,495,000
Median Price
Past 12 months
Past 12 months
$1,560,000
-
$1,175,000
-
-
-
-
-
-
-
-
$1,193,250
-
$1,150,000
-
$1,149,000
-
$1,268,750
$1,156,250
-
-
-
The Clifton House
N/A
Avg. Price / ft2
Past 12 months
Past 12 months
-
-
-
-
-
-
-
-
-
-
-
-
-
-
-
-
$1,278
-
$1,231
-
-
-
The Clifton House
N/A
Avg. Price
Past 12 months
Past 12 months
$3,362,500
-
-
-
-
-
-
-
-
-
-
-
-
$3,400,000
-
-
$2,365,000
-
$2,462,500
-
-
-
The Clifton House
N/A
Median Price
Past 12 months
Past 12 months
$3,362,500
-
-
-
-
-
-
-
-
-
-
-
-
$3,400,000
-
-
$2,365,000
-
$2,462,500
-
-
-
The Clifton House
N/A
Avg. Price / ft2
Past 12 months
Past 12 months
-
-
-
-
-
-
-
-
-
-
-
-
-
-
-
-
-
-
-
-
-
-
The Clifton House
N/A
Avg. Price
Past 12 months
Past 12 months
-
$4,675,000
-
-
-
-
-
-
-
$4,745,000
-
-
-
-
-
-
-
-
-
-
-
-
The Clifton House
N/A
Median Price
Past 12 months
Past 12 months
-
$4,675,000
-
-
-
-
-
-
-
$4,745,000
-
-
-
-
-
-
-
-
-
-
-
-
The Clifton House
N/A
Avg. Price / ft2
Past 12 months
Past 12 months
-
-
-
-
-
-
-
-
-
-
-
-
-
-
-
-
-
-
-
-
-
-
The Clifton House
N/A
Avg. Price
Past 12 months
Past 12 months
-
-
-
-
-
-
-
-
-
-
-
-
-
-
-
-
-
-
-
-
-
-
The Clifton House
N/A
Median Price
Past 12 months
Past 12 months
-
-
-
-
-
-
-
-
-
-
-
-
-
-
-
-
-
-
-
-
-
-
157 West 79th Street
N/A
Avg. Price / ft2
Past 12 months
Past 12 months
$844
-
$816
$769
-
-
$1,069
-
$989
$1,329
$982
$890
$1,074
-
$780
$756
-
$861
$721
$722
$544
-
157 West 79th Street
N/A
Avg. Price
Past 12 months
Past 12 months
$827,500
$354,500
$376,638
$538,000
-
-
$916,300
$1,000,000
$897,800
$1,280,000
$1,056,500
$990,667
$853,333
-
$507,000
$717,472
$511,493
$725,500
$560,625
$778,350
$443,100
$445,000
157 West 79th Street
N/A
Median Price
Past 12 months
Past 12 months
$827,500
$354,500
$376,638
$538,000
-
-
$916,300
$1,000,000
$740,000
$1,280,000
$965,750
$890,000
$575,000
-
$507,000
$758,750
$324,480
$725,500
$593,750
$775,000
$434,800
$440,000
157 West 79th Street
N/A
Avg. Price / ft2
Past 12 months
Past 12 months
-
-
-
-
-
-
-
-
-
-
-
-
-
-
-
$710
-
-
-
-
$508
-
157 West 79th Street
N/A
Avg. Price
Past 12 months
Past 12 months
-
$299,000
-
-
-
-
-
-
-
-
-
-
-
-
-
$284,000
$317,240
-
-
-
$203,000
-
157 West 79th Street
N/A
Median Price
Past 12 months
Past 12 months
-
$299,000
-
-
-
-
-
-
-
-
-
-
-
-
-
$284,000
$317,240
-
-
-
$203,000
-
157 West 79th Street
N/A
Avg. Price / ft2
Past 12 months
Past 12 months
$844
-
$816
$769
-
-
$1,069
-
$989
-
$982
$890
-
-
$780
$778
-
$861
$721
$722
$581
-
157 West 79th Street
N/A
Avg. Price
Past 12 months
Past 12 months
$675,000
$410,000
$510,000
$538,000
-
-
$916,300
$1,000,000
$724,750
$965,000
$775,500
$890,000
$555,000
-
$507,000
$685,208
$900,000
$725,500
$560,625
$596,250
$513,200
$451,667
157 West 79th Street
N/A
Median Price
Past 12 months
Past 12 months
$675,000
$410,000
$510,000
$538,000
-
-
$916,300
$1,000,000
$717,500
$965,000
$775,500
$890,000
$555,000
-
$507,000
$758,750
$900,000
$725,500
$593,750
$480,000
$465,000
$440,000
157 West 79th Street
N/A
Avg. Price / ft2
Past 12 months
Past 12 months
-
-
-
-
-
-
-
-
-
$1,329
-
-
$1,074
-
-
-
-
-
-
-
-
-
157 West 79th Street
N/A
Avg. Price
Past 12 months
Past 12 months
$980,000
-
-
-
-
-
-
-
$1,590,000
$1,595,000
$945,000
$1,537,000
$1,450,000
-
-
$1,280,000
-
-
-
$1,051,500
$705,000
$385,000
157 West 79th Street
N/A
Median Price
Past 12 months
Past 12 months
$980,000
-
-
-
-
-
-
-
$1,590,000
$1,595,000
$945,000
$1,537,000
$1,450,000
-
-
$1,280,000
-
-
-
$1,051,500
$705,000
$385,000
157 West 79th Street
N/A
Avg. Price / ft2
Past 12 months
Past 12 months
-
-
-
-
-
-
-
-
-
-
-
-
-
-
-
-
-
-
-
-
-
-
157 West 79th Street
N/A
Avg. Price
Past 12 months
Past 12 months
-
-
-
-
-
-
-
-
-
-
$1,730,000
-
-
-
-
-
-
-
-
-
-
-
157 West 79th Street
N/A
Median Price
Past 12 months
Past 12 months
-
-
-
-
-
-
-
-
-
-
$1,730,000
-
-
-
-
-
-
-
-
-
-
-
157 West 79th Street
N/A
Avg. Price / ft2
Past 12 months
Past 12 months
-
-
-
-
-
-
-
-
-
-
-
-
-
-
-
-
-
-
-
-
-
-
157 West 79th Street
N/A
Avg. Price
Past 12 months
Past 12 months
-
-
-
-
-
-
-
-
-
-
-
-
-
-
-
-
-
-
-
-
-
-
157 West 79th Street
N/A
Median Price
Past 12 months
Past 12 months
-
-
-
-
-
-
-
-
-
-
-
-
-
-
-
-
-
-
-
-
-
-
157 West 79th Street
N/A
Avg. Price / ft2
Past 12 months
Past 12 months
-
-
-
-
-
-
-
-
-
-
-
-
-
-
-
-
-
-
-
-
-
-
157 West 79th Street
N/A
Avg. Price
Past 12 months
Past 12 months
-
-
-
-
-
-
-
-
-
-
-
-
-
-
-
-
-
-
-
-
-
-
157 West 79th Street
N/A
Median Price
Past 12 months
Past 12 months
-
-
-
-
-
-
-
-
-
-
-
-
-
-
-
-
-
-
-
-
-
-
The Dorset
N/A
Avg. Price / ft2
Past 12 months
Past 12 months
$1,234
-
-
$1,088
-
-
-
-
-
$992
$1,196
$889
-
$829
$760
-
$953
-
-
$742
-
-
The Dorset
$1,560,000
Avg. Price
Past 12 months
Past 12 months
$1,434,000
$1,037,500
$2,210,000
$691,667
-
-
$975,000
$831,667
-
$892,500
$1,412,500
$1,025,000
$1,444,870
$705,000
$927,500
-
$848,750
$982,500
$562,500
$668,100
$806,667
-
The Dorset
$1,560,000
Median Price
Past 12 months
Past 12 months
$1,560,000
$1,037,500
$2,210,000
$800,000
-
-
$975,000
$945,000
-
$892,500
$1,450,000
$1,025,000
$1,464,740
$705,000
$927,500
-
$807,500
$775,000
$322,500
$668,100
$950,000
-
The Dorset
N/A
Avg. Price / ft2
Past 12 months
Past 12 months
-
-
-
-
-
-
-
-
-
-
-
-
-
-
-
-
-
-
-
-
-
-
The Dorset
N/A
Avg. Price
Past 12 months
Past 12 months
-
-
-
$350,000
-
-
-
-
-
-
-
-
-
-
-
-
$350,000
$280,000
$315,000
-
-
-
The Dorset
N/A
Median Price
Past 12 months
Past 12 months
-
-
-
$350,000
-
-
-
-
-
-
-
-
-
-
-
-
$350,000
$280,000
$315,000
-
-
-
The Dorset
N/A
Avg. Price / ft2
Past 12 months
Past 12 months
$949
-
-
$1,088
-
-
-
-
-
$992
-
$889
-
$829
$738
-
$953
-
-
$742
-
-
The Dorset
N/A
Avg. Price
Past 12 months
Past 12 months
$564,000
$885,000
-
$862,500
-
-
$975,000
$831,667
-
$892,500
-
$800,000
-
$705,000
$605,000
-
$807,500
$775,000
-
$668,100
-
-
The Dorset
N/A
Median Price
Past 12 months
Past 12 months
$564,000
$885,000
-
$862,500
-
-
$975,000
$945,000
-
$892,500
-
$800,000
-
$705,000
$605,000
-
$807,500
$775,000
-
$668,100
-
-
The Dorset
N/A
Avg. Price / ft2
Past 12 months
Past 12 months
$1,520
-
-
-
-
-
-
-
-
-
$1,000
-
-
-
$781
-
-
-
-
-
-
-
The Dorset
$1,560,000
Avg. Price
Past 12 months
Past 12 months
$1,703,333
-
$1,495,000
-
-
-
-
-
-
-
$1,350,000
$1,250,000
$1,200,000
-
$1,250,000
-
-
-
$686,250
-
$981,000
-
The Dorset
$1,560,000
Median Price
Past 12 months
Past 12 months
$1,650,000
-
$1,495,000
-
-
-
-
-
-
-
$1,400,000
$1,250,000
$1,200,000
-
$1,250,000
-
-
-
$686,250
-
$981,000
-
The Dorset
N/A
Avg. Price / ft2
Past 12 months
Past 12 months
-
-
-
-
-
-
-
-
-
-
$1,391
-
-
-
-
-
-
-
-
-
-
-
The Dorset
N/A
Avg. Price
Past 12 months
Past 12 months
$1,900,000
$1,190,000
$2,925,000
-
-
-
-
-
-
-
$1,600,000
-
$1,464,740
-
-
-
$1,430,000
$2,100,000
-
-
-
-
The Dorset
N/A
Median Price
Past 12 months
Past 12 months
$1,900,000
$1,190,000
$2,925,000
-
-
-
-
-
-
-
$1,600,000
-
$1,464,740
-
-
-
$1,430,000
$2,100,000
-
-
-
-
The Dorset
N/A
Avg. Price / ft2
Past 12 months
Past 12 months
-
-
-
-
-
-
-
-
-
-
-
-
-
-
-
-
-
-
-
-
-
-
The Dorset
N/A
Avg. Price
Past 12 months
Past 12 months
-
-
-
-
-
-
-
-
-
-
-
-
-
-
-
-
-
-
-
-
-
-
The Dorset
N/A
Median Price
Past 12 months
Past 12 months
-
-
-
-
-
-
-
-
-
-
-
-
-
-
-
-
-
-
-
-
-
-
The Dorset
N/A
Avg. Price / ft2
Past 12 months
Past 12 months
-
-
-
-
-
-
-
-
-
-
-
-
-
-
-
-
-
-
-
-
-
-
The Dorset
N/A
Avg. Price
Past 12 months
Past 12 months
-
-
-
-
-
-
-
-
-
-
-
-
-
-
-
-
-
-
-
-
-
-
The Dorset
N/A
Median Price
Past 12 months
Past 12 months
-
-
-
-
-
-
-
-
-
-
-
-
-
-
-
-
-
-
-
-
-
-
The Manchester
N/A
Avg. Price / ft2
Past 12 months
Past 12 months
-
$1,143
-
$1,500
$1,140
$1,070
-
-
$1,233
-
$1,250
$1,004
-
$1,001
-
$950
$991
$1,072
$1,033
-
$759
-
The Manchester
N/A
Avg. Price
Past 12 months
Past 12 months
$772,500
$859,375
-
$929,500
$399,000
$599,625
$1,284,000
-
$431,500
$411,000
$1,039,833
$683,500
-
$902,500
-
$950,000
$347,000
$663,000
$592,000
$442,500
$593,167
$715,000
The Manchester
N/A
Median Price
Past 12 months
Past 12 months
$772,500
$893,750
-
$929,500
$399,000
$574,500
$1,284,000
-
$431,500
$411,000
$1,145,000
$735,000
-
$902,500
-
$950,000
$347,000
$559,500
$580,000
$442,500
$664,500
$715,000
The Manchester
N/A
Avg. Price / ft2
Past 12 months
Past 12 months
-
-
-
-
$1,140
$1,184
-
-
$1,233
-
-
-
-
-
-
-
$991
$1,026
$1,057
-
$700
-
The Manchester
N/A
Avg. Price
Past 12 months
Past 12 months
$360,000
-
-
$359,000
$399,000
$414,500
-
-
$431,500
-
$395,000
$382,500
-
-
-
-
$347,000
$358,500
$370,000
$315,000
$245,000
-
The Manchester
N/A
Median Price
Past 12 months
Past 12 months
$360,000
-
-
$359,000
$399,000
$414,500
-
-
$431,500
-
$395,000
$382,500
-
-
-
-
$347,000
$358,500
$370,000
$315,000
$245,000
-
The Manchester
N/A
Avg. Price / ft2
Past 12 months
Past 12 months
-
-
-
-
-
$1,014
-
-
-
-
-
$1,004
-
$897
-
-
-
-
$1,009
-
$788
-
The Manchester
N/A
Avg. Price
Past 12 months
Past 12 months
$1,185,000
$875,000
-
-
-
$661,333
-
-
-
-
$870,000
$758,750
-
$700,000
-
-
-
-
$610,000
$570,000
$593,000
-
The Manchester
N/A
Median Price
Past 12 months
Past 12 months
$1,185,000
$875,000
-
-
-
$599,000
-
-
-
-
$870,000
$782,500
-
$700,000
-
-
-
-
$610,000
$570,000
$630,000
-
The Manchester
N/A
Avg. Price / ft2
Past 12 months
Past 12 months
-
$1,143
-
$1,500
-
-
-
-
-
-
$1,250
-
-
$1,105
-
$950
-
$1,119
-
-
$790
-
The Manchester
N/A
Avg. Price
Past 12 months
Past 12 months
-
$1,056,250
-
$1,500,000
-
-
$1,284,000
-
-
-
$1,243,500
-
-
$1,105,000
-
$950,000
-
$1,175,000
-
-
$767,500
$715,000
The Manchester
N/A
Median Price
Past 12 months
Past 12 months
-
$1,056,250
-
$1,500,000
-
-
$1,284,000
-
-
-
$1,260,000
-
-
$1,105,000
-
$950,000
-
$1,175,000
-
-
$767,500
$715,000
The Manchester
N/A
Avg. Price / ft2
Past 12 months
Past 12 months
-
-
-
-
-
-
-
-
-
-
-
-
-
-
-
-
-
-
-
-
-
-
The Manchester
N/A
Avg. Price
Past 12 months
Past 12 months
-
-
-
-
-
-
-
-
-
-
-
-
-
-
-
-
-
-
-
-
-
-
The Manchester
N/A
Median Price
Past 12 months
Past 12 months
-
-
-
-
-
-
-
-
-
-
-
-
-
-
-
-
-
-
-
-
-
-
The Manchester
N/A
Avg. Price / ft2
Past 12 months
Past 12 months
-
-
-
-
-
-
-
-
-
-
-
-
-
-
-
-
-
-
-
-
-
-
The Manchester
N/A
Avg. Price
Past 12 months
Past 12 months
-
-
-
-
-
-
-
-
-
-
-
-
-
-
-
-
-
-
-
-
-
-
The Manchester
N/A
Median Price
Past 12 months
Past 12 months
-
-
-
-
-
-
-
-
-
-
-
-
-
-
-
-
-
-
-
-
-
-
171 West 79th Street
N/A
Avg. Price / ft2
Past 12 months
Past 12 months
-
-
$1,610
$1,582
-
-
$1,511
-
-
-
-
-
$1,091
$1,001
$1,121
-
$1,000
$1,367
-
$827
-
-
171 West 79th Street
$2,165,000
Avg. Price
Past 12 months
Past 12 months
-
$1,843,529
$2,330,000
$1,980,000
-
-
$1,756,250
$1,778,750
$800,000
-
-
-
$1,200,000
$1,264,000
$1,402,500
-
$1,031,981
$1,588,000
$1,037,500
$952,500
$877,500
$935,000
171 West 79th Street
$2,165,000
Median Price
Past 12 months
Past 12 months
-
$1,950,000
$2,330,000
$1,980,000
-
-
$1,842,500
$1,782,500
$800,000
-
-
-
$1,200,000
$1,264,000
$1,402,500
-
$1,100,000
$1,588,000
$1,037,500
$952,500
$877,500
$935,000
171 West 79th Street
N/A
Avg. Price / ft2
Past 12 months
Past 12 months
-
-
-
-
-
-
-
-
-
-
-
-
-
-
-
-
-
-
-
-
-
-
171 West 79th Street
N/A
Avg. Price
Past 12 months
Past 12 months
-
-
-
-
-
-
-
-
-
-
-
-
-
-
-
-
-
-
-
-
-
-
171 West 79th Street
N/A
Median Price
Past 12 months
Past 12 months
-
-
-
-
-
-
-
-
-
-
-
-
-
-
-
-
-
-
-
-
-
-
171 West 79th Street
N/A
Avg. Price / ft2
Past 12 months
Past 12 months
-
-
-
-
-
-
-
-
-
-
-
-
-
-
-
-
-
-
-
-
-
-
171 West 79th Street
N/A
Avg. Price
Past 12 months
Past 12 months
-
-
-
-
-
-
-
$2,200,000
$800,000
-
-
-
-
-
-
-
-
-
-
-
-
-
171 West 79th Street
N/A
Median Price
Past 12 months
Past 12 months
-
-
-
-
-
-
-
$2,200,000
$800,000
-
-
-
-
-
-
-
-
-
-
-
-
-
171 West 79th Street
N/A
Avg. Price / ft2
Past 12 months
Past 12 months
-
-
$1,517
$1,582
-
-
-
-
-
-
-
-
$1,091
-
$1,109
-
$1,000
$1,367
-
$827
-
-
171 West 79th Street
N/A
Avg. Price
Past 12 months
Past 12 months
-
$1,595,000
$2,275,000
$1,740,000
-
-
$1,385,000
$1,638,333
-
-
-
-
$1,200,000
$1,027,000
$1,220,000
-
$1,031,981
$1,588,000
$1,037,500
$952,500
$877,500
$935,000
171 West 79th Street
N/A
Median Price
Past 12 months
Past 12 months
-
$1,595,000
$2,275,000
$1,740,000
-
-
$1,385,000
$1,490,000
-
-
-
-
$1,200,000
$1,027,000
$1,220,000
-
$1,100,000
$1,588,000
$1,037,500
$952,500
$877,500
$935,000
171 West 79th Street
N/A
Avg. Price / ft2
Past 12 months
Past 12 months
-
-
$1,704
-
-
-
$1,511
-
-
-
-
-
-
$1,001
$1,132
-
-
-
-
-
-
-
171 West 79th Street
$2,165,000
Avg. Price
Past 12 months
Past 12 months
-
$1,967,794
$2,385,000
$2,220,000
-
-
$2,127,500
-
-
-
-
-
-
$1,501,000
$1,585,000
-
-
-
-
-
-
-
171 West 79th Street
$2,165,000
Median Price
Past 12 months
Past 12 months
-
$1,967,794
$2,385,000
$2,220,000
-
-
$2,127,500
-
-
-
-
-
-
$1,501,000
$1,585,000
-
-
-
-
-
-
-
171 West 79th Street
N/A
Avg. Price / ft2
Past 12 months
Past 12 months
-
-
-
-
-
-
-
-
-
-
-
-
-
-
-
-
-
-
-
-
-
-
171 West 79th Street
N/A
Avg. Price
Past 12 months
Past 12 months
-
-
-
-
-
-
-
-
-
-
-
-
-
-
-
-
-
-
-
-
-
-
171 West 79th Street
N/A
Median Price
Past 12 months
Past 12 months
-
-
-
-
-
-
-
-
-
-
-
-
-
-
-
-
-
-
-
-
-
-
171 West 79th Street
N/A
Avg. Price / ft2
Past 12 months
Past 12 months
-
-
-
-
-
-
-
-
-
-
-
-
-
-
-
-
-
-
-
-
-
-
171 West 79th Street
N/A
Avg. Price
Past 12 months
Past 12 months
-
-
-
-
-
-
-
-
-
-
-
-
-
-
-
-
-
-
-
-
-
-
171 West 79th Street
N/A
Median Price
Past 12 months
Past 12 months
-
-
-
-
-
-
-
-
-
-
-
-
-
-
-
-
-
-
-
-
-
-
118 West 79th Street
N/A
Avg. Price / ft2
Past 12 months
Past 12 months
-
-
-
$1,506
-
-
$1,638
$1,591
$590
-
-
$1,456
$1,095
$1,167
$1,139
$1,250
-
$1,039
$905
$705
$803
-
118 West 79th Street
$2,917,500
Avg. Price
Past 12 months
Past 12 months
-
-
-
$3,083,333
-
$2,900,000
$3,350,000
$2,848,300
$1,954,130
-
$3,825,000
$2,592,500
$1,800,800
$2,160,000
$2,050,000
$2,250,000
$3,337,334
$1,975,000
$1,844,846
$1,437,500
$1,660,000
-
118 West 79th Street
$2,917,500
Median Price
Past 12 months
Past 12 months
-
-
-
$3,250,000
-
$2,900,000
$3,350,000
$3,250,000
$1,954,130
-
$3,825,000
$2,592,500
$2,065,000
$2,120,000
$2,050,000
$2,250,000
$3,447,500
$1,975,000
$1,844,846
$1,437,500
$1,800,000
-
118 West 79th Street
N/A
Avg. Price / ft2
Past 12 months
Past 12 months
-
-
-
-
-
-
-
-
-
-
-
-
-
-
-
-
-
-
-
-
-
-
118 West 79th Street
N/A
Avg. Price
Past 12 months
Past 12 months
-
-
-
-
-
-
-
-
-
-
-
-
-
-
-
-
-
-
-
-
-
-
118 West 79th Street
N/A
Median Price
Past 12 months
Past 12 months
-
-
-
-
-
-
-
-
-
-
-
-
-
-
-
-
-
-
-
-
-
-
118 West 79th Street
N/A
Avg. Price / ft2
Past 12 months
Past 12 months
-
-
-
-
-
-
-
-
-
-
-
-
$881
-
-
-
-
-
-
$705
-
-
118 West 79th Street
N/A
Avg. Price
Past 12 months
Past 12 months
-
-
-
-
-
-
-
-
-
-
-
-
$969,000
-
-
-
-
-
-
$775,000
-
-
118 West 79th Street
N/A
Median Price
Past 12 months
Past 12 months
-
-
-
-
-
-
-
-
-
-
-
-
$969,000
-
-
-
-
-
-
$775,000
-
-
118 West 79th Street
N/A
Avg. Price / ft2
Past 12 months
Past 12 months
-
-
-
$1,806
-
-
$1,609
-
-
-
-
-
$1,206
$1,189
$1,139
-
-
-
-
-
$708
-
118 West 79th Street
N/A
Avg. Price
Past 12 months
Past 12 months
-
-
-
$3,250,000
-
-
$3,700,000
$1,476,462
-
-
$3,825,000
-
$1,990,000
$2,140,000
$2,050,000
-
-
-
-
$2,100,000
$1,317,500
-
118 West 79th Street
N/A
Median Price
Past 12 months
Past 12 months
-
-
-
$3,250,000
-
-
$3,700,000
$1,476,462
-
-
$3,825,000
-
$2,200,000
$2,140,000
$2,050,000
-
-
-
-
$2,100,000
$1,317,500
-
118 West 79th Street
N/A
Avg. Price / ft2
Past 12 months
Past 12 months
-
-
-
$1,356
-
-
$1,667
-
$590
-
-
$1,456
$1,087
$1,159
-
$1,250
-
$1,039
$905
-
$898
-
118 West 79th Street
$2,917,500
Avg. Price
Past 12 months
Past 12 months
-
-
-
$3,000,000
-
-
$3,000,000
$3,250,000
$1,954,130
-
-
$2,620,000
$2,065,000
$2,166,667
-
$2,250,000
$3,250,793
$1,975,000
$1,675,000
-
$2,002,500
-
118 West 79th Street
$2,917,500
Median Price
Past 12 months
Past 12 months
-
-
-
$3,000,000
-
-
$3,000,000
$3,250,000
$1,954,130
-
-
$2,620,000
$2,065,000
$2,100,000
-
$2,250,000
$3,250,793
$1,975,000
$1,675,000
-
$2,002,500
-
118 West 79th Street
N/A
Avg. Price / ft2
Past 12 months
Past 12 months
-
-
-
-
-
-
-
$1,591
-
-
-
-
-
-
-
-
-
-
-
-
-
-
118 West 79th Street
N/A
Avg. Price
Past 12 months
Past 12 months
-
-
-
-
-
$2,900,000
-
$3,818,438
-
-
-
$2,565,000
-
-
-
-
-
-
$2,014,692
-
-
-
118 West 79th Street
N/A
Median Price
Past 12 months
Past 12 months
-
-
-
-
-
$2,900,000
-
$3,818,438
-
-
-
$2,565,000
-
-
-
-
-
-
$2,014,692
-
-
-
118 West 79th Street
N/A
Avg. Price / ft2
Past 12 months
Past 12 months
-
-
-
-
-
-
-
-
-
-
-
-
-
-
-
-
-
-
-
-
-
-
118 West 79th Street
N/A
Avg. Price
Past 12 months
Past 12 months
-
-
-
-
-
-
-
-
-
-
-
-
-
-
-
-
-
-
-
-
-
-
118 West 79th Street
N/A
Median Price
Past 12 months
Past 12 months
-
-
-
-
-
-
-
-
-
-
-
-
-
-
-
-
-
-
-
-
-
-