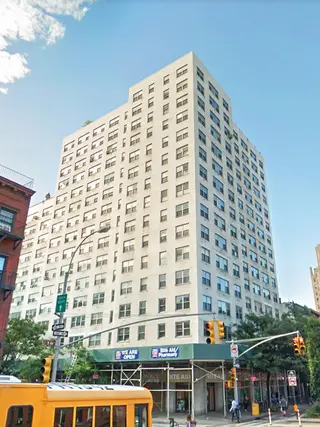
London Towne House, 360 West 22nd Street: Price Comparison
at The Southeast corner of Ninth Avenue Building Profile
London Towne House
$970,704
Avg. Price
Past 12 months
Past 12 months
2024
$776,604
2023
$1,072,902
2022
$1,905,000
2021
$710,000
2020
$1,102,500
2019
$1,192,500
2018
$1,131,750
2017
$872,611
2016
$1,131,571
2015
$1,390,960
2014
$1,468,667
2013
$624,000
2012
$754,668
2011
$690,818
2010
$724,167
2009
$411,786
2008
$693,071
2007
$611,500
2006
$612,500
2005
$763,400
2004
$516,000
2003
$425,638
London Towne House
$877,500
Median Price
Past 12 months
Past 12 months
2024
$778,750
2023
$943,304
2022
$1,850,000
2021
$735,000
2020
$1,102,500
2019
$1,192,500
2018
$870,000
2017
$775,000
2016
$810,000
2015
$1,575,000
2014
$1,525,000
2013
$624,000
2012
$730,000
2011
$662,500
2010
$677,500
2009
$440,000
2008
$539,000
2007
$600,000
2006
$612,500
2005
$625,000
2004
$460,500
2003
$417,500
London Towne House
$694,700
Avg. Price
Past 12 months
Past 12 months
2024
$687,083
2023
$455,000
2022
-
2021
$631,250
2020
-
2019
-
2018
$587,500
2017
$624,000
2016
$666,667
2015
$582,500
2014
$625,000
2013
$433,000
2012
$479,500
2011
$404,300
2010
-
2009
$463,250
2008
$513,667
2007
$550,000
2006
$505,000
2005
$435,000
2004
$375,000
2003
$294,000
London Towne House
$625,000
Median Price
Past 12 months
Past 12 months
2024
$662,500
2023
$455,000
2022
-
2021
$627,500
2020
-
2019
-
2018
$587,500
2017
$605,000
2016
$720,000
2015
$582,500
2014
$625,000
2013
$433,000
2012
$479,500
2011
$390,000
2010
-
2009
$484,000
2008
$535,000
2007
$550,000
2006
$505,000
2005
$400,000
2004
$375,000
2003
$294,000
London Towne House
$1,090,885
Avg. Price
Past 12 months
Past 12 months
2024
$910,885
2023
$943,304
2022
-
2021
$815,000
2020
$767,500
2019
$1,192,500
2018
$855,000
2017
$939,500
2016
$873,000
2015
-
2014
$998,000
2013
$815,000
2012
$723,000
2011
$692,500
2010
$666,250
2009
-
2008
$689,000
2007
$627,500
2006
$720,000
2005
$705,000
2004
$534,750
2003
$433,500
London Towne House
$956,769
Median Price
Past 12 months
Past 12 months
2024
$951,769
2023
$943,304
2022
-
2021
$865,000
2020
$767,500
2019
$1,192,500
2018
$855,000
2017
$951,000
2016
$873,000
2015
-
2014
$998,000
2013
$815,000
2012
$730,000
2011
$700,000
2010
$666,250
2009
-
2008
$689,000
2007
$627,500
2006
$720,000
2005
$705,000
2004
$522,500
2003
$420,000
London Towne House
$1,870,000
Avg. Price
Past 12 months
Past 12 months
2024
-
2023
-
2022
$1,932,500
2021
-
2020
$1,437,500
2019
-
2018
$1,680,625
2017
$1,915,000
2016
$2,087,500
2015
$1,795,190
2014
$1,875,000
2013
-
2012
$1,109,006
2011
$1,050,000
2010
$840,000
2009
-
2008
-
2007
-
2006
-
2005
-
2004
$830,000
2003
$649,600
London Towne House
$1,870,000
Median Price
Past 12 months
Past 12 months
2024
-
2023
-
2022
$1,932,500
2021
-
2020
$1,437,500
2019
-
2018
$1,708,750
2017
$1,915,000
2016
$2,087,500
2015
$1,815,379
2014
$1,812,500
2013
-
2012
$1,109,006
2011
$1,050,000
2010
$840,000
2009
-
2008
-
2007
-
2006
-
2005
-
2004
$830,000
2003
$649,600
London Towne House
N/A
Avg. Price
Past 12 months
Past 12 months
2024
-
2023
$1,950,000
2022
$1,850,000
2021
-
2020
-
2019
-
2018
-
2017
-
2016
-
2015
-
2014
$1,735,000
2013
-
2012
-
2011
$1,400,000
2010
-
2009
-
2008
-
2007
-
2006
-
2005
$1,100,000
2004
-
2003
-
London Towne House
N/A
Median Price
Past 12 months
Past 12 months
2024
-
2023
$1,950,000
2022
$1,850,000
2021
-
2020
-
2019
-
2018
-
2017
-
2016
-
2015
-
2014
$1,735,000
2013
-
2012
-
2011
$1,400,000
2010
-
2009
-
2008
-
2007
-
2006
-
2005
$1,100,000
2004
-
2003
-
London Towne House
N/A
Avg. Price
Past 12 months
Past 12 months
2024
-
2023
-
2022
-
2021
-
2020
-
2019
-
2018
-
2017
-
2016
-
2015
-
2014
-
2013
-
2012
-
2011
-
2010
-
2009
-
2008
-
2007
-
2006
-
2005
-
2004
-
2003
-
London Towne House
N/A
Median Price
Past 12 months
Past 12 months
2024
-
2023
-
2022
-
2021
-
2020
-
2019
-
2018
-
2017
-
2016
-
2015
-
2014
-
2013
-
2012
-
2011
-
2010
-
2009
-
2008
-
2007
-
2006
-
2005
-
2004
-
2003
-
London Towne House
N/A
Avg. Price
Past 12 months
Past 12 months
2024
-
2023
-
2022
-
2021
-
2020
-
2019
-
2018
-
2017
-
2016
-
2015
-
2014
-
2013
-
2012
-
2011
-
2010
-
2009
-
2008
-
2007
-
2006
-
2005
-
2004
-
2003
-
London Towne House
N/A
Median Price
Past 12 months
Past 12 months
2024
-
2023
-
2022
-
2021
-
2020
-
2019
-
2018
-
2017
-
2016
-
2015
-
2014
-
2013
-
2012
-
2011
-
2010
-
2009
-
2008
-
2007
-
2006
-
2005
-
2004
-
2003
-
London Terrace Towers
N/A
Avg. Price / ft2
Past 12 months
Past 12 months
$1,218
$1,097
$1,321
$1,164
$1,563
$1,011
$1,323
$1,778
$1,423
$1,187
$1,131
$1,071
$772
$1,005
$790
$900
$1,130
$963
$961
$783
-
$650
London Terrace Towers
$1,084,339
Avg. Price
Past 12 months
Past 12 months
$994,752
$2,031,341
$1,541,250
$1,146,222
$1,715,135
$960,000
$1,142,631
$2,308,000
$1,831,667
$1,020,000
$1,845,286
$1,375,681
$2,543,600
$1,225,000
$711,000
$755,000
$1,123,333
$925,417
$1,135,500
$683,333
$458,333
$552,330
London Terrace Towers
$963,222
Median Price
Past 12 months
Past 12 months
$913,757
$1,102,500
$1,207,500
$931,166
$1,350,000
$960,000
$1,150,000
$1,325,000
$1,180,000
$1,020,000
$1,200,000
$967,500
$879,500
$907,500
$711,000
$755,000
$922,500
$847,500
$1,135,500
$705,000
$520,000
$475,000
London Terrace Towers
N/A
Avg. Price / ft2
Past 12 months
Past 12 months
-
$815
-
-
-
-
-
-
-
-
-
$1,119
$736
-
-
-
-
$965
-
-
-
-
London Terrace Towers
$555,383
Avg. Price
Past 12 months
Past 12 months
-
$532,500
-
$700,000
-
-
-
-
-
-
-
$967,500
$331,000
-
-
-
$425,000
$820,000
-
-
$565,000
$480,000
London Terrace Towers
$555,383
Median Price
Past 12 months
Past 12 months
-
$532,500
-
$700,000
-
-
-
-
-
-
-
$967,500
$331,000
-
-
-
$425,000
$820,000
-
-
$565,000
$480,000
London Terrace Towers
N/A
Avg. Price / ft2
Past 12 months
Past 12 months
$1,218
$1,238
$1,321
$1,109
$1,329
$1,011
$1,323
$1,559
-
$1,187
$1,131
$1,023
$809
$965
$790
$900
$1,043
$962
$961
$783
-
$650
London Terrace Towers
$1,260,657
Avg. Price
Past 12 months
Past 12 months
$994,752
$1,123,500
$1,130,000
$956,833
$1,167,500
$960,000
$1,096,157
$1,098,333
$1,147,500
$1,020,000
$1,004,750
$869,500
$783,500
$803,333
$711,000
$755,000
$891,667
$858,125
$841,000
$755,000
$520,000
$453,750
London Terrace Towers
$964,772
Median Price
Past 12 months
Past 12 months
$913,757
$1,102,500
$1,165,000
$931,166
$1,167,500
$960,000
$1,125,000
$990,000
$1,147,500
$1,020,000
$972,000
$869,500
$783,500
$800,000
$711,000
$755,000
$920,000
$847,500
$841,000
$755,000
$520,000
$452,500
London Terrace Towers
N/A
Avg. Price / ft2
Past 12 months
Past 12 months
-
-
-
$1,382
$2,029
-
-
-
-
-
-
-
-
$829
-
-
$1,392
-
-
-
-
-
London Terrace Towers
N/A
Avg. Price
Past 12 months
Past 12 months
-
$2,731,250
-
$2,350,000
$2,810,405
-
$1,375,000
$4,250,000
-
-
$2,966,000
-
$1,170,000
$1,207,500
-
-
$1,820,000
-
$1,430,000
-
-
-
London Terrace Towers
N/A
Median Price
Past 12 months
Past 12 months
-
$2,731,250
-
$2,350,000
$2,810,405
-
$1,375,000
$4,250,000
-
-
$2,300,000
-
$1,170,000
$1,207,500
-
-
$1,820,000
-
$1,430,000
-
-
-
London Terrace Towers
N/A
Avg. Price / ft2
Past 12 months
Past 12 months
-
-
-
-
-
-
-
-
$1,423
-
-
-
-
-
-
-
-
-
-
-
-
-
London Terrace Towers
N/A
Avg. Price
Past 12 months
Past 12 months
-
$9,296,000
$2,775,000
-
-
-
-
-
$3,200,000
-
-
$2,290,044
$9,650,000
-
-
-
-
-
-
-
-
-
London Terrace Towers
N/A
Median Price
Past 12 months
Past 12 months
-
$9,296,000
$2,775,000
-
-
-
-
-
$3,200,000
-
-
$2,290,044
$9,650,000
-
-
-
-
-
-
-
-
-
London Terrace Towers
N/A
Avg. Price / ft2
Past 12 months
Past 12 months
-
-
-
-
-
-
-
$1,998
-
-
-
-
-
$1,263
-
-
-
-
-
-
-
-
London Terrace Towers
N/A
Avg. Price
Past 12 months
Past 12 months
-
-
-
-
-
-
-
$3,995,000
-
-
-
-
-
$2,525,000
-
-
-
-
-
-
-
-
London Terrace Towers
N/A
Median Price
Past 12 months
Past 12 months
-
-
-
-
-
-
-
$3,995,000
-
-
-
-
-
$2,525,000
-
-
-
-
-
-
-
-
London Terrace Towers
N/A
Avg. Price / ft2
Past 12 months
Past 12 months
-
-
-
-
-
-
-
-
-
-
-
-
-
-
-
-
-
-
-
-
-
-
London Terrace Towers
N/A
Avg. Price
Past 12 months
Past 12 months
-
-
-
-
-
-
-
-
-
-
-
-
-
-
-
-
-
-
-
-
-
-
London Terrace Towers
N/A
Median Price
Past 12 months
Past 12 months
-
-
-
-
-
-
-
-
-
-
-
-
-
-
-
-
-
-
-
-
-
-
Gilsey House
N/A
Avg. Price / ft2
Past 12 months
Past 12 months
$1,081
-
$966
$1,039
-
-
$886
-
-
$1,300
$1,270
$933
$838
$743
$761
-
-
-
$795
$597
$509
$538
Gilsey House
N/A
Avg. Price
Past 12 months
Past 12 months
$4,585,000
-
$2,000,000
$2,425,000
-
-
$2,494,333
-
$2,000,000
$3,645,000
$2,300,000
$1,900,000
$1,675,500
$1,927,567
$1,486,250
-
$1,250,000
-
$1,470,000
$1,266,000
$1,087,250
$913,000
Gilsey House
N/A
Median Price
Past 12 months
Past 12 months
$4,585,000
-
$2,000,000
$2,425,000
-
-
$2,550,000
-
$2,000,000
$2,865,000
$2,300,000
$1,900,000
$1,675,500
$1,357,700
$1,522,500
-
$1,250,000
-
$1,470,000
$1,300,000
$1,062,000
$913,000
Gilsey House
N/A
Avg. Price / ft2
Past 12 months
Past 12 months
-
-
-
-
-
-
-
-
-
-
-
-
-
-
-
-
-
-
-
-
-
-
Gilsey House
N/A
Avg. Price
Past 12 months
Past 12 months
-
-
-
-
-
-
-
-
-
-
-
-
-
-
-
-
-
-
-
-
-
-
Gilsey House
N/A
Median Price
Past 12 months
Past 12 months
-
-
-
-
-
-
-
-
-
-
-
-
-
-
-
-
-
-
-
-
-
-
Gilsey House
N/A
Avg. Price / ft2
Past 12 months
Past 12 months
-
-
-
-
-
-
-
-
-
$1,191
-
-
-
-
-
-
-
-
-
-
-
-
Gilsey House
N/A
Avg. Price
Past 12 months
Past 12 months
-
-
-
-
-
-
-
-
-
$2,450,000
-
-
-
-
-
-
-
-
-
-
-
-
Gilsey House
N/A
Median Price
Past 12 months
Past 12 months
-
-
-
-
-
-
-
-
-
$2,450,000
-
-
-
-
-
-
-
-
-
-
-
-
Gilsey House
N/A
Avg. Price / ft2
Past 12 months
Past 12 months
-
-
$966
-
-
-
$772
-
-
$1,433
$1,270
$933
$838
-
$761
-
-
-
$795
$575
$539
$538
Gilsey House
N/A
Avg. Price
Past 12 months
Past 12 months
-
-
$2,000,000
-
-
-
$2,275,000
-
$2,000,000
$2,865,000
$2,300,000
$1,900,000
$1,675,500
$1,316,350
$1,486,250
-
$1,250,000
-
$1,470,000
$1,149,000
$1,062,000
$913,000
Gilsey House
N/A
Median Price
Past 12 months
Past 12 months
-
-
$2,000,000
-
-
-
$2,275,000
-
$2,000,000
$2,865,000
$2,300,000
$1,900,000
$1,675,500
$1,316,350
$1,522,500
-
$1,250,000
-
$1,470,000
$1,149,000
$1,062,000
$913,000
Gilsey House
N/A
Avg. Price / ft2
Past 12 months
Past 12 months
-
-
-
$1,039
-
-
-
-
-
$1,088
-
-
-
-
-
-
-
-
-
$642
$450
-
Gilsey House
N/A
Avg. Price
Past 12 months
Past 12 months
-
-
-
$2,425,000
-
-
-
-
-
$3,265,000
-
-
-
-
-
-
-
-
-
$1,500,000
$1,350,000
-
Gilsey House
N/A
Median Price
Past 12 months
Past 12 months
-
-
-
$2,425,000
-
-
-
-
-
$3,265,000
-
-
-
-
-
-
-
-
-
$1,500,000
$1,350,000
-
Gilsey House
N/A
Avg. Price / ft2
Past 12 months
Past 12 months
$1,081
-
-
-
-
-
$1,000
-
-
-
-
-
-
$743
-
-
-
-
-
-
-
-
Gilsey House
N/A
Avg. Price
Past 12 months
Past 12 months
$4,585,000
-
-
-
-
-
$2,933,000
-
-
$2,650,000
-
-
-
$3,150,000
-
-
-
-
-
-
-
-
Gilsey House
N/A
Median Price
Past 12 months
Past 12 months
$4,585,000
-
-
-
-
-
$2,933,000
-
-
$2,650,000
-
-
-
$3,150,000
-
-
-
-
-
-
-
-
Gilsey House
N/A
Avg. Price / ft2
Past 12 months
Past 12 months
-
-
-
-
-
-
-
-
-
$1,488
-
-
-
-
-
-
-
-
-
-
-
-
Gilsey House
N/A
Avg. Price
Past 12 months
Past 12 months
-
-
-
-
-
-
-
-
-
$6,995,000
-
-
-
-
-
-
-
-
-
-
-
-
Gilsey House
N/A
Median Price
Past 12 months
Past 12 months
-
-
-
-
-
-
-
-
-
$6,995,000
-
-
-
-
-
-
-
-
-
-
-
-
161 West 16th Street
N/A
Avg. Price / ft2
Past 12 months
Past 12 months
$1,563
$1,072
$1,453
$1,266
$1,648
$1,479
$1,456
$1,301
$1,055
$1,389
$1,174
$1,038
$951
$949
-
$994
$1,140
$1,041
$983
-
$742
$607
161 West 16th Street
$798,778
Avg. Price
Past 12 months
Past 12 months
$1,046,000
$880,250
$1,279,667
$700,540
$1,210,667
$972,200
$975,200
$760,143
$1,115,333
$738,857
$1,422,083
$589,750
$670,667
$625,250
-
$740,194
$596,304
$739,626
$2,030,000
$752,250
$497,333
$643,400
161 West 16th Street
$775,000
Median Price
Past 12 months
Past 12 months
$1,245,000
$758,750
$1,365,500
$690,000
$1,442,000
$785,000
$751,000
$700,000
$725,000
$655,000
$1,197,500
$512,000
$750,000
$647,000
-
$540,000
$597,000
$809,500
$2,030,000
$597,500
$395,000
$467,000
161 West 16th Street
N/A
Avg. Price / ft2
Past 12 months
Past 12 months
-
$1,380
-
$1,265
-
-
$1,342
$1,331
-
$1,237
-
$950
-
$883
-
$1,008
$1,089
-
-
-
$609
-
161 West 16th Street
$754,875
Avg. Price
Past 12 months
Past 12 months
$742,500
$752,167
$622,500
$703,233
$740,000
-
$668,667
$710,500
$650,000
$631,750
-
$475,000
-
$470,000
-
$512,248
$592,608
-
-
-
$335,000
-
161 West 16th Street
$757,500
Median Price
Past 12 months
Past 12 months
$742,500
$777,500
$622,500
$690,000
$740,000
-
$650,000
$712,500
$645,000
$645,000
-
$475,000
-
$470,000
-
$520,000
$592,608
-
-
-
$335,000
-
161 West 16th Street
N/A
Avg. Price / ft2
Past 12 months
Past 12 months
$1,563
$917
$1,724
$1,266
$1,648
$1,479
$1,569
$1,271
$1,055
$1,694
$1,174
$1,125
$951
$982
-
$984
$1,190
$1,041
$983
-
$808
$607
161 West 16th Street
$1,150,000
Avg. Price
Past 12 months
Past 12 months
$1,248,333
$712,500
$1,477,667
$696,500
$1,442,000
$972,200
$1,435,000
$826,333
$866,600
$995,000
$675,000
$724,500
$763,500
$702,875
-
$687,500
$595,000
$704,439
$565,000
$742,500
$742,000
$438,000
161 West 16th Street
$1,150,000
Median Price
Past 12 months
Past 12 months
$1,250,000
$712,500
$1,395,000
$696,500
$1,442,000
$785,000
$1,435,000
$699,000
$735,000
$995,000
$675,000
$724,500
$763,500
$746,250
-
$642,500
$595,000
$712,000
$565,000
$742,500
$742,000
$461,500
161 West 16th Street
N/A
Avg. Price / ft2
Past 12 months
Past 12 months
-
-
-
-
-
-
-
-
-
-
-
-
-
-
-
-
-
-
-
-
-
-
161 West 16th Street
N/A
Avg. Price
Past 12 months
Past 12 months
-
-
-
-
$1,450,000
-
-
-
$3,755,000
-
$3,250,000
-
-
-
-
$1,775,000
-
-
$3,495,000
$2,050,000
-
$1,465,000
161 West 16th Street
N/A
Median Price
Past 12 months
Past 12 months
-
-
-
-
$1,450,000
-
-
-
$3,755,000
-
$3,250,000
-
-
-
-
$1,775,000
-
-
$3,495,000
$2,050,000
-
$1,465,000
161 West 16th Street
N/A
Avg. Price / ft2
Past 12 months
Past 12 months
-
-
$1,183
-
-
-
-
-
-
-
-
-
-
-
-
-
-
-
-
-
-
-
161 West 16th Street
N/A
Avg. Price
Past 12 months
Past 12 months
-
-
$1,999,999
-
-
-
-
-
-
-
-
-
-
-
-
-
-
-
-
-
-
-
161 West 16th Street
N/A
Median Price
Past 12 months
Past 12 months
-
-
$1,999,999
-
-
-
-
-
-
-
-
-
-
-
-
-
-
-
-
-
-
-
161 West 16th Street
N/A
Avg. Price / ft2
Past 12 months
Past 12 months
-
-
-
-
-
-
-
-
-
-
-
-
-
-
-
-
-
-
-
-
-
-
161 West 16th Street
N/A
Avg. Price
Past 12 months
Past 12 months
-
-
-
-
-
-
-
-
-
-
-
-
-
-
-
-
-
-
-
-
-
-
161 West 16th Street
N/A
Median Price
Past 12 months
Past 12 months
-
-
-
-
-
-
-
-
-
-
-
-
-
-
-
-
-
-
-
-
-
-
161 West 16th Street
N/A
Avg. Price / ft2
Past 12 months
Past 12 months
-
-
-
-
-
-
-
-
-
-
-
-
-
-
-
-
-
-
-
-
-
-
161 West 16th Street
N/A
Avg. Price
Past 12 months
Past 12 months
-
-
-
-
-
-
-
-
-
-
-
-
-
-
-
-
-
-
-
-
-
-
161 West 16th Street
N/A
Median Price
Past 12 months
Past 12 months
-
-
-
-
-
-
-
-
-
-
-
-
-
-
-
-
-
-
-
-
-
-
38 West 26th Street
N/A
Avg. Price / ft2
Past 12 months
Past 12 months
$1,164
$923
-
-
-
$740
-
-
$1,440
-
-
-
-
-
-
$621
-
-
-
-
$517
-
38 West 26th Street
N/A
Avg. Price
Past 12 months
Past 12 months
$6,400,000
$2,552,500
-
-
-
$3,700,000
-
-
$4,320,000
-
-
-
-
-
-
$1,475,000
-
-
-
$2,000,000
$1,550,000
-
38 West 26th Street
N/A
Median Price
Past 12 months
Past 12 months
$6,400,000
$2,552,500
-
-
-
$3,700,000
-
-
$4,320,000
-
-
-
-
-
-
$1,475,000
-
-
-
$2,000,000
$1,550,000
-
38 West 26th Street
N/A
Avg. Price / ft2
Past 12 months
Past 12 months
-
-
-
-
-
-
-
-
-
-
-
-
-
-
-
-
-
-
-
-
-
-
38 West 26th Street
N/A
Avg. Price
Past 12 months
Past 12 months
-
-
-
-
-
-
-
-
-
-
-
-
-
-
-
-
-
-
-
-
-
-
38 West 26th Street
N/A
Median Price
Past 12 months
Past 12 months
-
-
-
-
-
-
-
-
-
-
-
-
-
-
-
-
-
-
-
-
-
-
38 West 26th Street
N/A
Avg. Price / ft2
Past 12 months
Past 12 months
-
-
-
-
-
-
-
-
-
-
-
-
-
-
-
$625
-
-
-
-
-
-
38 West 26th Street
N/A
Avg. Price
Past 12 months
Past 12 months
-
-
-
-
-
-
-
-
-
-
-
-
-
-
-
$1,100,000
-
-
-
-
-
-
38 West 26th Street
N/A
Median Price
Past 12 months
Past 12 months
-
-
-
-
-
-
-
-
-
-
-
-
-
-
-
$1,100,000
-
-
-
-
-
-
38 West 26th Street
N/A
Avg. Price / ft2
Past 12 months
Past 12 months
-
$923
-
-
-
-
-
-
-
-
-
-
-
-
-
$617
-
-
-
-
-
-
38 West 26th Street
N/A
Avg. Price
Past 12 months
Past 12 months
-
$2,552,500
-
-
-
-
-
-
-
-
-
-
-
-
-
$1,850,000
-
-
-
-
-
-
38 West 26th Street
N/A
Median Price
Past 12 months
Past 12 months
-
$2,552,500
-
-
-
-
-
-
-
-
-
-
-
-
-
$1,850,000
-
-
-
-
-
-
38 West 26th Street
N/A
Avg. Price / ft2
Past 12 months
Past 12 months
$1,164
-
-
-
-
-
-
-
$1,440
-
-
-
-
-
-
-
-
-
-
-
$517
-
38 West 26th Street
N/A
Avg. Price
Past 12 months
Past 12 months
$6,400,000
-
-
-
-
-
-
-
$4,320,000
-
-
-
-
-
-
-
-
-
-
-
$1,550,000
-
38 West 26th Street
N/A
Median Price
Past 12 months
Past 12 months
$6,400,000
-
-
-
-
-
-
-
$4,320,000
-
-
-
-
-
-
-
-
-
-
-
$1,550,000
-
38 West 26th Street
N/A
Avg. Price / ft2
Past 12 months
Past 12 months
-
-
-
-
-
-
-
-
-
-
-
-
-
-
-
-
-
-
-
-
-
-
38 West 26th Street
N/A
Avg. Price
Past 12 months
Past 12 months
-
-
-
-
-
-
-
-
-
-
-
-
-
-
-
-
-
-
-
$2,000,000
-
-
38 West 26th Street
N/A
Median Price
Past 12 months
Past 12 months
-
-
-
-
-
-
-
-
-
-
-
-
-
-
-
-
-
-
-
$2,000,000
-
-
38 West 26th Street
N/A
Avg. Price / ft2
Past 12 months
Past 12 months
-
-
-
-
-
$740
-
-
-
-
-
-
-
-
-
-
-
-
-
-
-
-
38 West 26th Street
N/A
Avg. Price
Past 12 months
Past 12 months
-
-
-
-
-
$3,700,000
-
-
-
-
-
-
-
-
-
-
-
-
-
-
-
-
38 West 26th Street
N/A
Median Price
Past 12 months
Past 12 months
-
-
-
-
-
$3,700,000
-
-
-
-
-
-
-
-
-
-
-
-
-
-
-
-
260 West 22nd Street
N/A
Avg. Price / ft2
Past 12 months
Past 12 months
-
-
$1,591
-
-
-
-
-
-
-
$926
-
-
-
-
-
-
-
-
-
$330
-
260 West 22nd Street
N/A
Avg. Price
Past 12 months
Past 12 months
-
-
$1,857,500
-
-
-
$960,000
$1,695,000
-
$778,000
$977,500
-
-
-
-
-
-
$999,000
-
-
$792,000
-
260 West 22nd Street
N/A
Median Price
Past 12 months
Past 12 months
-
-
$2,147,500
-
-
-
$960,000
$1,695,000
-
$778,000
$977,500
-
-
-
-
-
-
$999,000
-
-
$792,000
-
260 West 22nd Street
N/A
Avg. Price / ft2
Past 12 months
Past 12 months
-
-
-
-
-
-
-
-
-
-
-
-
-
-
-
-
-
-
-
-
-
-
260 West 22nd Street
N/A
Avg. Price
Past 12 months
Past 12 months
-
-
$426,000
-
-
-
-
-
-
-
-
-
-
-
-
-
-
-
-
-
-
-
260 West 22nd Street
N/A
Median Price
Past 12 months
Past 12 months
-
-
$426,000
-
-
-
-
-
-
-
-
-
-
-
-
-
-
-
-
-
-
-
260 West 22nd Street
N/A
Avg. Price / ft2
Past 12 months
Past 12 months
-
-
-
-
-
-
-
-
-
-
-
-
-
-
-
-
-
-
-
-
-
-
260 West 22nd Street
N/A
Avg. Price
Past 12 months
Past 12 months
-
-
-
-
-
-
$960,000
$730,000
-
$778,000
$705,000
-
-
-
-
-
-
$999,000
-
-
$859,000
-
260 West 22nd Street
N/A
Median Price
Past 12 months
Past 12 months
-
-
-
-
-
-
$960,000
$730,000
-
$778,000
$705,000
-
-
-
-
-
-
$999,000
-
-
$859,000
-
260 West 22nd Street
N/A
Avg. Price / ft2
Past 12 months
Past 12 months
-
-
$1,591
-
-
-
-
-
-
-
$926
-
-
-
-
-
-
-
-
-
-
-
260 West 22nd Street
N/A
Avg. Price
Past 12 months
Past 12 months
-
-
$2,147,500
-
-
-
-
-
-
-
$1,250,000
-
-
-
-
-
-
-
-
-
-
-
260 West 22nd Street
N/A
Median Price
Past 12 months
Past 12 months
-
-
$2,147,500
-
-
-
-
-
-
-
$1,250,000
-
-
-
-
-
-
-
-
-
-
-
260 West 22nd Street
N/A
Avg. Price / ft2
Past 12 months
Past 12 months
-
-
-
-
-
-
-
-
-
-
-
-
-
-
-
-
-
-
-
-
$330
-
260 West 22nd Street
N/A
Avg. Price
Past 12 months
Past 12 months
-
-
$2,999,000
-
-
-
-
$2,660,000
-
-
-
-
-
-
-
-
-
-
-
-
$725,000
-
260 West 22nd Street
N/A
Median Price
Past 12 months
Past 12 months
-
-
$2,999,000
-
-
-
-
$2,660,000
-
-
-
-
-
-
-
-
-
-
-
-
$725,000
-
260 West 22nd Street
N/A
Avg. Price / ft2
Past 12 months
Past 12 months
-
-
-
-
-
-
-
-
-
-
-
-
-
-
-
-
-
-
-
-
-
-
260 West 22nd Street
N/A
Avg. Price
Past 12 months
Past 12 months
-
-
-
-
-
-
-
-
-
-
-
-
-
-
-
-
-
-
-
-
-
-
260 West 22nd Street
N/A
Median Price
Past 12 months
Past 12 months
-
-
-
-
-
-
-
-
-
-
-
-
-
-
-
-
-
-
-
-
-
-
260 West 22nd Street
N/A
Avg. Price / ft2
Past 12 months
Past 12 months
-
-
-
-
-
-
-
-
-
-
-
-
-
-
-
-
-
-
-
-
-
-
260 West 22nd Street
N/A
Avg. Price
Past 12 months
Past 12 months
-
-
-
-
-
-
-
-
-
-
-
-
-
-
-
-
-
-
-
-
-
-
260 West 22nd Street
N/A
Median Price
Past 12 months
Past 12 months
-
-
-
-
-
-
-
-
-
-
-
-
-
-
-
-
-
-
-
-
-
-
205 West 19th Street
N/A
Avg. Price / ft2
Past 12 months
Past 12 months
-
-
-
-
-
-
-
-
-
-
-
-
$1,071
-
-
-
-
-
-
-
-
-
205 West 19th Street
N/A
Avg. Price
Past 12 months
Past 12 months
-
-
-
-
-
-
$4,000,000
-
$5,000,000
-
-
-
$3,650,000
-
-
-
$8,500,000
$6,567,712
$5,475,000
-
$1,755,000
$1,295,000
205 West 19th Street
N/A
Median Price
Past 12 months
Past 12 months
-
-
-
-
-
-
$4,000,000
-
$5,000,000
-
-
-
$3,650,000
-
-
-
$8,500,000
$6,567,712
$5,475,000
-
$1,280,000
$1,295,000
205 West 19th Street
N/A
Avg. Price / ft2
Past 12 months
Past 12 months
-
-
-
-
-
-
-
-
-
-
-
-
-
-
-
-
-
-
-
-
-
-
205 West 19th Street
N/A
Avg. Price
Past 12 months
Past 12 months
-
-
-
-
-
-
-
-
-
-
-
-
-
-
-
-
-
-
-
-
-
-
205 West 19th Street
N/A
Median Price
Past 12 months
Past 12 months
-
-
-
-
-
-
-
-
-
-
-
-
-
-
-
-
-
-
-
-
-
-
205 West 19th Street
N/A
Avg. Price / ft2
Past 12 months
Past 12 months
-
-
-
-
-
-
-
-
-
-
-
-
-
-
-
-
-
-
-
-
-
-
205 West 19th Street
N/A
Avg. Price
Past 12 months
Past 12 months
-
-
-
-
-
-
-
-
-
-
-
-
-
-
-
-
-
-
-
-
$1,275,000
-
205 West 19th Street
N/A
Median Price
Past 12 months
Past 12 months
-
-
-
-
-
-
-
-
-
-
-
-
-
-
-
-
-
-
-
-
$1,275,000
-
205 West 19th Street
N/A
Avg. Price / ft2
Past 12 months
Past 12 months
-
-
-
-
-
-
-
-
-
-
-
-
-
-
-
-
-
-
-
-
-
-
205 West 19th Street
N/A
Avg. Price
Past 12 months
Past 12 months
-
-
-
-
-
-
-
-
-
-
-
-
-
-
-
-
-
-
-
-
$1,251,667
$1,295,000
205 West 19th Street
N/A
Median Price
Past 12 months
Past 12 months
-
-
-
-
-
-
-
-
-
-
-
-
-
-
-
-
-
-
-
-
$1,280,000
$1,295,000
205 West 19th Street
N/A
Avg. Price / ft2
Past 12 months
Past 12 months
-
-
-
-
-
-
-
-
-
-
-
-
-
-
-
-
-
-
-
-
-
-
205 West 19th Street
N/A
Avg. Price
Past 12 months
Past 12 months
-
-
-
-
-
-
$4,000,000
-
$5,000,000
-
-
-
-
-
-
-
-
$6,567,712
-
-
-
-
205 West 19th Street
N/A
Median Price
Past 12 months
Past 12 months
-
-
-
-
-
-
$4,000,000
-
$5,000,000
-
-
-
-
-
-
-
-
$6,567,712
-
-
-
-
205 West 19th Street
N/A
Avg. Price / ft2
Past 12 months
Past 12 months
-
-
-
-
-
-
-
-
-
-
-
-
$1,071
-
-
-
-
-
-
-
-
-
205 West 19th Street
N/A
Avg. Price
Past 12 months
Past 12 months
-
-
-
-
-
-
-
-
-
-
-
-
$3,650,000
-
-
-
$8,500,000
-
$5,475,000
-
$3,745,000
-
205 West 19th Street
N/A
Median Price
Past 12 months
Past 12 months
-
-
-
-
-
-
-
-
-
-
-
-
$3,650,000
-
-
-
$8,500,000
-
$5,475,000
-
$3,745,000
-
205 West 19th Street
N/A
Avg. Price / ft2
Past 12 months
Past 12 months
-
-
-
-
-
-
-
-
-
-
-
-
-
-
-
-
-
-
-
-
-
-
205 West 19th Street
N/A
Avg. Price
Past 12 months
Past 12 months
-
-
-
-
-
-
-
-
-
-
-
-
-
-
-
-
-
-
-
-
-
-
205 West 19th Street
N/A
Median Price
Past 12 months
Past 12 months
-
-
-
-
-
-
-
-
-
-
-
-
-
-
-
-
-
-
-
-
-
-
Chelsea Court
N/A
Avg. Price / ft2
Past 12 months
Past 12 months
-
-
$1,200
$1,400
-
$1,145
-
-
$1,183
-
-
$739
$982
$886
$1,025
-
$907
-
$418
-
-
$607
Chelsea Court
$750,000
Avg. Price
Past 12 months
Past 12 months
$590,000
-
$720,000
$700,000
-
$630,000
$771,000
$633,926
$595,658
$665,250
$615,000
$493,125
$735,500
$500,000
$512,500
$460,000
$437,000
$461,667
$524,167
$459,000
$465,500
$396,333
Chelsea Court
$750,000
Median Price
Past 12 months
Past 12 months
$590,000
-
$720,000
$700,000
-
$630,000
$771,000
$640,000
$665,000
$665,250
$615,000
$496,250
$561,500
$507,500
$512,500
$460,000
$437,000
$470,000
$520,000
$459,000
$465,500
$385,000
Chelsea Court
N/A
Avg. Price / ft2
Past 12 months
Past 12 months
-
-
-
-
-
$1,145
-
-
-
-
-
$739
-
-
-
-
$907
-
-
-
-
-
Chelsea Court
N/A
Avg. Price
Past 12 months
Past 12 months
$450,000
-
-
-
-
$630,000
-
-
$441,975
-
-
$260,000
-
$275,000
-
-
$437,000
$325,000
-
-
-
-
Chelsea Court
N/A
Median Price
Past 12 months
Past 12 months
$450,000
-
-
-
-
$630,000
-
-
$441,975
-
-
$260,000
-
$275,000
-
-
$437,000
$325,000
-
-
-
-
Chelsea Court
N/A
Avg. Price / ft2
Past 12 months
Past 12 months
-
-
$1,200
$1,400
-
-
-
-
$1,183
-
-
-
-
$886
$1,025
-
-
-
-
-
-
$607
Chelsea Court
$750,000
Avg. Price
Past 12 months
Past 12 months
$730,000
-
$720,000
$700,000
-
-
$771,000
$633,926
$672,500
$665,250
$615,000
$570,833
$522,333
$545,000
$512,500
$460,000
-
$530,000
$493,750
$459,000
$465,500
$396,333
Chelsea Court
$750,000
Median Price
Past 12 months
Past 12 months
$730,000
-
$720,000
$700,000
-
-
$771,000
$640,000
$672,500
$665,250
$615,000
$515,000
$495,500
$525,000
$512,500
$460,000
-
$530,000
$493,750
$459,000
$465,500
$385,000
Chelsea Court
N/A
Avg. Price / ft2
Past 12 months
Past 12 months
-
-
-
-
-
-
-
-
-
-
-
-
$982
-
-
-
-
-
$418
-
-
-
Chelsea Court
N/A
Avg. Price
Past 12 months
Past 12 months
-
-
-
-
-
-
-
-
-
-
-
-
$1,375,000
-
-
-
-
-
$585,000
-
-
-
Chelsea Court
N/A
Median Price
Past 12 months
Past 12 months
-
-
-
-
-
-
-
-
-
-
-
-
$1,375,000
-
-
-
-
-
$585,000
-
-
-
Chelsea Court
N/A
Avg. Price / ft2
Past 12 months
Past 12 months
-
-
-
-
-
-
-
-
-
-
-
-
-
-
-
-
-
-
-
-
-
-
Chelsea Court
N/A
Avg. Price
Past 12 months
Past 12 months
-
-
-
-
-
-
-
-
-
-
-
-
-
-
-
-
-
-
-
-
-
-
Chelsea Court
N/A
Median Price
Past 12 months
Past 12 months
-
-
-
-
-
-
-
-
-
-
-
-
-
-
-
-
-
-
-
-
-
-
Chelsea Court
N/A
Avg. Price / ft2
Past 12 months
Past 12 months
-
-
-
-
-
-
-
-
-
-
-
-
-
-
-
-
-
-
-
-
-
-
Chelsea Court
N/A
Avg. Price
Past 12 months
Past 12 months
-
-
-
-
-
-
-
-
-
-
-
-
-
-
-
-
-
-
-
-
-
-
Chelsea Court
N/A
Median Price
Past 12 months
Past 12 months
-
-
-
-
-
-
-
-
-
-
-
-
-
-
-
-
-
-
-
-
-
-
The Hamilton
$730
Avg. Price / ft2
Past 12 months
Past 12 months
$730
-
-
-
-
-
-
-
-
-
-
-
-
-
-
-
-
-
-
-
-
-
The Hamilton
$365,000
Avg. Price
Past 12 months
Past 12 months
$415,000
$515,000
-
-
$380,000
-
$496,750
$520,000
-
-
$380,350
$475,666
$385,517
-
-
-
-
-
-
-
-
-
The Hamilton
$365,000
Median Price
Past 12 months
Past 12 months
$415,000
$515,000
-
-
$380,000
-
$496,750
$520,000
-
-
$380,350
$475,666
$399,000
-
-
-
-
-
-
-
-
-
The Hamilton
N/A
Avg. Price / ft2
Past 12 months
Past 12 months
-
-
-
-
-
-
-
-
-
-
-
-
-
-
-
-
-
-
-
-
-
-
The Hamilton
N/A
Avg. Price
Past 12 months
Past 12 months
-
-
-
-
-
-
-
-
-
-
-
-
-
-
-
-
-
-
-
-
-
-
The Hamilton
N/A
Median Price
Past 12 months
Past 12 months
-
-
-
-
-
-
-
-
-
-
-
-
-
-
-
-
-
-
-
-
-
-
The Hamilton
$730
Avg. Price / ft2
Past 12 months
Past 12 months
$730
-
-
-
-
-
-
-
-
-
-
-
-
-
-
-
-
-
-
-
-
-
The Hamilton
$365,000
Avg. Price
Past 12 months
Past 12 months
$415,000
$515,000
-
-
$380,000
-
$496,750
$520,000
-
-
-
$475,666
$385,517
-
-
-
-
-
-
-
-
-
The Hamilton
$365,000
Median Price
Past 12 months
Past 12 months
$415,000
$515,000
-
-
$380,000
-
$496,750
$520,000
-
-
-
$475,666
$399,000
-
-
-
-
-
-
-
-
-
The Hamilton
N/A
Avg. Price / ft2
Past 12 months
Past 12 months
-
-
-
-
-
-
-
-
-
-
-
-
-
-
-
-
-
-
-
-
-
-
The Hamilton
N/A
Avg. Price
Past 12 months
Past 12 months
-
-
-
-
-
-
-
-
-
-
-
-
-
-
-
-
-
-
-
-
-
-
The Hamilton
N/A
Median Price
Past 12 months
Past 12 months
-
-
-
-
-
-
-
-
-
-
-
-
-
-
-
-
-
-
-
-
-
-
The Hamilton
N/A
Avg. Price / ft2
Past 12 months
Past 12 months
-
-
-
-
-
-
-
-
-
-
-
-
-
-
-
-
-
-
-
-
-
-
The Hamilton
N/A
Avg. Price
Past 12 months
Past 12 months
-
-
-
-
-
-
-
-
-
-
-
-
-
-
-
-
-
-
-
-
-
-
The Hamilton
N/A
Median Price
Past 12 months
Past 12 months
-
-
-
-
-
-
-
-
-
-
-
-
-
-
-
-
-
-
-
-
-
-
Kensington House
$937
Avg. Price / ft2
Past 12 months
Past 12 months
$1,075
$1,185
$1,059
$1,012
$1,091
$1,075
$1,026
$1,222
$1,070
$878
$984
$964
$758
$781
$810
$468
$951
$794
$778
$915
$570
$493
Kensington House
$546,667
Avg. Price
Past 12 months
Past 12 months
$546,667
$1,185,000
$499,750
$614,000
$600,000
$590,425
$508,900
$713,250
$672,209
$511,875
$575,771
$522,000
$367,250
$571,500
$394,000
$222,066
$468,250
$487,996
$441,667
$501,917
$262,500
$233,642
Kensington House
$515,000
Median Price
Past 12 months
Past 12 months
$557,500
$1,185,000
$499,750
$560,000
$600,000
$513,625
$505,000
$595,000
$520,000
$477,500
$503,000
$475,000
$369,500
$410,000
$390,000
$222,066
$464,000
$418,241
$385,000
$423,752
$267,500
$220,000
Kensington House
$937
Avg. Price / ft2
Past 12 months
Past 12 months
$1,069
-
$1,059
$1,009
$1,091
$995
$1,026
$1,188
$1,070
$878
$993
$916
$758
$781
$810
$468
$951
$794
$770
$915
$570
$493
Kensington House
$486,000
Avg. Price
Past 12 months
Past 12 months
$546,000
-
$499,750
$511,250
$600,000
$499,906
$508,900
$564,156
$511,511
$474,286
$490,100
$464,000
$367,250
$392,500
$394,000
$222,066
$478,333
$405,661
$375,000
$435,376
$262,500
$231,500
Kensington House
$510,000
Median Price
Past 12 months
Past 12 months
$565,000
-
$499,750
$512,500
$600,000
$509,313
$505,000
$582,500
$501,000
$460,000
$490,500
$457,500
$369,500
$390,000
$390,000
$222,066
$490,000
$389,000
$375,000
$423,752
$267,500
$220,000
Kensington House
N/A
Avg. Price / ft2
Past 12 months
Past 12 months
$1,104
$1,185
-
$1,025
-
$1,314
-
$1,355
-
-
$967
$1,200
-
-
-
-
-
-
$793
-
-
-
Kensington House
$850,000
Avg. Price
Past 12 months
Past 12 months
$550,000
$1,185,000
-
$1,025,000
-
$952,500
-
$1,110,833
-
$775,000
$725,000
$870,000
-
-
-
-
-
$735,000
$575,000
$955,000
-
-
Kensington House
$850,000
Median Price
Past 12 months
Past 12 months
$550,000
$1,185,000
-
$1,025,000
-
$952,500
-
$1,050,000
-
$775,000
$725,000
$870,000
-
-
-
-
-
$735,000
$575,000
$955,000
-
-
Kensington House
N/A
Avg. Price / ft2
Past 12 months
Past 12 months
-
-
-
-
-
-
-
-
-
-
-
-
-
-
-
-
-
-
-
-
-
-
Kensington House
N/A
Avg. Price
Past 12 months
Past 12 months
-
-
-
-
-
-
-
-
$1,315,000
-
-
-
-
-
-
-
-
-
-
-
-
-
Kensington House
N/A
Median Price
Past 12 months
Past 12 months
-
-
-
-
-
-
-
-
$1,315,000
-
-
-
-
-
-
-
-
-
-
-
-
-
Kensington House
N/A
Avg. Price / ft2
Past 12 months
Past 12 months
-
-
-
-
-
-
-
-
-
-
-
-
-
-
-
-
-
-
-
-
-
-
Kensington House
N/A
Avg. Price
Past 12 months
Past 12 months
-
-
-
-
-
-
-
-
-
-
-
-
-
-
-
-
-
-
-
-
-
-
Kensington House
N/A
Median Price
Past 12 months
Past 12 months
-
-
-
-
-
-
-
-
-
-
-
-
-
-
-
-
-
-
-
-
-
-
Kensington House
N/A
Avg. Price / ft2
Past 12 months
Past 12 months
-
-
-
-
-
-
-
-
-
-
-
-
-
-
-
-
-
-
-
-
-
-
Kensington House
N/A
Avg. Price
Past 12 months
Past 12 months
-
-
-
-
-
-
-
-
-
-
-
-
-
-
-
-
-
-
-
-
-
-
Kensington House
N/A
Median Price
Past 12 months
Past 12 months
-
-
-
-
-
-
-
-
-
-
-
-
-
-
-
-
-
-
-
-
-
-
The Piermont
$1,047
Avg. Price / ft2
Past 12 months
Past 12 months
$1,060
$1,081
$1,173
$963
$1,168
$1,084
$1,208
$1,188
$1,416
$1,038
$1,034
$1,033
$931
$814
$898
$913
$1,033
$888
$855
$821
$688
$545
The Piermont
$506,739
Avg. Price
Past 12 months
Past 12 months
$546,418
$454,500
$1,072,250
$569,333
$638,333
$498,143
$834,200
$541,643
$587,889
$576,250
$483,931
$484,636
$424,417
$401,967
$397,125
$445,000
$475,000
$444,050
$401,000
$396,750
$329,438
$330,083
The Piermont
$449,000
Median Price
Past 12 months
Past 12 months
$550,000
$434,500
$772,500
$565,000
$585,000
$486,000
$825,000
$505,000
$565,000
$505,000
$495,000
$470,000
$402,250
$393,400
$398,500
$445,000
$490,000
$414,500
$370,000
$420,000
$327,500
$355,250
The Piermont
$1,120
Avg. Price / ft2
Past 12 months
Past 12 months
$1,080
$1,081
$1,228
$796
$1,238
$1,084
$1,242
$1,188
-
$1,038
$878
$1,012
$931
$814
$864
$913
$1,009
$875
$855
$756
$717
$675
The Piermont
$465,362
Avg. Price
Past 12 months
Past 12 months
$550,223
$454,500
$524,500
$398,000
$572,500
$498,143
$590,000
$523,583
$513,000
$407,500
$372,500
$447,850
$396,900
$401,967
$362,833
$480,000
$464,000
$380,625
$401,000
$374,800
$312,214
$270,000
The Piermont
$447,000
Median Price
Past 12 months
Past 12 months
$565,000
$434,500
$524,500
$398,000
$572,500
$486,000
$590,000
$490,000
$530,000
$407,500
$372,500
$449,500
$383,500
$393,400
$337,000
$480,000
$490,000
$392,500
$370,000
$359,000
$325,000
$270,000
The Piermont
$944
Avg. Price / ft2
Past 12 months
Past 12 months
$1,019
-
-
$1,130
$1,027
-
$1,173
-
$1,416
-
$1,190
$1,137
-
-
$1,000
-
$1,156
$930
-
$887
$600
$480
The Piermont
$755,000
Avg. Price
Past 12 months
Past 12 months
$535,000
-
-
$655,000
$770,000
-
$895,250
$650,000
$681,500
$745,000
$595,363
$852,500
$562,000
-
$500,000
$410,000
$520,000
$697,750
-
$433,333
$450,000
$360,125
The Piermont
$755,000
Median Price
Past 12 months
Past 12 months
$535,000
-
-
$655,000
$770,000
-
$852,500
$650,000
$600,500
$745,000
$595,363
$852,500
$562,000
-
$500,000
$410,000
$520,000
$697,750
-
$420,000
$450,000
$360,125
The Piermont
N/A
Avg. Price / ft2
Past 12 months
Past 12 months
-
-
$859
-
-
-
-
-
-
-
-
-
-
-
-
-
-
-
-
-
-
-
The Piermont
N/A
Avg. Price
Past 12 months
Past 12 months
-
-
$945,000
-
-
-
-
-
-
-
-
-
-
-
-
-
-
-
-
-
-
-
The Piermont
N/A
Median Price
Past 12 months
Past 12 months
-
-
$945,000
-
-
-
-
-
-
-
-
-
-
-
-
-
-
-
-
-
-
-
The Piermont
N/A
Avg. Price / ft2
Past 12 months
Past 12 months
-
-
-
-
-
-
-
-
-
-
-
-
-
-
-
-
-
-
-
-
-
-
The Piermont
N/A
Avg. Price
Past 12 months
Past 12 months
-
-
-
-
-
-
-
-
-
-
-
-
-
-
-
-
$485,000
-
-
-
-
-
The Piermont
N/A
Median Price
Past 12 months
Past 12 months
-
-
-
-
-
-
-
-
-
-
-
-
-
-
-
-
$485,000
-
-
-
-
-
The Piermont
N/A
Avg. Price / ft2
Past 12 months
Past 12 months
-
-
$1,378
-
-
-
-
-
-
-
-
-
-
-
-
-
-
-
-
-
-
-
The Piermont
N/A
Avg. Price
Past 12 months
Past 12 months
-
-
$2,295,000
-
-
-
-
-
-
-
-
-
-
-
-
-
-
-
-
-
-
-
The Piermont
N/A
Median Price
Past 12 months
Past 12 months
-
-
$2,295,000
-
-
-
-
-
-
-
-
-
-
-
-
-
-
-
-
-
-
-
The Piermont
N/A
Avg. Price / ft2
Past 12 months
Past 12 months
-
-
-
-
-
-
-
-
-
-
-
-
-
-
-
-
-
-
-
-
-
-
The Piermont
N/A
Avg. Price
Past 12 months
Past 12 months
-
-
-
-
-
-
-
-
-
-
-
-
-
-
-
-
-
-
-
-
-
-
The Piermont
N/A
Median Price
Past 12 months
Past 12 months
-
-
-
-
-
-
-
-
-
-
-
-
-
-
-
-
-
-
-
-
-
-