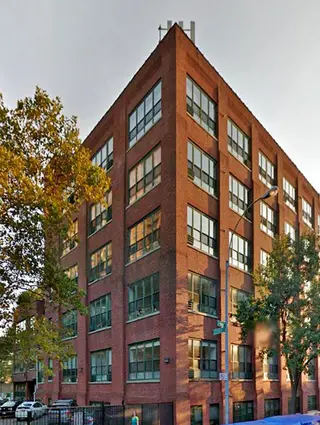
Clinton Mews, 372 DeKalb Avenue: Price Comparison
between Grand Avenue & Steuben Street Building Profile
Clinton Mews
$1,172,500
Avg. Price
Past 12 months
Past 12 months
2024
-
2023
$963,333
2022
$914,883
2021
$971,200
2020
$752,500
2019
$975,000
2018
$742,750
2017
$611,500
2016
$789,167
2015
$670,250
2014
$832,500
2013
$562,000
2012
$480,000
2011
$475,000
2010
-
2009
$404,586
2008
$389,625
2007
$507,232
2006
$746,827
2005
$410,496
2004
$290,000
2003
$299,000
Clinton Mews
$1,172,500
Median Price
Past 12 months
Past 12 months
2024
-
2023
$950,000
2022
$885,000
2021
$885,000
2020
$752,500
2019
$975,000
2018
$730,000
2017
$611,500
2016
$815,000
2015
$680,500
2014
$832,500
2013
$592,500
2012
$515,000
2011
$475,000
2010
-
2009
$404,586
2008
$380,000
2007
$503,900
2006
$511,699
2005
$399,000
2004
$290,000
2003
$299,000
Clinton Mews
N/A
Avg. Price
Past 12 months
Past 12 months
2024
-
2023
-
2022
-
2021
-
2020
-
2019
-
2018
-
2017
-
2016
-
2015
-
2014
-
2013
-
2012
-
2011
-
2010
-
2009
-
2008
-
2007
-
2006
-
2005
-
2004
-
2003
-
Clinton Mews
N/A
Median Price
Past 12 months
Past 12 months
2024
-
2023
-
2022
-
2021
-
2020
-
2019
-
2018
-
2017
-
2016
-
2015
-
2014
-
2013
-
2012
-
2011
-
2010
-
2009
-
2008
-
2007
-
2006
-
2005
-
2004
-
2003
-
Clinton Mews
$1,070,000
Avg. Price
Past 12 months
Past 12 months
2024
-
2023
$970,000
2022
$930,000
2021
$995,500
2020
$655,000
2019
-
2018
$742,750
2017
$611,500
2016
$761,786
2015
$611,000
2014
$815,000
2013
$446,000
2012
$400,000
2011
$475,000
2010
-
2009
$404,586
2008
$389,625
2007
$494,896
2006
$838,946
2005
$393,976
2004
$290,000
2003
$299,000
Clinton Mews
$1,070,000
Median Price
Past 12 months
Past 12 months
2024
-
2023
$970,000
2022
$930,000
2021
$890,000
2020
$655,000
2019
-
2018
$730,000
2017
$611,500
2016
$745,000
2015
$611,000
2014
$815,000
2013
$446,000
2012
$400,000
2011
$475,000
2010
-
2009
$404,586
2008
$380,000
2007
$515,000
2006
$475,000
2005
$399,000
2004
$290,000
2003
$299,000
Clinton Mews
$1,275,000
Avg. Price
Past 12 months
Past 12 months
2024
-
2023
$950,000
2022
$884,650
2021
$874,000
2020
$850,000
2019
$975,000
2018
-
2017
-
2016
$885,000
2015
$729,500
2014
$850,000
2013
$620,000
2012
$520,000
2011
-
2010
-
2009
-
2008
-
2007
$549,542
2006
$573,533
2005
$431,147
2004
-
2003
-
Clinton Mews
$1,275,000
Median Price
Past 12 months
Past 12 months
2024
-
2023
$950,000
2022
$884,650
2021
$874,000
2020
$850,000
2019
$975,000
2018
-
2017
-
2016
$885,000
2015
$729,500
2014
$850,000
2013
$622,500
2012
$520,000
2011
-
2010
-
2009
-
2008
-
2007
$552,130
2006
$541,689
2005
$437,294
2004
-
2003
-
Clinton Mews
N/A
Avg. Price
Past 12 months
Past 12 months
2024
-
2023
-
2022
-
2021
-
2020
-
2019
-
2018
-
2017
-
2016
-
2015
-
2014
-
2013
-
2012
-
2011
-
2010
-
2009
-
2008
-
2007
-
2006
-
2005
-
2004
-
2003
-
Clinton Mews
N/A
Median Price
Past 12 months
Past 12 months
2024
-
2023
-
2022
-
2021
-
2020
-
2019
-
2018
-
2017
-
2016
-
2015
-
2014
-
2013
-
2012
-
2011
-
2010
-
2009
-
2008
-
2007
-
2006
-
2005
-
2004
-
2003
-
Clinton Mews
N/A
Avg. Price
Past 12 months
Past 12 months
2024
-
2023
-
2022
-
2021
-
2020
-
2019
-
2018
-
2017
-
2016
-
2015
-
2014
-
2013
-
2012
-
2011
-
2010
-
2009
-
2008
-
2007
-
2006
-
2005
-
2004
-
2003
-
Clinton Mews
N/A
Median Price
Past 12 months
Past 12 months
2024
-
2023
-
2022
-
2021
-
2020
-
2019
-
2018
-
2017
-
2016
-
2015
-
2014
-
2013
-
2012
-
2011
-
2010
-
2009
-
2008
-
2007
-
2006
-
2005
-
2004
-
2003
-
Copper House
N/A
Avg. Price / ft2
Past 12 months
Past 12 months
-
-
-
$1,040
-
-
-
-
$841
-
-
-
-
-
-
-
-
-
-
-
-
-
Copper House
N/A
Avg. Price
Past 12 months
Past 12 months
-
-
-
$1,725,000
-
-
-
-
$1,263,695
-
-
-
-
-
-
-
-
-
-
-
-
-
Copper House
N/A
Median Price
Past 12 months
Past 12 months
-
-
-
$1,725,000
-
-
-
-
$1,333,908
-
-
-
-
-
-
-
-
-
-
-
-
-
Copper House
N/A
Avg. Price / ft2
Past 12 months
Past 12 months
-
-
-
-
-
-
-
-
-
-
-
-
-
-
-
-
-
-
-
-
-
-
Copper House
N/A
Avg. Price
Past 12 months
Past 12 months
-
-
-
-
-
-
-
-
-
-
-
-
-
-
-
-
-
-
-
-
-
-
Copper House
N/A
Median Price
Past 12 months
Past 12 months
-
-
-
-
-
-
-
-
-
-
-
-
-
-
-
-
-
-
-
-
-
-
Copper House
N/A
Avg. Price / ft2
Past 12 months
Past 12 months
-
-
-
-
-
-
-
-
$819
-
-
-
-
-
-
-
-
-
-
-
-
-
Copper House
N/A
Avg. Price
Past 12 months
Past 12 months
-
-
-
-
-
-
-
-
$1,162,403
-
-
-
-
-
-
-
-
-
-
-
-
-
Copper House
N/A
Median Price
Past 12 months
Past 12 months
-
-
-
-
-
-
-
-
$1,153,169
-
-
-
-
-
-
-
-
-
-
-
-
-
Copper House
N/A
Avg. Price / ft2
Past 12 months
Past 12 months
-
-
-
$1,040
-
-
-
-
$884
-
-
-
-
-
-
-
-
-
-
-
-
-
Copper House
N/A
Avg. Price
Past 12 months
Past 12 months
-
-
-
$1,725,000
-
-
-
-
$1,466,281
-
-
-
-
-
-
-
-
-
-
-
-
-
Copper House
N/A
Median Price
Past 12 months
Past 12 months
-
-
-
$1,725,000
-
-
-
-
$1,466,281
-
-
-
-
-
-
-
-
-
-
-
-
-
Copper House
N/A
Avg. Price / ft2
Past 12 months
Past 12 months
-
-
-
-
-
-
-
-
-
-
-
-
-
-
-
-
-
-
-
-
-
-
Copper House
N/A
Avg. Price
Past 12 months
Past 12 months
-
-
-
-
-
-
-
-
-
-
-
-
-
-
-
-
-
-
-
-
-
-
Copper House
N/A
Median Price
Past 12 months
Past 12 months
-
-
-
-
-
-
-
-
-
-
-
-
-
-
-
-
-
-
-
-
-
-
Copper House
N/A
Avg. Price / ft2
Past 12 months
Past 12 months
-
-
-
-
-
-
-
-
-
-
-
-
-
-
-
-
-
-
-
-
-
-
Copper House
N/A
Avg. Price
Past 12 months
Past 12 months
-
-
-
-
-
-
-
-
-
-
-
-
-
-
-
-
-
-
-
-
-
-
Copper House
N/A
Median Price
Past 12 months
Past 12 months
-
-
-
-
-
-
-
-
-
-
-
-
-
-
-
-
-
-
-
-
-
-
Clinton Hill Cooperatives
N/A
Avg. Price / ft2
Past 12 months
Past 12 months
$1,200
-
-
-
$988
-
-
$833
-
-
-
-
-
$662
-
$692
-
-
$559
-
-
-
Clinton Hill Cooperatives
N/A
Avg. Price
Past 12 months
Past 12 months
$1,195,000
-
-
-
$1,185,000
-
-
$999,000
-
-
-
-
-
$645,000
-
$830,126
-
-
$545,000
-
-
-
Clinton Hill Cooperatives
N/A
Median Price
Past 12 months
Past 12 months
$1,195,000
-
-
-
$1,185,000
-
-
$999,000
-
-
-
-
-
$645,000
-
$830,126
-
-
$545,000
-
-
-
Clinton Hill Cooperatives
N/A
Avg. Price / ft2
Past 12 months
Past 12 months
-
-
-
-
-
-
-
-
-
-
-
-
-
-
-
-
-
-
-
-
-
-
Clinton Hill Cooperatives
N/A
Avg. Price
Past 12 months
Past 12 months
-
-
-
-
-
-
-
-
-
-
-
-
-
-
-
-
-
-
-
-
-
-
Clinton Hill Cooperatives
N/A
Median Price
Past 12 months
Past 12 months
-
-
-
-
-
-
-
-
-
-
-
-
-
-
-
-
-
-
-
-
-
-
Clinton Hill Cooperatives
N/A
Avg. Price / ft2
Past 12 months
Past 12 months
-
-
-
-
$988
-
-
$833
-
-
-
-
-
-
-
$692
-
-
-
-
-
-
Clinton Hill Cooperatives
N/A
Avg. Price
Past 12 months
Past 12 months
-
-
-
-
$1,185,000
-
-
$999,000
-
-
-
-
-
-
-
$830,126
-
-
-
-
-
-
Clinton Hill Cooperatives
N/A
Median Price
Past 12 months
Past 12 months
-
-
-
-
$1,185,000
-
-
$999,000
-
-
-
-
-
-
-
$830,126
-
-
-
-
-
-
Clinton Hill Cooperatives
N/A
Avg. Price / ft2
Past 12 months
Past 12 months
$1,200
-
-
-
-
-
-
-
-
-
-
-
-
$662
-
-
-
-
$559
-
-
-
Clinton Hill Cooperatives
N/A
Avg. Price
Past 12 months
Past 12 months
$1,195,000
-
-
-
-
-
-
-
-
-
-
-
-
$645,000
-
-
-
-
$545,000
-
-
-
Clinton Hill Cooperatives
N/A
Median Price
Past 12 months
Past 12 months
$1,195,000
-
-
-
-
-
-
-
-
-
-
-
-
$645,000
-
-
-
-
$545,000
-
-
-
Clinton Hill Cooperatives
N/A
Avg. Price / ft2
Past 12 months
Past 12 months
-
-
-
-
-
-
-
-
-
-
-
-
-
-
-
-
-
-
-
-
-
-
Clinton Hill Cooperatives
N/A
Avg. Price
Past 12 months
Past 12 months
-
-
-
-
-
-
-
-
-
-
-
-
-
-
-
-
-
-
-
-
-
-
Clinton Hill Cooperatives
N/A
Median Price
Past 12 months
Past 12 months
-
-
-
-
-
-
-
-
-
-
-
-
-
-
-
-
-
-
-
-
-
-
Clinton Hill Cooperatives
N/A
Avg. Price / ft2
Past 12 months
Past 12 months
-
-
-
-
-
-
-
-
-
-
-
-
-
-
-
-
-
-
-
-
-
-
Clinton Hill Cooperatives
N/A
Avg. Price
Past 12 months
Past 12 months
-
-
-
-
-
-
-
-
-
-
-
-
-
-
-
-
-
-
-
-
-
-
Clinton Hill Cooperatives
N/A
Median Price
Past 12 months
Past 12 months
-
-
-
-
-
-
-
-
-
-
-
-
-
-
-
-
-
-
-
-
-
-
Willoughby Walk
$713
Avg. Price / ft2
Past 12 months
Past 12 months
$999
-
$739
$720
$669
$745
$625
$721
$606
$586
$505
$500
-
-
-
$413
$401
$389
$451
$380
$189
$201
Willoughby Walk
$503,167
Avg. Price
Past 12 months
Past 12 months
$999,000
-
$540,429
$525,600
$482,500
$503,500
$392,000
$455,167
$485,722
$470,000
$423,929
$325,000
-
-
-
$229,250
$360,269
$351,400
$327,250
$250,875
$138,333
$192,800
Willoughby Walk
$512,000
Median Price
Past 12 months
Past 12 months
$999,000
-
$510,000
$488,000
$297,500
$450,000
$392,000
$440,000
$485,000
$420,000
$362,000
$325,000
-
-
-
$226,500
$422,500
$300,000
$287,500
$225,000
$128,500
$196,500
Willoughby Walk
N/A
Avg. Price / ft2
Past 12 months
Past 12 months
-
-
$816
$763
$639
$674
$598
$750
-
$533
$543
-
-
-
-
$413
$450
$513
-
$435
$189
-
Willoughby Walk
N/A
Avg. Price
Past 12 months
Past 12 months
-
-
$344,000
$305,000
$286,250
$291,667
$299,000
$300,000
$273,500
$240,000
$226,625
-
-
-
-
$165,000
$205,808
$205,100
$199,000
$185,167
$106,750
-
Willoughby Walk
N/A
Median Price
Past 12 months
Past 12 months
-
-
$344,000
$305,000
$286,250
$295,000
$299,000
$300,000
$273,500
$240,000
$226,625
-
-
-
-
$165,000
$205,808
$205,100
$199,000
$188,000
$106,750
-
Willoughby Walk
$713
Avg. Price / ft2
Past 12 months
Past 12 months
-
-
$718
$703
-
$751
$651
$706
$606
$626
$429
$500
-
-
-
-
-
$352
$451
$396
-
$169
Willoughby Walk
$536,000
Avg. Price
Past 12 months
Past 12 months
-
-
$563,750
$507,667
-
$600,500
$485,000
$532,750
$456,125
$420,000
$367,500
$325,000
-
-
-
$284,500
-
$284,700
$287,500
$230,000
$154,125
$122,500
Willoughby Walk
$527,000
Median Price
Past 12 months
Past 12 months
-
-
$525,000
$488,000
-
$600,500
$485,000
$532,750
$464,750
$420,000
$352,500
$325,000
-
-
-
$284,500
-
$295,000
$287,500
$215,000
$160,000
$122,500
Willoughby Walk
N/A
Avg. Price / ft2
Past 12 months
Past 12 months
$999
-
$672
$727
$729
$945
-
-
-
$600
-
-
-
-
-
-
$352
$338
-
$317
-
$232
Willoughby Walk
N/A
Avg. Price
Past 12 months
Past 12 months
$999,000
-
$840,000
$800,000
$875,000
$945,000
-
-
$666,667
$750,000
$399,633
-
-
-
-
-
$438,333
$427,500
-
$358,333
-
$235,500
Willoughby Walk
N/A
Median Price
Past 12 months
Past 12 months
$999,000
-
$840,000
$800,000
$875,000
$945,000
-
-
$700,000
$750,000
$359,000
-
-
-
-
-
$440,000
$427,500
-
$380,000
-
$235,500
Willoughby Walk
N/A
Avg. Price / ft2
Past 12 months
Past 12 months
-
-
-
-
-
-
-
-
-
-
-
-
-
-
-
-
-
-
-
-
-
-
Willoughby Walk
N/A
Avg. Price
Past 12 months
Past 12 months
-
-
-
-
-
-
-
-
-
-
$655,000
-
-
-
-
-
-
$542,500
$535,000
-
-
-
Willoughby Walk
N/A
Median Price
Past 12 months
Past 12 months
-
-
-
-
-
-
-
-
-
-
$665,000
-
-
-
-
-
-
$542,500
$535,000
-
-
-
Willoughby Walk
N/A
Avg. Price / ft2
Past 12 months
Past 12 months
-
-
-
-
-
-
-
-
-
-
-
-
-
-
-
-
-
-
-
-
-
-
Willoughby Walk
N/A
Avg. Price
Past 12 months
Past 12 months
-
-
-
-
-
-
-
-
-
-
-
-
-
-
-
-
-
-
-
-
-
-
Willoughby Walk
N/A
Median Price
Past 12 months
Past 12 months
-
-
-
-
-
-
-
-
-
-
-
-
-
-
-
-
-
-
-
-
-
-
Willoughby Walk
N/A
Avg. Price / ft2
Past 12 months
Past 12 months
-
-
-
-
-
-
-
-
-
-
-
-
-
-
-
-
-
-
-
-
-
-
Willoughby Walk
N/A
Avg. Price
Past 12 months
Past 12 months
-
-
-
-
-
-
-
-
-
-
-
-
-
-
-
-
-
-
-
-
-
-
Willoughby Walk
N/A
Median Price
Past 12 months
Past 12 months
-
-
-
-
-
-
-
-
-
-
-
-
-
-
-
-
-
-
-
-
-
-
451 Clinton Avenue
$1,160
Avg. Price / ft2
Past 12 months
Past 12 months
-
$1,231
-
$1,048
-
-
$1,043
-
$896
$777
-
$603
-
-
-
-
$592
$529
$524
-
-
-
451 Clinton Avenue
$870,000
Avg. Price
Past 12 months
Past 12 months
-
$800,000
-
$815,137
-
-
$736,959
-
$641,838
$535,500
-
$392,000
-
-
-
-
$509,642
$478,056
$472,000
$329,747
$200,000
$220,000
451 Clinton Avenue
$870,000
Median Price
Past 12 months
Past 12 months
-
$800,000
-
$815,137
-
-
$736,959
-
$480,000
$535,500
-
$392,000
-
-
-
-
$474,926
$465,000
$472,000
$350,000
$200,000
$220,000
451 Clinton Avenue
N/A
Avg. Price / ft2
Past 12 months
Past 12 months
-
-
-
-
-
-
-
-
-
-
-
-
-
-
-
-
-
-
-
-
-
-
451 Clinton Avenue
N/A
Avg. Price
Past 12 months
Past 12 months
-
-
-
-
-
-
-
-
$370,513
-
-
-
-
-
-
-
-
$334,167
-
$239,241
$200,000
-
451 Clinton Avenue
N/A
Median Price
Past 12 months
Past 12 months
-
-
-
-
-
-
-
-
$370,513
-
-
-
-
-
-
-
-
$334,167
-
$239,241
$200,000
-
451 Clinton Avenue
$1,160
Avg. Price / ft2
Past 12 months
Past 12 months
-
$1,231
-
$1,048
-
-
$948
-
-
$777
-
$603
-
-
-
-
$638
-
-
-
-
-
451 Clinton Avenue
$870,000
Avg. Price
Past 12 months
Past 12 months
-
$800,000
-
$655,000
-
-
$592,793
-
$480,000
$535,500
-
$392,000
-
-
-
-
$399,000
$465,000
$315,000
$400,000
-
$220,000
451 Clinton Avenue
$870,000
Median Price
Past 12 months
Past 12 months
-
$800,000
-
$655,000
-
-
$592,793
-
$480,000
$535,500
-
$392,000
-
-
-
-
$399,000
$465,000
$315,000
$400,000
-
$220,000
451 Clinton Avenue
N/A
Avg. Price / ft2
Past 12 months
Past 12 months
-
-
-
$1,049
-
-
$1,138
-
$896
-
-
-
-
-
-
-
$546
$529
$524
-
-
-
451 Clinton Avenue
N/A
Avg. Price
Past 12 months
Past 12 months
-
-
-
$975,273
-
-
$881,124
-
$1,075,000
-
-
-
-
-
-
-
$655,000
$635,000
$629,000
-
-
-
451 Clinton Avenue
N/A
Median Price
Past 12 months
Past 12 months
-
-
-
$975,273
-
-
$881,124
-
$1,075,000
-
-
-
-
-
-
-
$655,000
$635,000
$629,000
-
-
-
451 Clinton Avenue
N/A
Avg. Price / ft2
Past 12 months
Past 12 months
-
-
-
-
-
-
-
-
-
-
-
-
-
-
-
-
-
-
-
-
-
-
451 Clinton Avenue
N/A
Avg. Price
Past 12 months
Past 12 months
-
-
-
-
-
-
-
-
-
-
-
-
-
-
-
-
-
-
-
-
-
-
451 Clinton Avenue
N/A
Median Price
Past 12 months
Past 12 months
-
-
-
-
-
-
-
-
-
-
-
-
-
-
-
-
-
-
-
-
-
-
451 Clinton Avenue
N/A
Avg. Price / ft2
Past 12 months
Past 12 months
-
-
-
-
-
-
-
-
-
-
-
-
-
-
-
-
-
-
-
-
-
-
451 Clinton Avenue
N/A
Avg. Price
Past 12 months
Past 12 months
-
-
-
-
-
-
-
-
-
-
-
-
-
-
-
-
-
-
-
-
-
-
451 Clinton Avenue
N/A
Median Price
Past 12 months
Past 12 months
-
-
-
-
-
-
-
-
-
-
-
-
-
-
-
-
-
-
-
-
-
-
Clinton Hill Co-ops
$1,025
Avg. Price / ft2
Past 12 months
Past 12 months
$1,240
$929
$898
$818
$828
$829
$810
$831
$726
$677
$576
$546
$573
-
$580
$420
$462
$411
$391
$361
$274
$164
Clinton Hill Co-ops
$818,250
Avg. Price
Past 12 months
Past 12 months
$800,000
$746,194
$702,500
$661,556
$647,500
$650,374
$615,502
$634,171
$567,824
$538,736
$446,835
$469,502
$458,738
-
$435,000
$322,664
$334,156
$349,456
$312,676
$291,484
$213,663
$133,662
Clinton Hill Co-ops
$781,500
Median Price
Past 12 months
Past 12 months
$800,000
$725,000
$717,500
$670,000
$640,000
$635,000
$610,000
$647,500
$568,000
$526,000
$450,000
$451,870
$458,738
-
$435,000
$335,000
$335,000
$345,000
$305,000
$297,593
$222,000
$145,000
Clinton Hill Co-ops
N/A
Avg. Price / ft2
Past 12 months
Past 12 months
-
-
$704
-
-
-
-
-
-
-
-
-
-
-
-
$365
-
-
-
-
-
-
Clinton Hill Co-ops
N/A
Avg. Price
Past 12 months
Past 12 months
-
-
$405,000
-
-
-
-
-
-
-
-
-
-
-
-
$292,237
-
-
-
-
-
-
Clinton Hill Co-ops
N/A
Median Price
Past 12 months
Past 12 months
-
-
$405,000
-
-
-
-
-
-
-
-
-
-
-
-
$292,237
-
-
-
-
-
-
Clinton Hill Co-ops
$943
Avg. Price / ft2
Past 12 months
Past 12 months
$1,240
$950
$906
$832
$823
$841
$830
$851
$703
$661
$587
$570
$573
-
-
$433
$468
$398
$393
$363
$288
$161
Clinton Hill Co-ops
$701,768
Avg. Price
Past 12 months
Past 12 months
$800,000
$714,286
$686,500
$610,833
$608,750
$614,608
$626,086
$631,005
$531,566
$497,706
$440,284
$443,870
$458,738
-
-
$323,622
$340,192
$314,529
$298,893
$284,069
$219,633
$127,437
Clinton Hill Co-ops
$762,500
Median Price
Past 12 months
Past 12 months
$800,000
$725,000
$717,500
$630,000
$640,250
$625,500
$645,250
$642,500
$524,990
$514,425
$450,000
$443,870
$458,738
-
-
$337,000
$345,000
$325,250
$299,000
$289,000
$227,000
$135,000
Clinton Hill Co-ops
$1,128
Avg. Price / ft2
Past 12 months
Past 12 months
-
$858
$936
$791
$836
$810
$690
$731
$777
$696
$555
$534
-
-
$580
$335
$413
$427
$385
$357
$244
$191
Clinton Hill Co-ops
$853,700
Avg. Price
Past 12 months
Past 12 months
-
$857,875
$855,000
$763,000
$725,000
$707,600
$552,000
$650,000
$676,600
$593,442
$475,750
$482,319
-
-
$435,000
$328,333
$330,000
$399,800
$343,000
$315,454
$214,426
$154,475
Clinton Hill Co-ops
$781,500
Median Price
Past 12 months
Past 12 months
-
$857,875
$910,000
$760,000
$640,000
$718,000
$552,000
$650,000
$651,000
$545,278
$467,500
$475,500
-
-
$435,000
$335,000
$330,000
$390,000
$330,000
$307,000
$215,000
$153,950
Clinton Hill Co-ops
N/A
Avg. Price / ft2
Past 12 months
Past 12 months
-
-
-
-
-
-
-
-
-
-
-
-
-
-
-
-
-
-
-
-
-
-
Clinton Hill Co-ops
N/A
Avg. Price
Past 12 months
Past 12 months
-
-
-
-
-
-
-
-
-
-
-
-
-
-
-
-
-
-
-
-
-
-
Clinton Hill Co-ops
N/A
Median Price
Past 12 months
Past 12 months
-
-
-
-
-
-
-
-
-
-
-
-
-
-
-
-
-
-
-
-
-
-
Clinton Hill Co-ops
N/A
Avg. Price / ft2
Past 12 months
Past 12 months
-
-
-
-
-
-
-
-
-
-
-
-
-
-
-
-
-
-
-
-
-
-
Clinton Hill Co-ops
N/A
Avg. Price
Past 12 months
Past 12 months
-
-
-
-
-
-
-
-
-
-
-
-
-
-
-
-
-
-
-
-
-
-
Clinton Hill Co-ops
N/A
Median Price
Past 12 months
Past 12 months
-
-
-
-
-
-
-
-
-
-
-
-
-
-
-
-
-
-
-
-
-
-