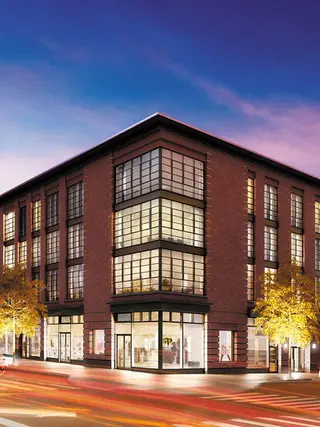
325 Henry Street: Price Comparison
between Atlantic Avenue & Pacific Street Building Profile
325 Henry Street
N/A
Avg. Price / ft2
Past 12 months
Past 12 months
2024
$2,180
2023
-
2022
-
2021
-
2020
-
2019
$1,881
2018
$1,734
2017
-
2016
-
2015
-
2014
-
2013
-
2012
-
2011
-
2010
-
2009
-
2008
-
2007
-
2006
-
2005
-
2004
-
2003
-
325 Henry Street
N/A
Avg. Price
Past 12 months
Past 12 months
2024
$5,372,500
2023
-
2022
-
2021
-
2020
-
2019
$4,075,000
2018
$3,603,075
2017
-
2016
-
2015
-
2014
-
2013
-
2012
-
2011
-
2010
-
2009
-
2008
-
2007
-
2006
-
2005
-
2004
-
2003
-
325 Henry Street
N/A
Median Price / ft2
Past 12 months
Past 12 months
2024
$2,180
2023
-
2022
-
2021
-
2020
-
2019
$1,881
2018
$1,755
2017
-
2016
-
2015
-
2014
-
2013
-
2012
-
2011
-
2010
-
2009
-
2008
-
2007
-
2006
-
2005
-
2004
-
2003
-
325 Henry Street
N/A
Median Price
Past 12 months
Past 12 months
2024
$5,372,500
2023
-
2022
-
2021
-
2020
-
2019
$4,075,000
2018
$3,450,604
2017
-
2016
-
2015
-
2014
-
2013
-
2012
-
2011
-
2010
-
2009
-
2008
-
2007
-
2006
-
2005
-
2004
-
2003
-
325 Henry Street
N/A
Avg. Price / ft2
Past 12 months
Past 12 months
2024
-
2023
-
2022
-
2021
-
2020
-
2019
-
2018
-
2017
-
2016
-
2015
-
2014
-
2013
-
2012
-
2011
-
2010
-
2009
-
2008
-
2007
-
2006
-
2005
-
2004
-
2003
-
325 Henry Street
N/A
Avg. Price
Past 12 months
Past 12 months
2024
-
2023
-
2022
-
2021
-
2020
-
2019
-
2018
-
2017
-
2016
-
2015
-
2014
-
2013
-
2012
-
2011
-
2010
-
2009
-
2008
-
2007
-
2006
-
2005
-
2004
-
2003
-
325 Henry Street
N/A
Median Price / ft2
Past 12 months
Past 12 months
2024
-
2023
-
2022
-
2021
-
2020
-
2019
-
2018
-
2017
-
2016
-
2015
-
2014
-
2013
-
2012
-
2011
-
2010
-
2009
-
2008
-
2007
-
2006
-
2005
-
2004
-
2003
-
325 Henry Street
N/A
Median Price
Past 12 months
Past 12 months
2024
-
2023
-
2022
-
2021
-
2020
-
2019
-
2018
-
2017
-
2016
-
2015
-
2014
-
2013
-
2012
-
2011
-
2010
-
2009
-
2008
-
2007
-
2006
-
2005
-
2004
-
2003
-
325 Henry Street
N/A
Avg. Price / ft2
Past 12 months
Past 12 months
2024
-
2023
-
2022
-
2021
-
2020
-
2019
-
2018
$1,610
2017
-
2016
-
2015
-
2014
-
2013
-
2012
-
2011
-
2010
-
2009
-
2008
-
2007
-
2006
-
2005
-
2004
-
2003
-
325 Henry Street
N/A
Avg. Price
Past 12 months
Past 12 months
2024
-
2023
-
2022
-
2021
-
2020
-
2019
-
2018
$2,012,381
2017
-
2016
-
2015
-
2014
-
2013
-
2012
-
2011
-
2010
-
2009
-
2008
-
2007
-
2006
-
2005
-
2004
-
2003
-
325 Henry Street
N/A
Median Price / ft2
Past 12 months
Past 12 months
2024
-
2023
-
2022
-
2021
-
2020
-
2019
-
2018
$1,610
2017
-
2016
-
2015
-
2014
-
2013
-
2012
-
2011
-
2010
-
2009
-
2008
-
2007
-
2006
-
2005
-
2004
-
2003
-
325 Henry Street
N/A
Median Price
Past 12 months
Past 12 months
2024
-
2023
-
2022
-
2021
-
2020
-
2019
-
2018
$2,012,381
2017
-
2016
-
2015
-
2014
-
2013
-
2012
-
2011
-
2010
-
2009
-
2008
-
2007
-
2006
-
2005
-
2004
-
2003
-
325 Henry Street
N/A
Avg. Price / ft2
Past 12 months
Past 12 months
2024
-
2023
-
2022
-
2021
-
2020
-
2019
-
2018
$1,755
2017
-
2016
-
2015
-
2014
-
2013
-
2012
-
2011
-
2010
-
2009
-
2008
-
2007
-
2006
-
2005
-
2004
-
2003
-
325 Henry Street
N/A
Avg. Price
Past 12 months
Past 12 months
2024
-
2023
-
2022
-
2021
-
2020
-
2019
-
2018
$3,450,604
2017
-
2016
-
2015
-
2014
-
2013
-
2012
-
2011
-
2010
-
2009
-
2008
-
2007
-
2006
-
2005
-
2004
-
2003
-
325 Henry Street
N/A
Median Price / ft2
Past 12 months
Past 12 months
2024
-
2023
-
2022
-
2021
-
2020
-
2019
-
2018
$1,755
2017
-
2016
-
2015
-
2014
-
2013
-
2012
-
2011
-
2010
-
2009
-
2008
-
2007
-
2006
-
2005
-
2004
-
2003
-
325 Henry Street
N/A
Median Price
Past 12 months
Past 12 months
2024
-
2023
-
2022
-
2021
-
2020
-
2019
-
2018
$3,450,604
2017
-
2016
-
2015
-
2014
-
2013
-
2012
-
2011
-
2010
-
2009
-
2008
-
2007
-
2006
-
2005
-
2004
-
2003
-
325 Henry Street
N/A
Avg. Price / ft2
Past 12 months
Past 12 months
2024
$2,180
2023
-
2022
-
2021
-
2020
-
2019
$1,881
2018
$1,739
2017
-
2016
-
2015
-
2014
-
2013
-
2012
-
2011
-
2010
-
2009
-
2008
-
2007
-
2006
-
2005
-
2004
-
2003
-
325 Henry Street
N/A
Avg. Price
Past 12 months
Past 12 months
2024
$5,372,500
2023
-
2022
-
2021
-
2020
-
2019
$4,075,000
2018
$4,149,544
2017
-
2016
-
2015
-
2014
-
2013
-
2012
-
2011
-
2010
-
2009
-
2008
-
2007
-
2006
-
2005
-
2004
-
2003
-
325 Henry Street
N/A
Median Price / ft2
Past 12 months
Past 12 months
2024
$2,180
2023
-
2022
-
2021
-
2020
-
2019
$1,881
2018
$1,824
2017
-
2016
-
2015
-
2014
-
2013
-
2012
-
2011
-
2010
-
2009
-
2008
-
2007
-
2006
-
2005
-
2004
-
2003
-
325 Henry Street
N/A
Median Price
Past 12 months
Past 12 months
2024
$5,372,500
2023
-
2022
-
2021
-
2020
-
2019
$4,075,000
2018
$3,950,725
2017
-
2016
-
2015
-
2014
-
2013
-
2012
-
2011
-
2010
-
2009
-
2008
-
2007
-
2006
-
2005
-
2004
-
2003
-
325 Henry Street
N/A
Avg. Price / ft2
Past 12 months
Past 12 months
2024
-
2023
-
2022
-
2021
-
2020
-
2019
-
2018
$1,926
2017
-
2016
-
2015
-
2014
-
2013
-
2012
-
2011
-
2010
-
2009
-
2008
-
2007
-
2006
-
2005
-
2004
-
2003
-
325 Henry Street
N/A
Avg. Price
Past 12 months
Past 12 months
2024
-
2023
-
2022
-
2021
-
2020
-
2019
-
2018
$5,450,000
2017
-
2016
-
2015
-
2014
-
2013
-
2012
-
2011
-
2010
-
2009
-
2008
-
2007
-
2006
-
2005
-
2004
-
2003
-
325 Henry Street
N/A
Median Price / ft2
Past 12 months
Past 12 months
2024
-
2023
-
2022
-
2021
-
2020
-
2019
-
2018
$1,926
2017
-
2016
-
2015
-
2014
-
2013
-
2012
-
2011
-
2010
-
2009
-
2008
-
2007
-
2006
-
2005
-
2004
-
2003
-
325 Henry Street
N/A
Median Price
Past 12 months
Past 12 months
2024
-
2023
-
2022
-
2021
-
2020
-
2019
-
2018
$5,450,000
2017
-
2016
-
2015
-
2014
-
2013
-
2012
-
2011
-
2010
-
2009
-
2008
-
2007
-
2006
-
2005
-
2004
-
2003
-
The Landmark at Strong Place
$1,516
Avg. Price / ft2
Past 12 months
Past 12 months
$1,476
$1,524
$1,273
$1,269
$1,383
$987
$1,474
$1,359
-
$1,188
-
$1,098
$900
$974
-
-
-
-
-
-
-
-
The Landmark at Strong Place
$1,675,000
Avg. Price
Past 12 months
Past 12 months
$1,912,500
$2,355,000
$2,495,000
$1,637,500
$1,605,500
$1,490,000
$1,400,000
$2,075,000
-
$1,537,500
-
$1,922,500
$1,300,521
$1,445,441
-
-
-
-
-
-
-
-
The Landmark at Strong Place
$1,516
Median Price / ft2
Past 12 months
Past 12 months
$1,476
$1,426
$1,273
$1,269
$1,383
$987
$1,474
$1,233
-
$1,188
-
$1,098
$889
$942
-
-
-
-
-
-
-
-
The Landmark at Strong Place
$1,675,000
Median Price
Past 12 months
Past 12 months
$1,912,500
$2,050,000
$2,495,000
$1,637,500
$1,605,500
$1,490,000
$1,400,000
$2,200,000
-
$1,537,500
-
$1,922,500
$1,060,000
$1,406,250
-
-
-
-
-
-
-
-
The Landmark at Strong Place
N/A
Avg. Price / ft2
Past 12 months
Past 12 months
-
-
-
-
-
-
-
-
-
-
-
-
-
-
-
-
-
-
-
-
-
-
The Landmark at Strong Place
N/A
Avg. Price
Past 12 months
Past 12 months
-
-
-
-
-
-
-
-
-
-
-
-
-
-
-
-
-
-
-
-
-
-
The Landmark at Strong Place
N/A
Median Price / ft2
Past 12 months
Past 12 months
-
-
-
-
-
-
-
-
-
-
-
-
-
-
-
-
-
-
-
-
-
-
The Landmark at Strong Place
N/A
Median Price
Past 12 months
Past 12 months
-
-
-
-
-
-
-
-
-
-
-
-
-
-
-
-
-
-
-
-
-
-
The Landmark at Strong Place
N/A
Avg. Price / ft2
Past 12 months
Past 12 months
-
$1,339
-
-
$1,354
-
-
$1,233
-
$1,147
-
$877
$879
$882
-
-
-
-
-
-
-
-
The Landmark at Strong Place
N/A
Avg. Price
Past 12 months
Past 12 months
-
$1,520,000
-
-
$1,496,000
-
-
$1,400,000
-
$1,325,000
-
$995,000
$946,008
$975,000
-
-
-
-
-
-
-
-
The Landmark at Strong Place
N/A
Median Price / ft2
Past 12 months
Past 12 months
-
$1,339
-
-
$1,354
-
-
$1,233
-
$1,147
-
$877
$880
$882
-
-
-
-
-
-
-
-
The Landmark at Strong Place
N/A
Median Price
Past 12 months
Past 12 months
-
$1,520,000
-
-
$1,496,000
-
-
$1,400,000
-
$1,325,000
-
$995,000
$972,428
$975,000
-
-
-
-
-
-
-
-
The Landmark at Strong Place
$1,516
Avg. Price / ft2
Past 12 months
Past 12 months
$1,476
$1,438
$1,273
$1,269
$1,412
$1,217
$1,474
$1,122
-
$1,228
-
-
$872
$948
-
-
-
-
-
-
-
-
The Landmark at Strong Place
$1,675,000
Avg. Price
Past 12 months
Past 12 months
$1,912,500
$2,001,667
$2,495,000
$1,637,500
$1,715,000
$1,345,000
$1,400,000
$2,200,000
-
$1,750,000
-
-
$1,311,199
$1,197,146
-
-
-
-
-
-
-
-
The Landmark at Strong Place
$1,516
Median Price / ft2
Past 12 months
Past 12 months
$1,476
$1,426
$1,273
$1,269
$1,412
$1,217
$1,474
$1,122
-
$1,228
-
-
$888
$940
-
-
-
-
-
-
-
-
The Landmark at Strong Place
$1,675,000
Median Price
Past 12 months
Past 12 months
$1,912,500
$2,050,000
$2,495,000
$1,637,500
$1,715,000
$1,345,000
$1,400,000
$2,200,000
-
$1,750,000
-
-
$1,218,750
$1,186,045
-
-
-
-
-
-
-
-
The Landmark at Strong Place
N/A
Avg. Price / ft2
Past 12 months
Past 12 months
-
$1,968
-
-
-
$757
-
$1,721
-
-
-
$1,319
$1,127
$1,023
-
-
-
-
-
-
-
-
The Landmark at Strong Place
N/A
Avg. Price
Past 12 months
Past 12 months
-
$4,250,000
-
-
-
$1,635,000
-
$2,625,000
-
-
-
$2,850,000
$2,300,000
$1,837,484
-
-
-
-
-
-
-
-
The Landmark at Strong Place
N/A
Median Price / ft2
Past 12 months
Past 12 months
-
$1,968
-
-
-
$757
-
$1,721
-
-
-
$1,319
$1,127
$1,043
-
-
-
-
-
-
-
-
The Landmark at Strong Place
N/A
Median Price
Past 12 months
Past 12 months
-
$4,250,000
-
-
-
$1,635,000
-
$2,625,000
-
-
-
$2,850,000
$2,300,000
$1,960,000
-
-
-
-
-
-
-
-
The Landmark at Strong Place
N/A
Avg. Price / ft2
Past 12 months
Past 12 months
-
-
-
-
-
-
-
-
-
-
-
-
-
-
-
-
-
-
-
-
-
-
The Landmark at Strong Place
N/A
Avg. Price
Past 12 months
Past 12 months
-
-
-
-
-
-
-
-
-
-
-
-
-
-
-
-
-
-
-
-
-
-
The Landmark at Strong Place
N/A
Median Price / ft2
Past 12 months
Past 12 months
-
-
-
-
-
-
-
-
-
-
-
-
-
-
-
-
-
-
-
-
-
-
The Landmark at Strong Place
N/A
Median Price
Past 12 months
Past 12 months
-
-
-
-
-
-
-
-
-
-
-
-
-
-
-
-
-
-
-
-
-
-
The Landmark at Strong Place
N/A
Avg. Price / ft2
Past 12 months
Past 12 months
-
-
-
-
-
-
-
-
-
-
-
-
-
-
-
-
-
-
-
-
-
-
The Landmark at Strong Place
N/A
Avg. Price
Past 12 months
Past 12 months
-
-
-
-
-
-
-
-
-
-
-
-
-
-
-
-
-
-
-
-
-
-
The Landmark at Strong Place
N/A
Median Price / ft2
Past 12 months
Past 12 months
-
-
-
-
-
-
-
-
-
-
-
-
-
-
-
-
-
-
-
-
-
-
The Landmark at Strong Place
N/A
Median Price
Past 12 months
Past 12 months
-
-
-
-
-
-
-
-
-
-
-
-
-
-
-
-
-
-
-
-
-
-
100 Congress Street
$1,285
Avg. Price / ft2
Past 12 months
Past 12 months
-
-
$1,297
$1,347
-
-
$1,468
$1,468
$1,192
$1,541
$1,146
-
$1,008
$879
-
-
-
-
-
-
-
-
100 Congress Street
$1,240,000
Avg. Price
Past 12 months
Past 12 months
-
-
$1,073,000
$1,582,500
-
-
$1,450,000
$1,582,500
$1,150,000
$1,150,000
$1,085,000
-
$1,089,167
$802,361
-
-
-
-
-
-
-
-
100 Congress Street
$1,285
Median Price / ft2
Past 12 months
Past 12 months
-
-
$1,278
$1,347
-
-
$1,468
$1,468
$1,192
$1,316
$1,146
-
$1,003
$758
-
-
-
-
-
-
-
-
100 Congress Street
$1,240,000
Median Price
Past 12 months
Past 12 months
-
-
$1,149,000
$1,582,500
-
-
$1,450,000
$1,582,500
$1,150,000
$1,300,000
$1,085,000
-
$917,500
$851,799
-
-
-
-
-
-
-
-
100 Congress Street
N/A
Avg. Price / ft2
Past 12 months
Past 12 months
-
-
-
-
-
-
-
-
-
-
-
-
-
$879
-
-
-
-
-
-
-
-
100 Congress Street
N/A
Avg. Price
Past 12 months
Past 12 months
-
-
-
-
-
-
-
-
-
-
-
-
-
$390,390
-
-
-
-
-
-
-
-
100 Congress Street
N/A
Median Price / ft2
Past 12 months
Past 12 months
-
-
-
-
-
-
-
-
-
-
-
-
-
$879
-
-
-
-
-
-
-
-
100 Congress Street
N/A
Median Price
Past 12 months
Past 12 months
-
-
-
-
-
-
-
-
-
-
-
-
-
$390,390
-
-
-
-
-
-
-
-
100 Congress Street
N/A
Avg. Price / ft2
Past 12 months
Past 12 months
-
-
$1,278
-
-
-
-
-
-
$1,653
-
-
$1,269
$998
-
-
-
-
-
-
-
-
100 Congress Street
N/A
Avg. Price
Past 12 months
Past 12 months
-
-
$675,000
-
-
-
-
-
-
$1,075,000
-
-
$917,500
$530,714
-
-
-
-
-
-
-
-
100 Congress Street
N/A
Median Price / ft2
Past 12 months
Past 12 months
-
-
$1,278
-
-
-
-
-
-
$1,653
-
-
$1,269
$704
-
-
-
-
-
-
-
-
100 Congress Street
N/A
Median Price
Past 12 months
Past 12 months
-
-
$675,000
-
-
-
-
-
-
$1,075,000
-
-
$917,500
$390,000
-
-
-
-
-
-
-
-
100 Congress Street
$1,285
Avg. Price / ft2
Past 12 months
Past 12 months
-
-
$1,306
-
-
-
$1,468
$1,468
$1,192
$1,316
$1,188
-
-
$846
-
-
-
-
-
-
-
-
100 Congress Street
$1,240,000
Avg. Price
Past 12 months
Past 12 months
-
-
$1,272,000
-
-
-
$1,450,000
$1,440,000
$1,150,000
$1,300,000
$950,000
-
-
$794,626
-
-
-
-
-
-
-
-
100 Congress Street
$1,285
Median Price / ft2
Past 12 months
Past 12 months
-
-
$1,306
-
-
-
$1,468
$1,468
$1,192
$1,316
$1,188
-
-
$841
-
-
-
-
-
-
-
-
100 Congress Street
$1,240,000
Median Price
Past 12 months
Past 12 months
-
-
$1,272,000
-
-
-
$1,450,000
$1,440,000
$1,150,000
$1,300,000
$950,000
-
-
$788,500
-
-
-
-
-
-
-
-
100 Congress Street
N/A
Avg. Price / ft2
Past 12 months
Past 12 months
-
-
-
$1,347
-
-
-
$1,468
-
-
$1,105
-
$878
$833
-
-
-
-
-
-
-
-
100 Congress Street
N/A
Avg. Price
Past 12 months
Past 12 months
-
-
-
$1,582,500
-
-
-
$1,725,000
-
-
$1,220,000
-
$1,175,000
$1,000,308
-
-
-
-
-
-
-
-
100 Congress Street
N/A
Median Price / ft2
Past 12 months
Past 12 months
-
-
-
$1,347
-
-
-
$1,468
-
-
$1,105
-
$878
$758
-
-
-
-
-
-
-
-
100 Congress Street
N/A
Median Price
Past 12 months
Past 12 months
-
-
-
$1,582,500
-
-
-
$1,725,000
-
-
$1,220,000
-
$1,175,000
$900,000
-
-
-
-
-
-
-
-
100 Congress Street
N/A
Avg. Price / ft2
Past 12 months
Past 12 months
-
-
-
-
-
-
-
-
-
-
-
-
-
-
-
-
-
-
-
-
-
-
100 Congress Street
N/A
Avg. Price
Past 12 months
Past 12 months
-
-
-
-
-
-
-
-
-
-
-
-
-
-
-
-
-
-
-
-
-
-
100 Congress Street
N/A
Median Price / ft2
Past 12 months
Past 12 months
-
-
-
-
-
-
-
-
-
-
-
-
-
-
-
-
-
-
-
-
-
-
100 Congress Street
N/A
Median Price
Past 12 months
Past 12 months
-
-
-
-
-
-
-
-
-
-
-
-
-
-
-
-
-
-
-
-
-
-
100 Congress Street
N/A
Avg. Price / ft2
Past 12 months
Past 12 months
-
-
-
-
-
-
-
-
-
-
-
-
-
-
-
-
-
-
-
-
-
-
100 Congress Street
N/A
Avg. Price
Past 12 months
Past 12 months
-
-
-
-
-
-
-
-
-
-
-
-
-
-
-
-
-
-
-
-
-
-
100 Congress Street
N/A
Median Price / ft2
Past 12 months
Past 12 months
-
-
-
-
-
-
-
-
-
-
-
-
-
-
-
-
-
-
-
-
-
-
100 Congress Street
N/A
Median Price
Past 12 months
Past 12 months
-
-
-
-
-
-
-
-
-
-
-
-
-
-
-
-
-
-
-
-
-
-
Cobble Hill Towers
$1,193
Avg. Price / ft2
Past 12 months
Past 12 months
$951
$1,123
$1,115
$1,015
$1,045
$955
$1,043
$1,065
$843
$770
$619
$651
$645
-
-
-
-
-
-
-
-
-
Cobble Hill Towers
$753,000
Avg. Price
Past 12 months
Past 12 months
$614,250
$783,000
$643,095
$519,091
$1,165,000
$614,667
$563,411
$674,062
$476,511
$549,753
$360,703
$377,012
$368,030
-
-
-
-
-
-
-
-
-
Cobble Hill Towers
$1,130
Median Price / ft2
Past 12 months
Past 12 months
$968
$1,060
$1,009
$890
$1,045
$977
$1,040
$988
$934
$812
$624
$628
$592
-
-
-
-
-
-
-
-
-
Cobble Hill Towers
$805,000
Median Price
Past 12 months
Past 12 months
$642,500
$852,500
$690,000
$455,000
$1,165,000
$505,000
$497,264
$641,000
$465,000
$525,825
$324,480
$332,150
$321,863
-
-
-
-
-
-
-
-
-
Cobble Hill Towers
N/A
Avg. Price / ft2
Past 12 months
Past 12 months
-
$962
$1,683
$887
-
$998
$1,016
$1,731
$973
$878
$642
$636
$560
-
-
-
-
-
-
-
-
-
Cobble Hill Towers
N/A
Avg. Price
Past 12 months
Past 12 months
-
$460,000
$690,000
$410,000
-
$499,000
$443,500
$709,721
$465,000
$399,880
$290,765
$303,105
$272,500
-
-
-
-
-
-
-
-
-
Cobble Hill Towers
N/A
Median Price / ft2
Past 12 months
Past 12 months
-
$962
$1,683
$894
-
$998
$1,016
$1,731
$973
$878
$642
$627
$560
-
-
-
-
-
-
-
-
-
Cobble Hill Towers
N/A
Median Price
Past 12 months
Past 12 months
-
$460,000
$690,000
$417,500
-
$499,000
$443,500
$709,721
$465,000
$399,880
$290,765
$300,591
$272,500
-
-
-
-
-
-
-
-
-
Cobble Hill Towers
$1,361
Avg. Price / ft2
Past 12 months
Past 12 months
$951
$1,408
$973
$1,140
-
$889
$1,048
$1,075
$868
$770
$615
$682
$659
-
-
-
-
-
-
-
-
-
Cobble Hill Towers
$740,000
Avg. Price
Past 12 months
Past 12 months
$614,250
$967,000
$631,369
$578,333
-
$505,000
$585,214
$586,286
$431,192
$511,356
$371,463
$377,384
$354,757
-
-
-
-
-
-
-
-
-
Cobble Hill Towers
$1,267
Median Price / ft2
Past 12 months
Past 12 months
$968
$1,408
$1,000
$892
-
$889
$1,040
$1,000
$856
$747
$615
$647
$599
-
-
-
-
-
-
-
-
-
Cobble Hill Towers
$762,500
Median Price
Past 12 months
Past 12 months
$642,500
$967,000
$687,692
$460,000
-
$505,000
$499,000
$575,000
$426,253
$525,825
$370,110
$339,090
$321,863
-
-
-
-
-
-
-
-
-
Cobble Hill Towers
$942
Avg. Price / ft2
Past 12 months
Past 12 months
-
$1,060
-
$773
-
$977
-
$797
$728
$699
-
$570
$585
-
-
-
-
-
-
-
-
-
Cobble Hill Towers
$805,000
Avg. Price
Past 12 months
Past 12 months
-
$852,500
-
$600,000
-
$840,000
-
$675,010
$572,905
$562,079
-
$457,338
$500,000
-
-
-
-
-
-
-
-
-
Cobble Hill Towers
$942
Median Price / ft2
Past 12 months
Past 12 months
-
$1,060
-
$773
-
$977
-
$797
$728
$748
-
$549
$585
-
-
-
-
-
-
-
-
-
Cobble Hill Towers
$805,000
Median Price
Past 12 months
Past 12 months
-
$852,500
-
$600,000
-
$840,000
-
$675,010
$572,905
$580,402
-
$457,631
$500,000
-
-
-
-
-
-
-
-
-
Cobble Hill Towers
N/A
Avg. Price / ft2
Past 12 months
Past 12 months
-
-
-
-
$1,045
-
-
$964
-
$913
-
$580
$641
-
-
-
-
-
-
-
-
-
Cobble Hill Towers
N/A
Avg. Price
Past 12 months
Past 12 months
-
-
-
-
$1,165,000
-
-
$962,500
-
$1,018,250
-
$615,166
$639,500
-
-
-
-
-
-
-
-
-
Cobble Hill Towers
N/A
Median Price / ft2
Past 12 months
Past 12 months
-
-
-
-
$1,045
-
-
$964
-
$913
-
$580
$641
-
-
-
-
-
-
-
-
-
Cobble Hill Towers
N/A
Median Price
Past 12 months
Past 12 months
-
-
-
-
$1,165,000
-
-
$962,500
-
$1,018,250
-
$615,166
$639,500
-
-
-
-
-
-
-
-
-
Cobble Hill Towers
N/A
Avg. Price / ft2
Past 12 months
Past 12 months
-
-
-
-
-
-
-
-
-
-
-
-
-
-
-
-
-
-
-
-
-
-
Cobble Hill Towers
N/A
Avg. Price
Past 12 months
Past 12 months
-
-
-
-
-
-
-
-
-
-
-
-
-
-
-
-
-
-
-
-
-
-
Cobble Hill Towers
N/A
Median Price / ft2
Past 12 months
Past 12 months
-
-
-
-
-
-
-
-
-
-
-
-
-
-
-
-
-
-
-
-
-
-
Cobble Hill Towers
N/A
Median Price
Past 12 months
Past 12 months
-
-
-
-
-
-
-
-
-
-
-
-
-
-
-
-
-
-
-
-
-
-
Cobble Hill Towers
N/A
Avg. Price / ft2
Past 12 months
Past 12 months
-
-
-
-
-
-
-
-
-
-
-
-
-
-
-
-
-
-
-
-
-
-
Cobble Hill Towers
N/A
Avg. Price
Past 12 months
Past 12 months
-
-
-
-
-
-
-
-
-
-
-
-
-
-
-
-
-
-
-
-
-
-
Cobble Hill Towers
N/A
Median Price / ft2
Past 12 months
Past 12 months
-
-
-
-
-
-
-
-
-
-
-
-
-
-
-
-
-
-
-
-
-
-
Cobble Hill Towers
N/A
Median Price
Past 12 months
Past 12 months
-
-
-
-
-
-
-
-
-
-
-
-
-
-
-
-
-
-
-
-
-
-
The Arches at Cobble Hill
$1,053
Avg. Price / ft2
Past 12 months
Past 12 months
$1,191
$1,205
$1,249
$1,177
$1,148
$1,181
$757
$1,117
$1,088
$1,208
$1,010
$896
$782
$752
$723
$650
$698
$706
$696
$592
-
-
The Arches at Cobble Hill
$2,215,000
Avg. Price
Past 12 months
Past 12 months
$1,545,000
$1,990,750
$1,963,000
$1,320,000
$1,504,500
$1,850,000
$1,612,500
$1,531,000
$1,617,000
$1,298,333
$1,527,063
$1,064,667
$1,245,333
$1,162,571
$928,750
$889,637
$1,135,000
$956,981
$940,000
$839,106
-
-
The Arches at Cobble Hill
$1,219
Median Price / ft2
Past 12 months
Past 12 months
$1,191
$1,216
$1,211
$1,183
$1,175
$1,181
$757
$1,122
$1,035
$1,232
$971
$924
$803
$739
$705
$669
$698
$715
$734
$589
-
-
The Arches at Cobble Hill
$2,135,000
Median Price
Past 12 months
Past 12 months
$1,545,000
$1,794,500
$2,000,000
$1,375,000
$1,509,000
$1,850,000
$1,612,500
$1,425,000
$1,550,000
$1,335,000
$1,661,625
$1,125,000
$1,175,000
$1,073,000
$830,000
$815,000
$1,100,000
$925,000
$925,000
$814,091
-
-
The Arches at Cobble Hill
N/A
Avg. Price / ft2
Past 12 months
Past 12 months
-
-
-
-
-
-
-
-
-
-
-
-
-
-
-
-
-
-
-
-
-
-
The Arches at Cobble Hill
N/A
Avg. Price
Past 12 months
Past 12 months
-
-
-
-
-
-
-
-
-
-
-
-
-
-
-
-
-
-
-
-
-
-
The Arches at Cobble Hill
N/A
Median Price / ft2
Past 12 months
Past 12 months
-
-
-
-
-
-
-
-
-
-
-
-
-
-
-
-
-
-
-
-
-
-
The Arches at Cobble Hill
N/A
Median Price
Past 12 months
Past 12 months
-
-
-
-
-
-
-
-
-
-
-
-
-
-
-
-
-
-
-
-
-
-
The Arches at Cobble Hill
N/A
Avg. Price / ft2
Past 12 months
Past 12 months
-
-
-
-
-
-
-
-
-
-
-
-
-
-
$789
-
-
-
-
$588
-
-
The Arches at Cobble Hill
N/A
Avg. Price
Past 12 months
Past 12 months
-
-
-
-
-
-
-
-
-
-
-
-
-
-
$750,000
-
-
-
-
$553,705
-
-
The Arches at Cobble Hill
N/A
Median Price / ft2
Past 12 months
Past 12 months
-
-
-
-
-
-
-
-
-
-
-
-
-
-
$789
-
-
-
-
$588
-
-
The Arches at Cobble Hill
N/A
Median Price
Past 12 months
Past 12 months
-
-
-
-
-
-
-
-
-
-
-
-
-
-
$750,000
-
-
-
-
$553,705
-
-
The Arches at Cobble Hill
$1,229
Avg. Price / ft2
Past 12 months
Past 12 months
$1,391
$1,192
$1,185
$1,177
$1,175
$1,181
$526
$1,176
$1,088
$1,208
$1,079
$867
$754
$744
$709
$702
$671
$730
$696
$597
-
-
The Arches at Cobble Hill
$2,055,000
Avg. Price
Past 12 months
Past 12 months
$1,490,000
$1,679,667
$1,871,667
$1,320,000
$1,284,000
$1,850,000
$900,000
$1,557,500
$1,617,000
$1,298,333
$1,392,500
$1,017,000
$1,016,667
$1,033,600
$964,500
$815,000
$1,141,667
$882,500
$940,000
$800,991
-
-
The Arches at Cobble Hill
$1,229
Median Price / ft2
Past 12 months
Past 12 months
$1,391
$1,200
$1,211
$1,183
$1,175
$1,181
$526
$1,140
$1,035
$1,232
$1,079
$895
$794
$739
$699
$676
$664
$731
$734
$592
-
-
The Arches at Cobble Hill
$2,055,000
Median Price
Past 12 months
Past 12 months
$1,490,000
$1,464,000
$1,890,000
$1,375,000
$1,284,000
$1,850,000
$900,000
$1,502,500
$1,550,000
$1,335,000
$1,392,500
$1,100,000
$850,000
$1,050,000
$860,000
$815,000
$1,100,000
$922,500
$925,000
$804,417
-
-
The Arches at Cobble Hill
$833
Avg. Price / ft2
Past 12 months
Past 12 months
$990
-
$1,346
-
$1,122
-
-
$882
-
-
$942
$1,042
$782
$772
-
$571
$738
$510
-
$571
-
-
The Arches at Cobble Hill
$2,535,000
Avg. Price
Past 12 months
Past 12 months
$1,600,000
-
$2,100,000
-
$1,725,000
-
-
$1,425,000
-
-
$1,661,625
$1,303,000
$1,261,000
$1,485,000
-
$1,001,594
$1,125,000
$1,552,831
-
$974,126
-
-
The Arches at Cobble Hill
$833
Median Price / ft2
Past 12 months
Past 12 months
$990
-
$1,346
-
$1,122
-
-
$882
-
-
$942
$1,042
$782
$772
-
$571
$738
$510
-
$539
-
-
The Arches at Cobble Hill
$2,535,000
Median Price
Past 12 months
Past 12 months
$1,600,000
-
$2,100,000
-
$1,725,000
-
-
$1,425,000
-
-
$1,661,625
$1,303,000
$1,261,000
$1,485,000
-
$1,001,594
$1,125,000
$1,552,831
-
$1,013,158
-
-
The Arches at Cobble Hill
N/A
Avg. Price / ft2
Past 12 months
Past 12 months
-
$1,244
-
-
-
-
$989
-
-
-
-
-
$866
-
-
-
-
-
-
$572
-
-
The Arches at Cobble Hill
N/A
Avg. Price
Past 12 months
Past 12 months
-
$2,924,000
-
-
-
-
$2,325,000
-
-
-
-
-
$1,900,000
-
-
-
-
-
-
$1,298,269
-
-
The Arches at Cobble Hill
N/A
Median Price / ft2
Past 12 months
Past 12 months
-
$1,244
-
-
-
-
$989
-
-
-
-
-
$866
-
-
-
-
-
-
$572
-
-
The Arches at Cobble Hill
N/A
Median Price
Past 12 months
Past 12 months
-
$2,924,000
-
-
-
-
$2,325,000
-
-
-
-
-
$1,900,000
-
-
-
-
-
-
$1,298,269
-
-
The Arches at Cobble Hill
N/A
Avg. Price / ft2
Past 12 months
Past 12 months
-
-
-
-
-
-
-
-
-
-
-
-
-
-
-
-
-
-
-
-
-
-
The Arches at Cobble Hill
N/A
Avg. Price
Past 12 months
Past 12 months
-
-
-
-
-
-
-
-
-
-
-
-
-
-
-
-
-
-
-
-
-
-
The Arches at Cobble Hill
N/A
Median Price / ft2
Past 12 months
Past 12 months
-
-
-
-
-
-
-
-
-
-
-
-
-
-
-
-
-
-
-
-
-
-
The Arches at Cobble Hill
N/A
Median Price
Past 12 months
Past 12 months
-
-
-
-
-
-
-
-
-
-
-
-
-
-
-
-
-
-
-
-
-
-
Tiffany Tower
N/A
Avg. Price / ft2
Past 12 months
Past 12 months
$1,389
-
-
$1,193
$1,158
-
-
$1,130
$1,010
$908
$956
$1,030
$770
$776
$696
-
-
$756
-
-
-
-
Tiffany Tower
N/A
Avg. Price
Past 12 months
Past 12 months
$1,650,000
-
-
$1,225,000
$1,278,750
-
-
$1,295,000
$1,200,000
$922,000
$1,032,500
$2,392,888
$915,000
$822,500
$767,500
-
-
$805,367
-
-
-
-
Tiffany Tower
N/A
Median Price / ft2
Past 12 months
Past 12 months
$1,389
-
-
$1,193
$1,158
-
-
$1,130
$1,010
$908
$956
$1,030
$770
$776
$696
-
-
$766
-
-
-
-
Tiffany Tower
N/A
Median Price
Past 12 months
Past 12 months
$1,650,000
-
-
$1,225,000
$1,278,750
-
-
$1,295,000
$1,200,000
$922,000
$1,032,500
$2,392,888
$915,000
$822,500
$767,500
-
-
$827,270
-
-
-
-
Tiffany Tower
N/A
Avg. Price / ft2
Past 12 months
Past 12 months
-
-
-
-
-
-
-
-
-
-
-
-
-
-
-
-
-
-
-
-
-
-
Tiffany Tower
N/A
Avg. Price
Past 12 months
Past 12 months
-
-
-
-
-
-
-
-
-
-
-
-
-
-
-
-
-
-
-
-
-
-
Tiffany Tower
N/A
Median Price / ft2
Past 12 months
Past 12 months
-
-
-
-
-
-
-
-
-
-
-
-
-
-
-
-
-
-
-
-
-
-
Tiffany Tower
N/A
Median Price
Past 12 months
Past 12 months
-
-
-
-
-
-
-
-
-
-
-
-
-
-
-
-
-
-
-
-
-
-
Tiffany Tower
N/A
Avg. Price / ft2
Past 12 months
Past 12 months
$1,389
-
-
$1,193
$1,158
-
-
$1,130
$1,010
$908
$909
-
$770
$776
$696
-
-
$756
-
-
-
-
Tiffany Tower
N/A
Avg. Price
Past 12 months
Past 12 months
$1,650,000
-
-
$1,225,000
$1,278,750
-
-
$1,295,000
$1,200,000
$922,000
$965,000
-
$915,000
$822,500
$767,500
-
-
$805,367
-
-
-
-
Tiffany Tower
N/A
Median Price / ft2
Past 12 months
Past 12 months
$1,389
-
-
$1,193
$1,158
-
-
$1,130
$1,010
$908
$909
-
$770
$776
$696
-
-
$766
-
-
-
-
Tiffany Tower
N/A
Median Price
Past 12 months
Past 12 months
$1,650,000
-
-
$1,225,000
$1,278,750
-
-
$1,295,000
$1,200,000
$922,000
$965,000
-
$915,000
$822,500
$767,500
-
-
$827,270
-
-
-
-
Tiffany Tower
N/A
Avg. Price / ft2
Past 12 months
Past 12 months
-
-
-
-
-
-
-
-
-
-
$1,003
$1,030
-
-
-
-
-
-
-
-
-
-
Tiffany Tower
N/A
Avg. Price
Past 12 months
Past 12 months
-
-
-
-
-
-
-
-
-
-
$1,100,000
$2,392,888
-
-
-
-
-
-
-
-
-
-
Tiffany Tower
N/A
Median Price / ft2
Past 12 months
Past 12 months
-
-
-
-
-
-
-
-
-
-
$1,003
$1,030
-
-
-
-
-
-
-
-
-
-
Tiffany Tower
N/A
Median Price
Past 12 months
Past 12 months
-
-
-
-
-
-
-
-
-
-
$1,100,000
$2,392,888
-
-
-
-
-
-
-
-
-
-
Tiffany Tower
N/A
Avg. Price / ft2
Past 12 months
Past 12 months
-
-
-
-
-
-
-
-
-
-
-
-
-
-
-
-
-
-
-
-
-
-
Tiffany Tower
N/A
Avg. Price
Past 12 months
Past 12 months
-
-
-
-
-
-
-
-
-
-
-
-
-
-
-
-
-
-
-
-
-
-
Tiffany Tower
N/A
Median Price / ft2
Past 12 months
Past 12 months
-
-
-
-
-
-
-
-
-
-
-
-
-
-
-
-
-
-
-
-
-
-
Tiffany Tower
N/A
Median Price
Past 12 months
Past 12 months
-
-
-
-
-
-
-
-
-
-
-
-
-
-
-
-
-
-
-
-
-
-
Tiffany Tower
N/A
Avg. Price / ft2
Past 12 months
Past 12 months
-
-
-
-
-
-
-
-
-
-
-
-
-
-
-
-
-
-
-
-
-
-
Tiffany Tower
N/A
Avg. Price
Past 12 months
Past 12 months
-
-
-
-
-
-
-
-
-
-
-
-
-
-
-
-
-
-
-
-
-
-
Tiffany Tower
N/A
Median Price / ft2
Past 12 months
Past 12 months
-
-
-
-
-
-
-
-
-
-
-
-
-
-
-
-
-
-
-
-
-
-
Tiffany Tower
N/A
Median Price
Past 12 months
Past 12 months
-
-
-
-
-
-
-
-
-
-
-
-
-
-
-
-
-
-
-
-
-
-