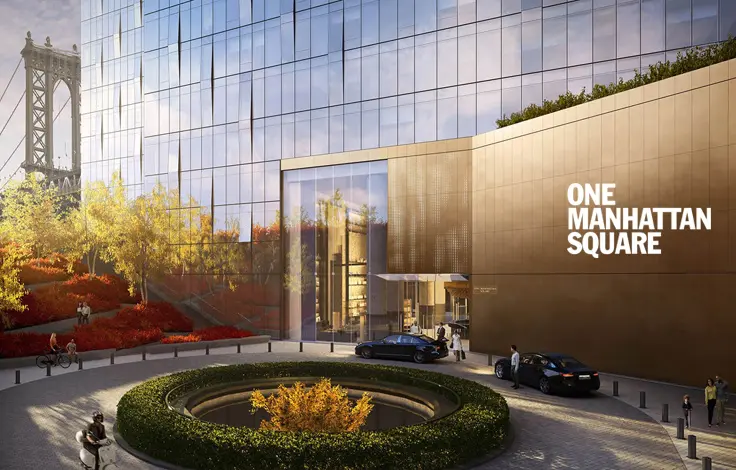
The Traymore, 225 Eastern Parkway: Price Comparison
between Classon Avenue & Franklin Avenue View Full Building Profile
The Traymore
$1,201
Avg. Price / ft2
Past 12 months
Past 12 months
2023
$1,178
2022
$1,123
2021
$996
2020
-
2019
$923
2018
$1,020
2017
$924
2016
$942
2015
$880
2014
$770
2013
$633
2012
$556
2011
$564
2010
$555
2009
$551
2008
$547
2007
$495
2006
$382
2005
$398
2004
-
2003
-
The Traymore
$1,612,500
Avg. Price
Past 12 months
Past 12 months
2023
$1,368,333
2022
$1,677,500
2021
$1,320,000
2020
-
2019
$1,185,500
2018
$1,502,500
2017
$1,450,606
2016
$1,925,000
2015
$1,517,861
2014
$1,356,836
2013
$842,500
2012
$850,000
2011
$870,505
2010
$535,500
2009
$700,000
2008
$1,086,899
2007
$660,991
2006
$526,339
2005
$511,889
2004
-
2003
-
The Traymore
$1,201
Median Price / ft2
Past 12 months
Past 12 months
2023
$1,140
2022
$1,123
2021
$996
2020
-
2019
$923
2018
$1,020
2017
$1,000
2016
$942
2015
$880
2014
$832
2013
$633
2012
$556
2011
$564
2010
$555
2009
$551
2008
$547
2007
$495
2006
$408
2005
$413
2004
-
2003
-
The Traymore
$1,612,500
Median Price
Past 12 months
Past 12 months
2023
$1,175,000
2022
$1,677,500
2021
$1,320,000
2020
-
2019
$1,185,500
2018
$1,502,500
2017
$1,406,713
2016
$1,925,000
2015
$1,517,861
2014
$1,700,000
2013
$842,500
2012
$850,000
2011
$870,505
2010
$535,500
2009
$700,000
2008
$1,086,899
2007
$660,991
2006
$494,832
2005
$520,529
2004
-
2003
-
The Traymore
N/A
Avg. Price / ft2
Past 12 months
Past 12 months
2023
-
2022
-
2021
-
2020
-
2019
-
2018
-
2017
-
2016
-
2015
-
2014
-
2013
-
2012
-
2011
-
2010
-
2009
-
2008
-
2007
-
2006
-
2005
-
2004
-
2003
-
The Traymore
N/A
Avg. Price
Past 12 months
Past 12 months
2023
-
2022
-
2021
-
2020
-
2019
-
2018
-
2017
-
2016
-
2015
-
2014
-
2013
-
2012
-
2011
-
2010
-
2009
-
2008
-
2007
-
2006
-
2005
-
2004
-
2003
-
The Traymore
N/A
Median Price / ft2
Past 12 months
Past 12 months
2023
-
2022
-
2021
-
2020
-
2019
-
2018
-
2017
-
2016
-
2015
-
2014
-
2013
-
2012
-
2011
-
2010
-
2009
-
2008
-
2007
-
2006
-
2005
-
2004
-
2003
-
The Traymore
N/A
Median Price
Past 12 months
Past 12 months
2023
-
2022
-
2021
-
2020
-
2019
-
2018
-
2017
-
2016
-
2015
-
2014
-
2013
-
2012
-
2011
-
2010
-
2009
-
2008
-
2007
-
2006
-
2005
-
2004
-
2003
-
The Traymore
N/A
Avg. Price / ft2
Past 12 months
Past 12 months
2023
$1,131
2022
-
2021
-
2020
-
2019
-
2018
-
2017
-
2016
-
2015
-
2014
-
2013
$688
2012
-
2011
-
2010
-
2009
-
2008
-
2007
$534
2006
$328
2005
-
2004
-
2003
-
The Traymore
N/A
Avg. Price
Past 12 months
Past 12 months
2023
$880,000
2022
-
2021
-
2020
-
2019
-
2018
-
2017
-
2016
-
2015
-
2014
-
2013
$535,000
2012
-
2011
-
2010
-
2009
-
2008
-
2007
$415,740
2006
$254,261
2005
-
2004
-
2003
-
The Traymore
N/A
Median Price / ft2
Past 12 months
Past 12 months
2023
$1,131
2022
-
2021
-
2020
-
2019
-
2018
-
2017
-
2016
-
2015
-
2014
-
2013
$688
2012
-
2011
-
2010
-
2009
-
2008
-
2007
$534
2006
$328
2005
-
2004
-
2003
-
The Traymore
N/A
Median Price
Past 12 months
Past 12 months
2023
$880,000
2022
-
2021
-
2020
-
2019
-
2018
-
2017
-
2016
-
2015
-
2014
-
2013
$535,000
2012
-
2011
-
2010
-
2009
-
2008
-
2007
$415,740
2006
$254,261
2005
-
2004
-
2003
-
The Traymore
$1,140
Avg. Price / ft2
Past 12 months
Past 12 months
2023
$1,140
2022
$1,171
2021
$878
2020
-
2019
$893
2018
$1,119
2017
$1,026
2016
-
2015
$836
2014
$458
2013
-
2012
-
2011
-
2010
-
2009
$572
2008
-
2007
-
2006
$376
2005
$409
2004
-
2003
-
The Traymore
$1,175,000
Avg. Price
Past 12 months
Past 12 months
2023
$1,175,000
2022
$1,680,000
2021
$905,000
2020
-
2019
$1,451,000
2018
$1,125,000
2017
$1,406,713
2016
-
2015
$1,200,000
2014
$676,744
2013
-
2012
-
2011
-
2010
-
2009
$575,000
2008
-
2007
-
2006
$542,434
2005
$479,426
2004
-
2003
-
The Traymore
$1,140
Median Price / ft2
Past 12 months
Past 12 months
2023
$1,140
2022
$1,171
2021
$878
2020
-
2019
$893
2018
$1,119
2017
$1,026
2016
-
2015
$836
2014
$458
2013
-
2012
-
2011
-
2010
-
2009
$572
2008
-
2007
-
2006
$368
2005
$413
2004
-
2003
-
The Traymore
$1,175,000
Median Price
Past 12 months
Past 12 months
2023
$1,175,000
2022
$1,680,000
2021
$905,000
2020
-
2019
$1,451,000
2018
$1,125,000
2017
$1,406,713
2016
-
2015
$1,200,000
2014
$676,744
2013
-
2012
-
2011
-
2010
-
2009
$575,000
2008
-
2007
-
2006
$494,832
2005
$451,230
2004
-
2003
-
The Traymore
$1,262
Avg. Price / ft2
Past 12 months
Past 12 months
2023
$1,262
2022
$1,076
2021
$1,114
2020
-
2019
$953
2018
-
2017
$821
2016
$942
2015
$924
2014
$992
2013
$579
2012
$556
2011
$564
2010
$555
2009
$530
2008
$547
2007
$456
2006
$417
2005
$373
2004
-
2003
-
The Traymore
$2,050,000
Avg. Price
Past 12 months
Past 12 months
2023
$2,050,000
2022
$1,675,000
2021
$1,735,000
2020
-
2019
$920,000
2018
-
2017
$1,494,500
2016
$1,925,000
2015
$1,835,721
2014
$1,747,500
2013
$1,150,000
2012
$850,000
2011
$870,505
2010
$535,500
2009
$825,000
2008
$1,086,899
2007
$906,242
2006
$642,259
2005
$584,930
2004
-
2003
-
The Traymore
$1,262
Median Price / ft2
Past 12 months
Past 12 months
2023
$1,262
2022
$1,076
2021
$1,114
2020
-
2019
$953
2018
-
2017
$821
2016
$942
2015
$924
2014
$992
2013
$579
2012
$556
2011
$564
2010
$555
2009
$530
2008
$547
2007
$456
2006
$413
2005
$378
2004
-
2003
-
The Traymore
$2,050,000
Median Price
Past 12 months
Past 12 months
2023
$2,050,000
2022
$1,675,000
2021
$1,735,000
2020
-
2019
$920,000
2018
-
2017
$1,494,500
2016
$1,925,000
2015
$1,835,721
2014
$1,747,500
2013
$1,150,000
2012
$850,000
2011
$870,505
2010
$535,500
2009
$825,000
2008
$1,086,899
2007
$906,242
2006
$656,068
2005
$583,559
2004
-
2003
-
The Traymore
N/A
Avg. Price / ft2
Past 12 months
Past 12 months
2023
-
2022
-
2021
-
2020
-
2019
-
2018
$920
2017
-
2016
-
2015
-
2014
$947
2013
-
2012
-
2011
-
2010
-
2009
-
2008
-
2007
-
2006
-
2005
-
2004
-
2003
-
The Traymore
N/A
Avg. Price
Past 12 months
Past 12 months
2023
-
2022
-
2021
-
2020
-
2019
-
2018
$1,880,000
2017
-
2016
-
2015
-
2014
$1,935,693
2013
-
2012
-
2011
-
2010
-
2009
-
2008
-
2007
-
2006
-
2005
-
2004
-
2003
-
The Traymore
N/A
Median Price / ft2
Past 12 months
Past 12 months
2023
-
2022
-
2021
-
2020
-
2019
-
2018
$920
2017
-
2016
-
2015
-
2014
$947
2013
-
2012
-
2011
-
2010
-
2009
-
2008
-
2007
-
2006
-
2005
-
2004
-
2003
-
The Traymore
N/A
Median Price
Past 12 months
Past 12 months
2023
-
2022
-
2021
-
2020
-
2019
-
2018
$1,880,000
2017
-
2016
-
2015
-
2014
$1,935,693
2013
-
2012
-
2011
-
2010
-
2009
-
2008
-
2007
-
2006
-
2005
-
2004
-
2003
-
The Traymore
N/A
Avg. Price / ft2
Past 12 months
Past 12 months
2023
-
2022
-
2021
-
2020
-
2019
-
2018
-
2017
-
2016
-
2015
-
2014
-
2013
-
2012
-
2011
-
2010
-
2009
-
2008
-
2007
-
2006
-
2005
-
2004
-
2003
-
The Traymore
N/A
Avg. Price
Past 12 months
Past 12 months
2023
-
2022
-
2021
-
2020
-
2019
-
2018
-
2017
-
2016
-
2015
-
2014
-
2013
-
2012
-
2011
-
2010
-
2009
-
2008
-
2007
-
2006
-
2005
-
2004
-
2003
-
The Traymore
N/A
Median Price / ft2
Past 12 months
Past 12 months
2023
-
2022
-
2021
-
2020
-
2019
-
2018
-
2017
-
2016
-
2015
-
2014
-
2013
-
2012
-
2011
-
2010
-
2009
-
2008
-
2007
-
2006
-
2005
-
2004
-
2003
-
The Traymore
N/A
Median Price
Past 12 months
Past 12 months
2023
-
2022
-
2021
-
2020
-
2019
-
2018
-
2017
-
2016
-
2015
-
2014
-
2013
-
2012
-
2011
-
2010
-
2009
-
2008
-
2007
-
2006
-
2005
-
2004
-
2003
-