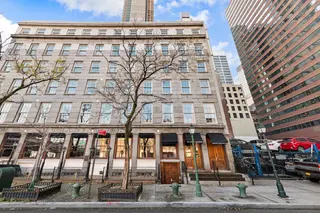
The Ships Chandlery, 170 John Street: Price Comparison
between Front Street & South Street Building Profile
The Ships Chandlery
N/A
Avg. Price / ft2
Past 12 months
Past 12 months
2024
-
2023
$1,283
2022
$1,302
2021
-
2020
-
2019
$1,040
2018
$1,216
2017
$833
2016
-
2015
$661
2014
$956
2013
$839
2012
$808
2011
-
2010
$631
2009
$710
2008
$969
2007
$819
2006
$635
2005
$730
2004
$607
2003
$491
The Ships Chandlery
N/A
Avg. Price
Past 12 months
Past 12 months
2024
-
2023
$2,072,500
2022
$1,200,000
2021
-
2020
-
2019
$520,000
2018
$2,300,000
2017
$1,576,000
2016
-
2015
$850,000
2014
$1,212,500
2013
$1,125,000
2012
$1,100,000
2011
-
2010
$1,170,000
2009
$355,000
2008
$1,025,000
2007
$1,115,000
2006
$1,200,000
2005
$755,000
2004
$425,000
2003
$520,000
The Ships Chandlery
N/A
Median Price / ft2
Past 12 months
Past 12 months
2024
-
2023
$1,283
2022
$1,302
2021
-
2020
-
2019
$1,040
2018
$1,216
2017
$833
2016
-
2015
$661
2014
$956
2013
$839
2012
$808
2011
-
2010
$631
2009
$710
2008
$969
2007
$819
2006
$635
2005
$794
2004
$607
2003
$491
The Ships Chandlery
N/A
Median Price
Past 12 months
Past 12 months
2024
-
2023
$2,072,500
2022
$1,200,000
2021
-
2020
-
2019
$520,000
2018
$2,300,000
2017
$1,576,000
2016
-
2015
$850,000
2014
$1,212,500
2013
$1,125,000
2012
$1,100,000
2011
-
2010
$1,170,000
2009
$355,000
2008
$1,025,000
2007
$1,115,000
2006
$1,200,000
2005
$750,000
2004
$425,000
2003
$520,000
The Ships Chandlery
N/A
Avg. Price / ft2
Past 12 months
Past 12 months
2024
-
2023
-
2022
-
2021
-
2020
-
2019
$1,040
2018
-
2017
-
2016
-
2015
-
2014
-
2013
-
2012
-
2011
-
2010
-
2009
$710
2008
-
2007
-
2006
-
2005
-
2004
-
2003
-
The Ships Chandlery
N/A
Avg. Price
Past 12 months
Past 12 months
2024
-
2023
-
2022
-
2021
-
2020
-
2019
$520,000
2018
-
2017
-
2016
-
2015
-
2014
-
2013
-
2012
-
2011
-
2010
-
2009
$355,000
2008
-
2007
-
2006
-
2005
-
2004
-
2003
-
The Ships Chandlery
N/A
Median Price / ft2
Past 12 months
Past 12 months
2024
-
2023
-
2022
-
2021
-
2020
-
2019
$1,040
2018
-
2017
-
2016
-
2015
-
2014
-
2013
-
2012
-
2011
-
2010
-
2009
$710
2008
-
2007
-
2006
-
2005
-
2004
-
2003
-
The Ships Chandlery
N/A
Median Price
Past 12 months
Past 12 months
2024
-
2023
-
2022
-
2021
-
2020
-
2019
$520,000
2018
-
2017
-
2016
-
2015
-
2014
-
2013
-
2012
-
2011
-
2010
-
2009
$355,000
2008
-
2007
-
2006
-
2005
-
2004
-
2003
-
The Ships Chandlery
N/A
Avg. Price / ft2
Past 12 months
Past 12 months
2024
-
2023
-
2022
$1,302
2021
-
2020
-
2019
-
2018
-
2017
-
2016
-
2015
-
2014
$1,000
2013
-
2012
-
2011
-
2010
-
2009
-
2008
$969
2007
-
2006
-
2005
$819
2004
$607
2003
-
The Ships Chandlery
N/A
Avg. Price
Past 12 months
Past 12 months
2024
-
2023
-
2022
$1,200,000
2021
-
2020
-
2019
-
2018
-
2017
-
2016
-
2015
-
2014
$700,000
2013
-
2012
-
2011
-
2010
-
2009
-
2008
$1,025,000
2007
-
2006
-
2005
$757,500
2004
$425,000
2003
-
The Ships Chandlery
N/A
Median Price / ft2
Past 12 months
Past 12 months
2024
-
2023
-
2022
$1,302
2021
-
2020
-
2019
-
2018
-
2017
-
2016
-
2015
-
2014
$1,000
2013
-
2012
-
2011
-
2010
-
2009
-
2008
$969
2007
-
2006
-
2005
$819
2004
$607
2003
-
The Ships Chandlery
N/A
Median Price
Past 12 months
Past 12 months
2024
-
2023
-
2022
$1,200,000
2021
-
2020
-
2019
-
2018
-
2017
-
2016
-
2015
-
2014
$700,000
2013
-
2012
-
2011
-
2010
-
2009
-
2008
$1,025,000
2007
-
2006
-
2005
$757,500
2004
$425,000
2003
-
The Ships Chandlery
N/A
Avg. Price / ft2
Past 12 months
Past 12 months
2024
-
2023
$1,283
2022
-
2021
-
2020
-
2019
-
2018
$1,216
2017
$833
2016
-
2015
$661
2014
$912
2013
$839
2012
$808
2011
-
2010
-
2009
-
2008
-
2007
$819
2006
$635
2005
-
2004
-
2003
$491
The Ships Chandlery
N/A
Avg. Price
Past 12 months
Past 12 months
2024
-
2023
$2,072,500
2022
-
2021
-
2020
-
2019
-
2018
$2,300,000
2017
$1,576,000
2016
-
2015
$850,000
2014
$1,725,000
2013
$1,125,000
2012
$1,100,000
2011
-
2010
-
2009
-
2008
-
2007
$1,115,000
2006
$1,200,000
2005
-
2004
-
2003
$520,000
The Ships Chandlery
N/A
Median Price / ft2
Past 12 months
Past 12 months
2024
-
2023
$1,283
2022
-
2021
-
2020
-
2019
-
2018
$1,216
2017
$833
2016
-
2015
$661
2014
$912
2013
$839
2012
$808
2011
-
2010
-
2009
-
2008
-
2007
$819
2006
$635
2005
-
2004
-
2003
$491
The Ships Chandlery
N/A
Median Price
Past 12 months
Past 12 months
2024
-
2023
$2,072,500
2022
-
2021
-
2020
-
2019
-
2018
$2,300,000
2017
$1,576,000
2016
-
2015
$850,000
2014
$1,725,000
2013
$1,125,000
2012
$1,100,000
2011
-
2010
-
2009
-
2008
-
2007
$1,115,000
2006
$1,200,000
2005
-
2004
-
2003
$520,000
The Ships Chandlery
N/A
Avg. Price / ft2
Past 12 months
Past 12 months
2024
-
2023
-
2022
-
2021
-
2020
-
2019
-
2018
-
2017
-
2016
-
2015
-
2014
-
2013
-
2012
-
2011
-
2010
$631
2009
-
2008
-
2007
-
2006
-
2005
$553
2004
-
2003
-
The Ships Chandlery
N/A
Avg. Price
Past 12 months
Past 12 months
2024
-
2023
-
2022
-
2021
-
2020
-
2019
-
2018
-
2017
-
2016
-
2015
-
2014
-
2013
-
2012
-
2011
-
2010
$1,170,000
2009
-
2008
-
2007
-
2006
-
2005
$750,000
2004
-
2003
-
The Ships Chandlery
N/A
Median Price / ft2
Past 12 months
Past 12 months
2024
-
2023
-
2022
-
2021
-
2020
-
2019
-
2018
-
2017
-
2016
-
2015
-
2014
-
2013
-
2012
-
2011
-
2010
$631
2009
-
2008
-
2007
-
2006
-
2005
$553
2004
-
2003
-
The Ships Chandlery
N/A
Median Price
Past 12 months
Past 12 months
2024
-
2023
-
2022
-
2021
-
2020
-
2019
-
2018
-
2017
-
2016
-
2015
-
2014
-
2013
-
2012
-
2011
-
2010
$1,170,000
2009
-
2008
-
2007
-
2006
-
2005
$750,000
2004
-
2003
-
The Ships Chandlery
N/A
Avg. Price / ft2
Past 12 months
Past 12 months
2024
-
2023
-
2022
-
2021
-
2020
-
2019
-
2018
-
2017
-
2016
-
2015
-
2014
-
2013
-
2012
-
2011
-
2010
-
2009
-
2008
-
2007
-
2006
-
2005
-
2004
-
2003
-
The Ships Chandlery
N/A
Avg. Price
Past 12 months
Past 12 months
2024
-
2023
-
2022
-
2021
-
2020
-
2019
-
2018
-
2017
-
2016
-
2015
-
2014
-
2013
-
2012
-
2011
-
2010
-
2009
-
2008
-
2007
-
2006
-
2005
-
2004
-
2003
-
The Ships Chandlery
N/A
Median Price / ft2
Past 12 months
Past 12 months
2024
-
2023
-
2022
-
2021
-
2020
-
2019
-
2018
-
2017
-
2016
-
2015
-
2014
-
2013
-
2012
-
2011
-
2010
-
2009
-
2008
-
2007
-
2006
-
2005
-
2004
-
2003
-
The Ships Chandlery
N/A
Median Price
Past 12 months
Past 12 months
2024
-
2023
-
2022
-
2021
-
2020
-
2019
-
2018
-
2017
-
2016
-
2015
-
2014
-
2013
-
2012
-
2011
-
2010
-
2009
-
2008
-
2007
-
2006
-
2005
-
2004
-
2003
-
The Ships Chandlery
N/A
Avg. Price / ft2
Past 12 months
Past 12 months
2024
-
2023
-
2022
-
2021
-
2020
-
2019
-
2018
-
2017
-
2016
-
2015
-
2014
-
2013
-
2012
-
2011
-
2010
-
2009
-
2008
-
2007
-
2006
-
2005
-
2004
-
2003
-
The Ships Chandlery
N/A
Avg. Price
Past 12 months
Past 12 months
2024
-
2023
-
2022
-
2021
-
2020
-
2019
-
2018
-
2017
-
2016
-
2015
-
2014
-
2013
-
2012
-
2011
-
2010
-
2009
-
2008
-
2007
-
2006
-
2005
-
2004
-
2003
-
The Ships Chandlery
N/A
Median Price / ft2
Past 12 months
Past 12 months
2024
-
2023
-
2022
-
2021
-
2020
-
2019
-
2018
-
2017
-
2016
-
2015
-
2014
-
2013
-
2012
-
2011
-
2010
-
2009
-
2008
-
2007
-
2006
-
2005
-
2004
-
2003
-
The Ships Chandlery
N/A
Median Price
Past 12 months
Past 12 months
2024
-
2023
-
2022
-
2021
-
2020
-
2019
-
2018
-
2017
-
2016
-
2015
-
2014
-
2013
-
2012
-
2011
-
2010
-
2009
-
2008
-
2007
-
2006
-
2005
-
2004
-
2003
-
The Fulton Chambers
$1,032
Avg. Price / ft2
Past 12 months
Past 12 months
-
-
$1,156
-
-
-
-
-
$1,425
$1,223
-
$1,049
$854
$728
-
-
$986
$1,117
$866
-
$594
-
The Fulton Chambers
$1,450,000
Avg. Price
Past 12 months
Past 12 months
-
-
$1,625,000
-
-
-
-
-
$2,123,656
$1,950,000
-
$1,475,000
$1,350,000
$1,150,000
-
-
$1,385,000
$2,537,500
$1,360,000
-
$967,438
-
The Fulton Chambers
$1,032
Median Price / ft2
Past 12 months
Past 12 months
-
-
$1,156
-
-
-
-
-
$1,425
$1,223
-
$1,049
$854
$728
-
-
$986
$1,117
$866
-
$580
-
The Fulton Chambers
$1,450,000
Median Price
Past 12 months
Past 12 months
-
-
$1,625,000
-
-
-
-
-
$2,123,656
$1,950,000
-
$1,475,000
$1,350,000
$1,150,000
-
-
$1,385,000
$2,537,500
$1,360,000
-
$890,969
-
The Fulton Chambers
N/A
Avg. Price / ft2
Past 12 months
Past 12 months
-
-
-
-
-
-
-
-
-
-
-
-
-
-
-
-
-
-
-
-
-
-
The Fulton Chambers
N/A
Avg. Price
Past 12 months
Past 12 months
-
-
-
-
-
-
-
-
-
-
-
-
-
-
-
-
-
-
-
-
-
-
The Fulton Chambers
N/A
Median Price / ft2
Past 12 months
Past 12 months
-
-
-
-
-
-
-
-
-
-
-
-
-
-
-
-
-
-
-
-
-
-
The Fulton Chambers
N/A
Median Price
Past 12 months
Past 12 months
-
-
-
-
-
-
-
-
-
-
-
-
-
-
-
-
-
-
-
-
-
-
The Fulton Chambers
N/A
Avg. Price / ft2
Past 12 months
Past 12 months
-
-
-
-
-
-
-
-
-
-
-
-
-
-
-
-
-
-
-
-
-
-
The Fulton Chambers
N/A
Avg. Price
Past 12 months
Past 12 months
-
-
-
-
-
-
-
-
-
-
-
-
-
-
-
-
-
-
-
-
-
-
The Fulton Chambers
N/A
Median Price / ft2
Past 12 months
Past 12 months
-
-
-
-
-
-
-
-
-
-
-
-
-
-
-
-
-
-
-
-
-
-
The Fulton Chambers
N/A
Median Price
Past 12 months
Past 12 months
-
-
-
-
-
-
-
-
-
-
-
-
-
-
-
-
-
-
-
-
-
-
The Fulton Chambers
$1,032
Avg. Price / ft2
Past 12 months
Past 12 months
-
-
$1,156
-
-
-
-
-
$1,425
$1,223
-
$1,049
$854
$728
-
-
$986
-
$866
-
$571
-
The Fulton Chambers
$1,450,000
Avg. Price
Past 12 months
Past 12 months
-
-
$1,625,000
-
-
-
-
-
$2,123,656
$1,950,000
-
$1,475,000
$1,350,000
$1,150,000
-
-
$1,385,000
-
$1,360,000
-
$862,104
-
The Fulton Chambers
$1,032
Median Price / ft2
Past 12 months
Past 12 months
-
-
$1,156
-
-
-
-
-
$1,425
$1,223
-
$1,049
$854
$728
-
-
$986
-
$866
-
$557
-
The Fulton Chambers
$1,450,000
Median Price
Past 12 months
Past 12 months
-
-
$1,625,000
-
-
-
-
-
$2,123,656
$1,950,000
-
$1,475,000
$1,350,000
$1,150,000
-
-
$1,385,000
-
$1,360,000
-
$865,513
-
The Fulton Chambers
N/A
Avg. Price / ft2
Past 12 months
Past 12 months
-
-
-
-
-
-
-
-
-
-
-
-
-
-
-
-
-
$1,117
-
-
$744
-
The Fulton Chambers
N/A
Avg. Price
Past 12 months
Past 12 months
-
-
-
-
-
-
-
-
-
-
-
-
-
-
-
-
-
$2,537,500
-
-
$1,652,111
-
The Fulton Chambers
N/A
Median Price / ft2
Past 12 months
Past 12 months
-
-
-
-
-
-
-
-
-
-
-
-
-
-
-
-
-
$1,117
-
-
$744
-
The Fulton Chambers
N/A
Median Price
Past 12 months
Past 12 months
-
-
-
-
-
-
-
-
-
-
-
-
-
-
-
-
-
$2,537,500
-
-
$1,652,111
-
The Fulton Chambers
N/A
Avg. Price / ft2
Past 12 months
Past 12 months
-
-
-
-
-
-
-
-
-
-
-
-
-
-
-
-
-
-
-
-
-
-
The Fulton Chambers
N/A
Avg. Price
Past 12 months
Past 12 months
-
-
-
-
-
-
-
-
-
-
-
-
-
-
-
-
-
-
-
-
-
-
The Fulton Chambers
N/A
Median Price / ft2
Past 12 months
Past 12 months
-
-
-
-
-
-
-
-
-
-
-
-
-
-
-
-
-
-
-
-
-
-
The Fulton Chambers
N/A
Median Price
Past 12 months
Past 12 months
-
-
-
-
-
-
-
-
-
-
-
-
-
-
-
-
-
-
-
-
-
-
The Fulton Chambers
N/A
Avg. Price / ft2
Past 12 months
Past 12 months
-
-
-
-
-
-
-
-
-
-
-
-
-
-
-
-
-
-
-
-
-
-
The Fulton Chambers
N/A
Avg. Price
Past 12 months
Past 12 months
-
-
-
-
-
-
-
-
-
-
-
-
-
-
-
-
-
-
-
-
-
-
The Fulton Chambers
N/A
Median Price / ft2
Past 12 months
Past 12 months
-
-
-
-
-
-
-
-
-
-
-
-
-
-
-
-
-
-
-
-
-
-
The Fulton Chambers
N/A
Median Price
Past 12 months
Past 12 months
-
-
-
-
-
-
-
-
-
-
-
-
-
-
-
-
-
-
-
-
-
-
Cambridge Club Condominium
$784
Avg. Price / ft2
Past 12 months
Past 12 months
$830
$801
$882
$918
$798
$984
$938
$1,004
$1,058
$1,068
$965
$922
$871
$818
$716
$776
$1,008
$921
$817
$717
-
-
Cambridge Club Condominium
$499,607
Avg. Price
Past 12 months
Past 12 months
$581,056
$509,857
$529,167
$528,333
$569,667
$598,634
$590,000
$799,000
$660,000
$622,214
$617,333
$602,315
$497,100
$493,750
$541,875
$471,875
$570,714
$613,167
$520,506
$468,499
-
-
Cambridge Club Condominium
$832
Median Price / ft2
Past 12 months
Past 12 months
$843
$807
$907
$892
$808
$974
$938
$968
$1,062
$1,042
$948
$935
$855
$832
$704
$736
$997
$893
$851
$703
-
-
Cambridge Club Condominium
$500,000
Median Price
Past 12 months
Past 12 months
$557,500
$500,000
$545,000
$535,000
$575,000
$640,000
$590,000
$750,000
$740,000
$690,000
$655,000
$632,500
$525,000
$525,000
$539,000
$483,750
$643,000
$647,000
$514,216
$451,230
-
-
Cambridge Club Condominium
$869
Avg. Price / ft2
Past 12 months
Past 12 months
$895
$823
$971
$970
$808
$974
$1,040
$968
$1,132
$1,122
$1,005
$955
$887
$884
-
$963
$1,073
$910
$867
$782
-
-
Cambridge Club Condominium
$444,167
Avg. Price
Past 12 months
Past 12 months
$385,000
$395,000
$417,500
$420,000
$535,000
$486,901
$499,000
$750,000
$490,000
$447,750
$520,500
$496,883
$465,125
$380,000
-
$395,000
$439,000
$537,500
$390,541
$396,386
-
-
Cambridge Club Condominium
$941
Median Price / ft2
Past 12 months
Past 12 months
$895
$823
$971
$970
$808
$974
$1,040
$968
$1,132
$1,122
$1,041
$963
$928
$884
-
$963
$1,063
$910
$895
$778
-
-
Cambridge Club Condominium
$400,000
Median Price
Past 12 months
Past 12 months
$385,000
$395,000
$417,500
$420,000
$535,000
$486,901
$499,000
$750,000
$490,000
$447,750
$469,500
$425,650
$466,250
$380,000
-
$395,000
$435,000
$537,500
$380,250
$377,715
-
-
Cambridge Club Condominium
$857
Avg. Price / ft2
Past 12 months
Past 12 months
$808
$797
$837
$891
$793
$989
$836
$960
$1,021
$1,047
$937
$908
$806
$797
$716
$713
$988
$926
$810
$685
-
-
Cambridge Club Condominium
$555,250
Avg. Price
Past 12 months
Past 12 months
$556,357
$529,000
$585,000
$582,500
$587,000
$654,500
$681,000
$675,000
$745,000
$692,000
$681,889
$647,500
$625,000
$531,667
$541,875
$497,500
$667,667
$651,000
$572,166
$479,658
-
-
Cambridge Club Condominium
$832
Median Price / ft2
Past 12 months
Past 12 months
$796
$795
$837
$891
$793
$989
$836
$960
$1,021
$1,042
$928
$926
$806
$823
$704
$721
$997
$893
$851
$645
-
-
Cambridge Club Condominium
$555,750
Median Price
Past 12 months
Past 12 months
$557,500
$507,500
$585,000
$582,500
$587,000
$654,500
$681,000
$675,000
$745,000
$690,000
$680,000
$640,000
$625,000
$545,000
$539,000
$490,000
$660,000
$652,000
$572,610
$461,370
-
-
Cambridge Club Condominium
$587
Avg. Price / ft2
Past 12 months
Past 12 months
$921
-
-
-
-
-
-
$1,066
-
-
-
-
-
-
-
-
$871
-
$692
$665
-
-
Cambridge Club Condominium
$499,000
Avg. Price
Past 12 months
Past 12 months
$950,000
-
-
-
-
-
-
$947,500
-
-
-
-
-
-
-
-
$675,000
-
$609,317
$669,678
-
-
Cambridge Club Condominium
$587
Median Price / ft2
Past 12 months
Past 12 months
$921
-
-
-
-
-
-
$1,066
-
-
-
-
-
-
-
-
$871
-
$654
$672
-
-
Cambridge Club Condominium
$499,000
Median Price
Past 12 months
Past 12 months
$950,000
-
-
-
-
-
-
$947,500
-
-
-
-
-
-
-
-
$675,000
-
$507,000
$717,866
-
-
Cambridge Club Condominium
N/A
Avg. Price / ft2
Past 12 months
Past 12 months
-
-
-
-
-
-
-
-
-
-
-
-
-
-
-
-
-
-
-
-
-
-
Cambridge Club Condominium
N/A
Avg. Price
Past 12 months
Past 12 months
-
-
-
-
-
-
-
-
-
-
-
-
-
-
-
-
-
-
-
-
-
-
Cambridge Club Condominium
N/A
Median Price / ft2
Past 12 months
Past 12 months
-
-
-
-
-
-
-
-
-
-
-
-
-
-
-
-
-
-
-
-
-
-
Cambridge Club Condominium
N/A
Median Price
Past 12 months
Past 12 months
-
-
-
-
-
-
-
-
-
-
-
-
-
-
-
-
-
-
-
-
-
-
Cambridge Club Condominium
N/A
Avg. Price / ft2
Past 12 months
Past 12 months
-
-
-
-
-
-
-
-
-
-
-
-
-
-
-
-
-
-
-
-
-
-
Cambridge Club Condominium
N/A
Avg. Price
Past 12 months
Past 12 months
-
-
-
-
-
-
-
-
-
-
-
-
-
-
-
-
-
-
-
-
-
-
Cambridge Club Condominium
N/A
Median Price / ft2
Past 12 months
Past 12 months
-
-
-
-
-
-
-
-
-
-
-
-
-
-
-
-
-
-
-
-
-
-
Cambridge Club Condominium
N/A
Median Price
Past 12 months
Past 12 months
-
-
-
-
-
-
-
-
-
-
-
-
-
-
-
-
-
-
-
-
-
-


