The Peter James, 201 East 25th Street: Price Comparison
between Third Avenue & Second Avenue Building Profile
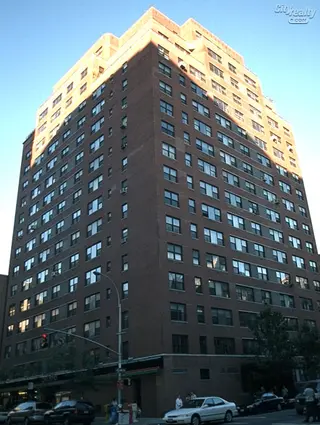
The Peter James
$867,332
Avg. Price
Past 12 months
Past 12 months
2025
$765,000
2024
$882,333
2023
$569,750
2022
$907,958
2021
$848,300
2020
$1,435,677
2019
$983,333
2018
$937,889
2017
$999,236
2016
$986,500
2015
$827,188
2014
$979,444
2013
$534,384
2012
$875,000
2011
$692,500
2010
$436,667
2009
$545,150
2008
$580,012
2007
$609,908
2006
$695,550
2005
$666,929
2004
$454,831
2003
$630,836
The Peter James
$743,323
Median Price
Past 12 months
Past 12 months
2025
$575,000
2024
$755,000
2023
$579,500
2022
$755,000
2021
$660,000
2020
$1,411,354
2019
$850,000
2018
$760,000
2017
$844,209
2016
$779,000
2015
$710,000
2014
$725,000
2013
$565,000
2012
$875,000
2011
$562,500
2010
$375,000
2009
$550,000
2008
$569,000
2007
$558,225
2006
$550,000
2005
$498,400
2004
$425,000
2003
$535,000
The Peter James
N/A
Avg. Price
Past 12 months
Past 12 months
2025
$535,000
2024
-
2023
$472,000
2022
$395,000
2021
-
2020
-
2019
$600,000
2018
$518,667
2017
-
2016
-
2015
$512,500
2014
$500,000
2013
$415,500
2012
-
2011
$390,000
2010
$375,000
2009
$445,000
2008
$538,195
2007
$375,000
2006
$423,852
2005
$275,000
2004
$287,740
2003
$215,000
The Peter James
N/A
Median Price
Past 12 months
Past 12 months
2025
$535,000
2024
-
2023
$472,000
2022
$395,000
2021
-
2020
-
2019
$600,000
2018
$518,500
2017
-
2016
-
2015
$512,500
2014
$500,000
2013
$403,500
2012
-
2011
$390,000
2010
$375,000
2009
$445,000
2008
$470,085
2007
$375,000
2006
$423,852
2005
$275,000
2004
$287,740
2003
$215,000
The Peter James
$668,331
Avg. Price
Past 12 months
Past 12 months
2025
$630,000
2024
$698,500
2023
$703,500
2022
$726,250
2021
$680,375
2020
-
2019
$850,000
2018
$785,000
2017
$801,355
2016
$755,833
2015
$635,833
2014
$597,638
2013
$602,318
2012
$535,000
2011
$566,250
2010
$467,500
2009
$570,188
2008
$611,375
2007
$558,225
2006
$490,000
2005
$519,086
2004
$422,600
2003
$360,000
The Peter James
$679,162
Median Price
Past 12 months
Past 12 months
2025
$575,000
2024
$698,500
2023
$703,500
2022
$725,000
2021
$660,000
2020
-
2019
$850,000
2018
$785,000
2017
$792,209
2016
$748,500
2015
$670,000
2014
$648,400
2013
$625,000
2012
$535,000
2011
$562,500
2010
$467,500
2009
$578,125
2008
$613,500
2007
$558,225
2006
$495,000
2005
$495,000
2004
$425,000
2003
$360,000
The Peter James
$1,049,000
Avg. Price
Past 12 months
Past 12 months
2025
$1,400,000
2024
$1,250,000
2023
-
2022
$805,703
2021
$1,520,000
2020
$1,330,902
2019
$1,500,000
2018
$1,545,000
2017
$1,350,000
2016
$1,332,500
2015
$1,100,000
2014
$1,585,000
2013
-
2012
$1,215,000
2011
$1,225,000
2010
-
2009
-
2008
-
2007
$896,500
2006
$991,667
2005
$690,000
2004
$470,000
2003
$701,950
The Peter James
$1,049,000
Median Price
Past 12 months
Past 12 months
2025
$1,400,000
2024
$1,250,000
2023
-
2022
$805,703
2021
$1,520,000
2020
$1,322,707
2019
$1,500,000
2018
$1,545,000
2017
$1,350,000
2016
$1,332,500
2015
$1,100,000
2014
$1,585,000
2013
-
2012
$1,215,000
2011
$1,225,000
2010
-
2009
-
2008
-
2007
$896,500
2006
$1,110,000
2005
$690,000
2004
$470,000
2003
$730,849
The Peter James
$1,300,000
Avg. Price
Past 12 months
Past 12 months
2025
-
2024
-
2023
-
2022
$2,250,000
2021
-
2020
-
2019
-
2018
$1,652,500
2017
$1,440,000
2016
-
2015
$1,485,000
2014
$1,775,000
2013
-
2012
-
2011
$1,270,000
2010
-
2009
-
2008
-
2007
-
2006
-
2005
-
2004
$935,000
2003
-
The Peter James
$1,300,000
Median Price
Past 12 months
Past 12 months
2025
-
2024
-
2023
-
2022
$2,250,000
2021
-
2020
-
2019
-
2018
$1,652,500
2017
$1,440,000
2016
-
2015
$1,485,000
2014
$1,775,000
2013
-
2012
-
2011
$1,270,000
2010
-
2009
-
2008
-
2007
-
2006
-
2005
-
2004
$935,000
2003
-
The Peter James
N/A
Avg. Price
Past 12 months
Past 12 months
2025
-
2024
-
2023
-
2022
-
2021
-
2020
$1,750,000
2019
-
2018
-
2017
-
2016
-
2015
-
2014
-
2013
-
2012
-
2011
-
2010
-
2009
-
2008
-
2007
-
2006
-
2005
-
2004
-
2003
-
The Peter James
N/A
Median Price
Past 12 months
Past 12 months
2025
-
2024
-
2023
-
2022
-
2021
-
2020
$1,750,000
2019
-
2018
-
2017
-
2016
-
2015
-
2014
-
2013
-
2012
-
2011
-
2010
-
2009
-
2008
-
2007
-
2006
-
2005
-
2004
-
2003
-
The Peter James
N/A
Avg. Price
Past 12 months
Past 12 months
2025
-
2024
-
2023
-
2022
-
2021
-
2020
-
2019
-
2018
-
2017
-
2016
-
2015
-
2014
-
2013
-
2012
-
2011
-
2010
-
2009
-
2008
-
2007
-
2006
-
2005
$1,775,000
2004
-
2003
$1,375,000
The Peter James
N/A
Median Price
Past 12 months
Past 12 months
2025
-
2024
-
2023
-
2022
-
2021
-
2020
-
2019
-
2018
-
2017
-
2016
-
2015
-
2014
-
2013
-
2012
-
2011
-
2010
-
2009
-
2008
-
2007
-
2006
-
2005
$1,775,000
2004
-
2003
$1,375,000
Gramercy Arms
N/A
Avg. Price / ft2
Past 12 months
Past 12 months
-
$1,160
$1,146
$1,519
$1,213
-
$1,021
$1,681
$1,184
$1,372
$1,115
$1,156
$1,028
-
$949
$948
$934
-
$937
$831
$899
$750
$700
Gramercy Arms
$1,375,000
Avg. Price
Past 12 months
Past 12 months
$1,375,000
$1,222,500
$725,625
$1,595,000
$707,500
$1,430,000
$715,000
$982,750
$860,854
$1,150,000
$669,167
$715,625
$686,250
$608,500
$665,000
$995,000
$572,000
-
$711,583
$538,883
$514,375
$488,800
$520,000
Gramercy Arms
$1,375,000
Median Price
Past 12 months
Past 12 months
$1,375,000
$807,500
$707,500
$1,595,000
$730,000
$1,430,000
$715,000
$835,000
$745,000
$1,150,000
$657,500
$683,750
$660,000
$608,500
$685,000
$995,000
$572,000
-
$645,500
$531,400
$558,750
$499,000
$415,000
Gramercy Arms
N/A
Avg. Price / ft2
Past 12 months
Past 12 months
-
-
-
-
-
-
-
-
-
-
-
-
-
-
-
-
-
-
-
-
-
-
-
Gramercy Arms
N/A
Avg. Price
Past 12 months
Past 12 months
-
-
-
-
-
-
-
-
-
-
-
-
-
-
-
-
-
-
-
-
$350,000
-
-
Gramercy Arms
N/A
Median Price
Past 12 months
Past 12 months
-
-
-
-
-
-
-
-
-
-
-
-
-
-
-
-
-
-
-
-
$350,000
-
-
Gramercy Arms
N/A
Avg. Price / ft2
Past 12 months
Past 12 months
-
$1,160
$1,146
-
$1,213
-
$1,021
$1,886
$1,057
-
$1,115
$1,156
$1,028
-
-
-
$934
-
$937
$825
$990
$750
-
Gramercy Arms
$700,000
Avg. Price
Past 12 months
Past 12 months
$700,000
$745,000
$725,625
-
$707,500
-
$715,000
$926,667
$722,531
-
$669,167
$629,167
$686,250
$608,500
$485,000
-
$572,000
-
$615,700
$520,160
$585,000
$471,000
$412,500
Gramercy Arms
$700,000
Median Price
Past 12 months
Past 12 months
$700,000
$745,000
$707,500
-
$730,000
-
$715,000
$835,000
$719,500
-
$657,500
$675,000
$660,000
$608,500
$485,000
-
$572,000
-
$640,000
$485,000
$585,000
$479,500
$412,500
Gramercy Arms
N/A
Avg. Price / ft2
Past 12 months
Past 12 months
-
-
-
$1,519
-
-
-
$1,270
$1,247
$1,372
-
-
-
-
$949
$948
-
-
-
$843
$717
-
$700
Gramercy Arms
$2,050,000
Avg. Price
Past 12 months
Past 12 months
$2,050,000
-
-
$1,595,000
-
$1,430,000
-
$1,066,875
$1,137,500
$1,150,000
-
$975,000
-
-
$755,000
$995,000
-
-
$1,191,000
$632,500
$537,500
-
$735,000
Gramercy Arms
$2,050,000
Median Price
Past 12 months
Past 12 months
$2,050,000
-
-
$1,595,000
-
$1,430,000
-
$1,066,875
$1,137,500
$1,150,000
-
$975,000
-
-
$755,000
$995,000
-
-
$1,191,000
$632,500
$537,500
-
$735,000
Gramercy Arms
N/A
Avg. Price / ft2
Past 12 months
Past 12 months
-
-
-
-
-
-
-
-
-
-
-
-
-
-
-
-
-
-
-
-
-
-
-
Gramercy Arms
N/A
Avg. Price
Past 12 months
Past 12 months
-
-
-
-
-
-
-
-
-
-
-
-
-
-
-
-
-
-
-
-
-
-
-
Gramercy Arms
N/A
Median Price
Past 12 months
Past 12 months
-
-
-
-
-
-
-
-
-
-
-
-
-
-
-
-
-
-
-
-
-
-
-
Gramercy Arms
N/A
Avg. Price / ft2
Past 12 months
Past 12 months
-
-
-
-
-
-
-
-
-
-
-
-
-
-
-
-
-
-
-
-
-
-
-
Gramercy Arms
N/A
Avg. Price
Past 12 months
Past 12 months
-
$2,550,000
-
-
-
-
-
-
-
-
-
-
-
-
-
-
-
-
-
-
-
-
-
Gramercy Arms
N/A
Median Price
Past 12 months
Past 12 months
-
$2,550,000
-
-
-
-
-
-
-
-
-
-
-
-
-
-
-
-
-
-
-
-
-
Gramercy Arms
N/A
Avg. Price / ft2
Past 12 months
Past 12 months
-
-
-
-
-
-
-
-
-
-
-
-
-
-
-
-
-
-
-
-
-
-
-
Gramercy Arms
N/A
Avg. Price
Past 12 months
Past 12 months
-
-
-
-
-
-
-
-
-
-
-
-
-
-
-
-
-
-
-
-
-
-
-
Gramercy Arms
N/A
Median Price
Past 12 months
Past 12 months
-
-
-
-
-
-
-
-
-
-
-
-
-
-
-
-
-
-
-
-
-
-
-
The Gotham House
N/A
Avg. Price / ft2
Past 12 months
Past 12 months
-
-
$889
$980
$759
-
$878
$1,093
$965
-
-
$729
$607
$718
$670
$666
$690
$769
$867
$687
$583
$556
-
The Gotham House
$721,000
Avg. Price
Past 12 months
Past 12 months
-
$649,969
$400,000
$577,500
$458,250
-
$435,000
$410,000
$595,000
$478,167
$470,000
$376,667
$498,000
$320,200
$361,250
$449,000
$496,500
$498,333
$325,000
$382,000
$460,000
$292,400
$187,000
The Gotham House
$721,000
Median Price
Past 12 months
Past 12 months
-
$462,500
$400,000
$577,500
$474,000
-
$410,000
$410,000
$595,000
$510,000
$470,000
$305,000
$405,000
$297,000
$361,250
$449,000
$496,500
$510,000
$325,000
$382,000
$475,000
$292,400
$187,000
The Gotham House
N/A
Avg. Price / ft2
Past 12 months
Past 12 months
-
-
$889
-
$950
-
$988
$1,093
-
-
-
-
$660
$767
$719
-
-
-
$867
$642
-
$550
-
The Gotham House
N/A
Avg. Price
Past 12 months
Past 12 months
-
$410,000
$400,000
$420,000
$380,000
-
$402,500
$410,000
-
$389,500
-
$302,500
$297,000
$291,875
$287,500
-
-
-
$325,000
$289,000
-
$219,800
$187,000
The Gotham House
N/A
Median Price
Past 12 months
Past 12 months
-
$410,000
$400,000
$420,000
$380,000
-
$402,500
$410,000
-
$389,500
-
$302,500
$297,000
$296,750
$287,500
-
-
-
$325,000
$289,000
-
$219,800
$187,000
The Gotham House
N/A
Avg. Price / ft2
Past 12 months
Past 12 months
-
-
-
$980
$695
-
$769
-
$965
-
-
$729
$554
$619
$621
$666
$690
$769
-
$731
$583
$562
-
The Gotham House
$592,000
Avg. Price
Past 12 months
Past 12 months
-
$515,000
-
$735,000
$484,333
-
$500,000
-
$595,000
$522,500
$470,000
$525,000
$405,000
$433,500
$435,000
$449,000
$496,500
$498,333
-
$475,000
$460,000
$365,000
-
The Gotham House
$592,000
Median Price
Past 12 months
Past 12 months
-
$515,000
-
$735,000
$480,500
-
$500,000
-
$595,000
$522,500
$470,000
$525,000
$405,000
$433,500
$435,000
$449,000
$496,500
$510,000
-
$475,000
$475,000
$365,000
-
The Gotham House
N/A
Avg. Price / ft2
Past 12 months
Past 12 months
-
-
-
-
-
-
-
-
-
-
-
-
-
-
-
-
-
-
-
-
-
-
-
The Gotham House
N/A
Avg. Price
Past 12 months
Past 12 months
-
-
-
-
-
-
-
-
-
-
-
-
$885,000
-
-
-
-
-
-
-
-
-
-
The Gotham House
N/A
Median Price
Past 12 months
Past 12 months
-
-
-
-
-
-
-
-
-
-
-
-
$885,000
-
-
-
-
-
-
-
-
-
-
The Gotham House
N/A
Avg. Price / ft2
Past 12 months
Past 12 months
-
-
-
-
-
-
-
-
-
-
-
-
-
-
-
-
-
-
-
-
-
-
-
The Gotham House
N/A
Avg. Price
Past 12 months
Past 12 months
-
$1,291,875
-
-
-
-
-
-
-
-
-
-
-
-
-
-
-
-
-
-
-
-
-
The Gotham House
N/A
Median Price
Past 12 months
Past 12 months
-
$1,291,875
-
-
-
-
-
-
-
-
-
-
-
-
-
-
-
-
-
-
-
-
-
The Gotham House
N/A
Avg. Price / ft2
Past 12 months
Past 12 months
-
-
-
-
-
-
-
-
-
-
-
-
-
-
-
-
-
-
-
-
-
-
-
The Gotham House
N/A
Avg. Price
Past 12 months
Past 12 months
-
-
-
-
-
-
-
-
-
-
-
-
-
-
-
-
-
-
-
-
-
-
-
The Gotham House
N/A
Median Price
Past 12 months
Past 12 months
-
-
-
-
-
-
-
-
-
-
-
-
-
-
-
-
-
-
-
-
-
-
-
The Gotham House
N/A
Avg. Price / ft2
Past 12 months
Past 12 months
-
-
-
-
-
-
-
-
-
-
-
-
-
-
-
-
-
-
-
-
-
-
-
The Gotham House
N/A
Avg. Price
Past 12 months
Past 12 months
-
-
-
-
-
-
-
-
-
-
-
-
-
-
-
-
-
-
-
-
-
-
-
The Gotham House
N/A
Median Price
Past 12 months
Past 12 months
-
-
-
-
-
-
-
-
-
-
-
-
-
-
-
-
-
-
-
-
-
-
-
82 Irving Place
N/A
Avg. Price / ft2
Past 12 months
Past 12 months
-
$1,140
-
$1,045
$1,148
-
$1,035
-
-
$1,038
-
-
$1,009
$900
$842
$694
-
$1,007
$689
-
$1,182
$596
-
82 Irving Place
$642,500
Avg. Price
Past 12 months
Past 12 months
$781,667
$917,000
$630,000
$345,000
$777,667
-
$1,476,833
$2,685,000
$661,667
$719,500
-
$1,215,833
$807,000
$577,500
$801,250
$590,000
-
$880,833
$552,625
$632,000
$523,750
$483,090
$419,375
82 Irving Place
$642,500
Median Price
Past 12 months
Past 12 months
$775,000
$917,000
$630,000
$345,000
$777,667
-
$727,500
$2,685,000
$615,000
$719,500
-
$515,000
$807,000
$630,000
$801,250
$590,000
-
$716,000
$580,000
$632,000
$523,750
$475,000
$421,250
82 Irving Place
N/A
Avg. Price / ft2
Past 12 months
Past 12 months
-
-
-
$1,045
-
-
-
-
-
-
-
-
-
-
-
-
-
-
-
-
-
$785
-
82 Irving Place
$510,000
Avg. Price
Past 12 months
Past 12 months
-
-
-
$345,000
-
-
-
-
-
-
-
-
-
-
-
-
-
-
-
-
-
$259,000
-
82 Irving Place
$510,000
Median Price
Past 12 months
Past 12 months
-
-
-
$345,000
-
-
-
-
-
-
-
-
-
-
-
-
-
-
-
-
-
$259,000
-
82 Irving Place
N/A
Avg. Price / ft2
Past 12 months
Past 12 months
-
$1,140
-
-
$1,148
-
$1,035
-
-
$1,038
-
-
$1,009
$900
-
$694
-
$853
$877
-
$1,182
$656
-
82 Irving Place
$775,000
Avg. Price
Past 12 months
Past 12 months
$781,667
$917,000
$630,000
-
$777,667
-
$721,250
-
$661,667
$719,500
-
$481,250
$807,000
$551,250
$507,500
$590,000
-
$640,000
$617,167
-
$523,750
$474,361
$421,250
82 Irving Place
$775,000
Median Price
Past 12 months
Past 12 months
$775,000
$917,000
$630,000
-
$777,667
-
$721,250
-
$615,000
$719,500
-
$481,250
$807,000
$551,250
$507,500
$590,000
-
$631,000
$685,000
-
$523,750
$505,000
$421,250
82 Irving Place
N/A
Avg. Price / ft2
Past 12 months
Past 12 months
-
-
-
-
-
-
-
-
-
-
-
-
-
-
$842
-
-
$1,162
$314
-
-
$228
-
82 Irving Place
N/A
Avg. Price
Past 12 months
Past 12 months
-
-
-
-
-
-
-
$2,685,000
-
-
-
$2,685,000
-
-
$1,095,000
-
-
$1,975,000
$359,000
-
-
$260,000
-
82 Irving Place
N/A
Median Price
Past 12 months
Past 12 months
-
-
-
-
-
-
-
$2,685,000
-
-
-
$2,685,000
-
-
$1,095,000
-
-
$1,975,000
$359,000
-
-
$260,000
-
82 Irving Place
N/A
Avg. Price / ft2
Past 12 months
Past 12 months
-
-
-
-
-
-
-
-
-
-
-
-
-
-
-
-
-
-
-
-
-
-
-
82 Irving Place
N/A
Avg. Price
Past 12 months
Past 12 months
-
-
-
-
-
-
$2,988,000
-
-
-
-
-
-
-
-
-
-
-
-
-
-
-
-
82 Irving Place
N/A
Median Price
Past 12 months
Past 12 months
-
-
-
-
-
-
$2,988,000
-
-
-
-
-
-
-
-
-
-
-
-
-
-
-
-
82 Irving Place
N/A
Avg. Price / ft2
Past 12 months
Past 12 months
-
-
-
-
-
-
-
-
-
-
-
-
-
-
-
-
-
-
-
-
-
-
-
82 Irving Place
N/A
Avg. Price
Past 12 months
Past 12 months
-
-
-
-
-
-
-
-
-
-
-
-
-
-
-
-
-
-
-
-
-
-
-
82 Irving Place
N/A
Median Price
Past 12 months
Past 12 months
-
-
-
-
-
-
-
-
-
-
-
-
-
-
-
-
-
-
-
-
-
-
-
82 Irving Place
N/A
Avg. Price / ft2
Past 12 months
Past 12 months
-
-
-
-
-
-
-
-
-
-
-
-
-
-
-
-
-
-
-
-
-
-
-
82 Irving Place
N/A
Avg. Price
Past 12 months
Past 12 months
-
-
-
-
-
-
-
-
-
-
-
-
-
-
-
-
-
-
-
-
-
-
-
82 Irving Place
N/A
Median Price
Past 12 months
Past 12 months
-
-
-
-
-
-
-
-
-
-
-
-
-
-
-
-
-
-
-
-
-
-
-
Gramercy Plaza
$1,315
Avg. Price / ft2
Past 12 months
Past 12 months
$1,315
$1,308
$991
$1,269
$1,154
$1,279
$1,296
$1,192
$1,272
$1,374
$1,350
$957
$1,015
$895
$973
$858
$865
$1,018
$979
$901
$765
$560
$590
Gramercy Plaza
$736,615
Avg. Price
Past 12 months
Past 12 months
$885,833
$1,191,800
$764,422
$1,042,500
$900,000
$1,352,500
$768,667
$798,500
$845,490
$875,583
$933,583
$735,025
$875,800
$731,944
$563,500
$778,600
$676,095
$618,700
$944,038
$635,400
$623,765
$424,458
$370,292
Gramercy Plaza
$700,000
Median Price
Past 12 months
Past 12 months
$855,000
$788,000
$850,000
$707,500
$555,000
$1,352,500
$620,000
$798,000
$755,000
$785,500
$810,000
$695,250
$650,000
$710,000
$562,500
$550,000
$557,025
$557,800
$890,000
$638,750
$535,000
$325,000
$380,000
Gramercy Plaza
N/A
Avg. Price / ft2
Past 12 months
Past 12 months
-
$1,274
$818
$1,248
$1,115
-
$1,177
$1,190
$1,211
-
$1,164
$899
$817
$737
-
$835
$759
$944
$926
$739
$767
$491
-
Gramercy Plaza
$571,667
Avg. Price
Past 12 months
Past 12 months
$565,000
$585,500
$513,333
$607,143
$526,667
-
$577,500
$727,250
$625,000
$591,667
$660,333
$545,333
$476,500
$382,500
$508,000
$470,000
$445,363
$415,150
$464,100
$454,667
$426,833
$289,700
$233,000
Gramercy Plaza
$550,000
Median Price
Past 12 months
Past 12 months
$565,000
$585,500
$525,000
$575,000
$515,000
-
$577,500
$699,500
$607,500
$575,000
$611,000
$509,000
$457,500
$382,500
$395,000
$470,000
$441,090
$425,000
$455,000
$399,000
$427,500
$291,000
$240,000
Gramercy Plaza
$1,315
Avg. Price / ft2
Past 12 months
Past 12 months
$1,315
-
$1,107
$1,233
-
$1,279
$1,535
$1,193
$1,313
$1,521
$1,537
$996
$1,068
$934
$973
$905
$895
$1,037
$1,114
$942
$763
-
$590
Gramercy Plaza
$878,000
Avg. Price
Past 12 months
Past 12 months
$1,046,250
$788,000
$855,714
$832,500
$925,000
$1,215,000
$1,151,000
$846,000
$882,169
$1,091,750
$999,250
$868,611
$735,000
$777,500
$730,000
$626,500
$593,150
$822,250
$990,750
$712,857
$603,429
$465,375
$441,357
Gramercy Plaza
$855,000
Median Price
Past 12 months
Past 12 months
$1,046,250
$788,000
$885,000
$832,500
$925,000
$1,215,000
$1,151,000
$850,000
$876,925
$1,091,750
$900,000
$825,000
$720,000
$725,000
$730,000
$626,500
$592,500
$710,000
$986,500
$699,000
$585,000
$440,000
$425,000
Gramercy Plaza
N/A
Avg. Price / ft2
Past 12 months
Past 12 months
-
$1,375
-
-
$1,271
-
-
-
-
$1,079
-
-
$1,250
$1,021
-
-
-
-
$866
-
-
-
-
Gramercy Plaza
N/A
Avg. Price
Past 12 months
Past 12 months
-
$2,000,000
-
-
$1,995,000
-
-
-
$1,875,000
$1,295,000
$1,425,000
-
$1,500,000
$1,225,000
-
-
$1,200,000
-
$1,039,000
-
$1,450,000
-
-
Gramercy Plaza
N/A
Median Price
Past 12 months
Past 12 months
-
$2,000,000
-
-
$1,995,000
-
-
-
$1,875,000
$1,295,000
$1,425,000
-
$1,500,000
$1,225,000
-
-
$1,200,000
-
$1,039,000
-
$1,450,000
-
-
Gramercy Plaza
N/A
Avg. Price / ft2
Past 12 months
Past 12 months
-
-
-
-
-
-
-
-
-
-
-
-
-
-
-
$810
$1,018
-
-
-
-
$768
-
Gramercy Plaza
N/A
Avg. Price
Past 12 months
Past 12 months
-
-
-
-
-
-
-
-
-
-
-
-
$1,750,000
-
-
$1,700,000
$1,425,000
-
-
-
-
$1,075,000
-
Gramercy Plaza
N/A
Median Price
Past 12 months
Past 12 months
-
-
-
-
-
-
-
-
-
-
-
-
$1,750,000
-
-
$1,700,000
$1,425,000
-
-
-
-
$1,075,000
-
Gramercy Plaza
N/A
Avg. Price / ft2
Past 12 months
Past 12 months
-
-
-
-
-
-
-
-
-
-
-
-
-
-
-
-
-
-
-
-
-
-
-
Gramercy Plaza
N/A
Avg. Price
Past 12 months
Past 12 months
-
-
-
-
-
-
-
-
-
-
-
-
-
-
-
-
-
-
$2,300,000
-
-
-
-
Gramercy Plaza
N/A
Median Price
Past 12 months
Past 12 months
-
-
-
-
-
-
-
-
-
-
-
-
-
-
-
-
-
-
$2,300,000
-
-
-
-
Gramercy Plaza
N/A
Avg. Price / ft2
Past 12 months
Past 12 months
-
-
-
$1,367
-
-
-
-
-
-
-
-
-
-
-
-
-
-
-
-
-
-
-
Gramercy Plaza
N/A
Avg. Price
Past 12 months
Past 12 months
-
-
-
$4,510,000
-
-
-
-
-
-
-
-
-
-
-
-
-
-
-
-
-
-
-
Gramercy Plaza
N/A
Median Price
Past 12 months
Past 12 months
-
-
-
$4,510,000
-
-
-
-
-
-
-
-
-
-
-
-
-
-
-
-
-
-
-
Gregory House
$655
Avg. Price / ft2
Past 12 months
Past 12 months
$622
-
$670
$603
$603
-
$579
$413
-
$653
$654
$538
$554
$594
$500
$724
$553
$655
$633
$517
$608
$496
-
Gregory House
$453,500
Avg. Price
Past 12 months
Past 12 months
$529,000
$358,000
$360,000
$496,200
$430,000
$349,750
$469,500
$348,865
-
$575,000
$357,296
$403,302
$372,750
$475,000
$350,000
$380,000
$332,000
$360,000
$452,333
$377,750
$370,500
$344,750
-
Gregory House
$453,500
Median Price
Past 12 months
Past 12 months
$529,000
$358,000
$360,000
$495,600
$450,000
$349,750
$469,500
$365,000
-
$575,000
$353,000
$403,302
$372,750
$475,000
$400,000
$380,000
$332,000
$360,000
$462,000
$400,500
$327,500
$384,500
-
Gregory House
$687
Avg. Price / ft2
Past 12 months
Past 12 months
-
-
$670
-
$627
-
-
-
-
-
$654
-
$605
-
-
$724
$553
$655
$679
$648
$582
-
-
Gregory House
$378,000
Avg. Price
Past 12 months
Past 12 months
-
$358,000
$360,000
-
$345,000
$349,750
-
$365,000
-
-
$357,296
-
$333,000
-
$150,000
$380,000
$332,000
$360,000
$365,000
$340,000
$318,333
$160,000
-
Gregory House
$378,000
Median Price
Past 12 months
Past 12 months
-
$358,000
$360,000
-
$345,000
$349,750
-
$365,000
-
-
$353,000
-
$333,000
-
$150,000
$380,000
$332,000
$360,000
$365,000
$340,000
$325,000
$160,000
-
Gregory House
$622
Avg. Price / ft2
Past 12 months
Past 12 months
$622
-
-
$603
$591
-
$579
$413
-
$653
-
$538
$503
$594
$500
-
-
-
$609
$474
$659
$496
-
Gregory House
$529,000
Avg. Price
Past 12 months
Past 12 months
$529,000
-
-
$496,200
$472,500
-
$469,500
$340,797
-
$575,000
-
$403,302
$412,500
$475,000
$450,000
-
-
-
$496,000
$390,333
$527,000
$406,333
-
Gregory House
$529,000
Median Price
Past 12 months
Past 12 months
$529,000
-
-
$495,600
$472,500
-
$469,500
$340,797
-
$575,000
-
$403,302
$412,500
$475,000
$450,000
-
-
-
$527,500
$461,000
$527,000
$389,000
-
Gregory House
N/A
Avg. Price / ft2
Past 12 months
Past 12 months
-
-
-
-
-
-
-
-
-
-
-
-
-
-
-
-
-
-
-
-
-
-
-
Gregory House
N/A
Avg. Price
Past 12 months
Past 12 months
-
-
-
-
-
-
-
-
-
-
-
-
-
-
-
-
-
-
-
-
-
-
-
Gregory House
N/A
Median Price
Past 12 months
Past 12 months
-
-
-
-
-
-
-
-
-
-
-
-
-
-
-
-
-
-
-
-
-
-
-
Gregory House
N/A
Avg. Price / ft2
Past 12 months
Past 12 months
-
-
-
-
-
-
-
-
-
-
-
-
-
-
-
-
-
-
-
-
-
-
-
Gregory House
N/A
Avg. Price
Past 12 months
Past 12 months
-
-
-
-
-
-
-
-
-
-
-
-
-
-
-
-
-
-
-
-
-
-
-
Gregory House
N/A
Median Price
Past 12 months
Past 12 months
-
-
-
-
-
-
-
-
-
-
-
-
-
-
-
-
-
-
-
-
-
-
-
Stimson House
$664
Avg. Price / ft2
Past 12 months
Past 12 months
$664
-
-
$679
$773
-
-
$1,031
-
$937
-
$812
-
$688
$626
-
$700
$739
$736
$880
$841
$607
$518
Stimson House
$658,333
Avg. Price
Past 12 months
Past 12 months
$658,333
$730,300
$645,000
$475,000
$522,000
$545,000
$605,000
$929,000
$675,000
$646,381
$545,000
$615,000
$480,000
$583,217
$435,000
-
$547,542
$522,125
$518,750
$710,000
$740,000
$465,083
$405,625
Stimson House
$615,000
Median Price
Past 12 months
Past 12 months
$615,000
$639,000
$645,000
$475,000
$522,000
$545,000
$605,000
$650,000
$675,000
$642,500
$545,000
$535,000
$485,000
$475,000
$435,000
-
$498,834
$527,750
$535,000
$720,000
$607,500
$427,000
$333,750
Stimson House
N/A
Avg. Price / ft2
Past 12 months
Past 12 months
-
-
-
-
-
-
-
-
-
-
-
-
-
-
-
-
-
-
-
-
-
-
-
Stimson House
N/A
Avg. Price
Past 12 months
Past 12 months
-
-
-
-
-
-
-
-
-
-
-
-
-
-
-
-
-
-
-
-
-
-
-
Stimson House
N/A
Median Price
Past 12 months
Past 12 months
-
-
-
-
-
-
-
-
-
-
-
-
-
-
-
-
-
-
-
-
-
-
-
Stimson House
$637
Avg. Price / ft2
Past 12 months
Past 12 months
$637
-
-
$679
$773
-
-
$926
-
$937
-
$794
-
$642
$626
-
$700
$739
$736
$986
-
$601
$512
Stimson House
$572,500
Avg. Price
Past 12 months
Past 12 months
$572,500
$612,875
$645,000
$475,000
$522,000
$545,000
$605,000
$632,333
$675,000
$646,381
$545,000
$535,000
$480,000
$465,000
$435,000
-
$485,056
$522,125
$518,750
$640,000
$521,250
$426,300
$330,833
Stimson House
$572,500
Median Price
Past 12 months
Past 12 months
$572,500
$613,250
$645,000
$475,000
$522,000
$545,000
$605,000
$630,000
$675,000
$642,500
$545,000
$532,500
$485,000
$465,000
$435,000
-
$498,667
$527,750
$535,000
$640,000
$521,250
$419,000
$332,500
Stimson House
$692
Avg. Price / ft2
Past 12 months
Past 12 months
$692
-
-
-
-
-
-
$955
-
-
-
$850
-
$781
-
-
$700
-
-
$773
-
$628
$525
Stimson House
$830,000
Avg. Price
Past 12 months
Past 12 months
$830,000
-
-
-
-
-
-
$1,050,000
-
-
-
$935,000
-
$819,650
-
-
$735,000
-
-
$850,000
-
$659,000
$630,000
Stimson House
$830,000
Median Price
Past 12 months
Past 12 months
$830,000
-
-
-
-
-
-
$1,050,000
-
-
-
$935,000
-
$819,650
-
-
$735,000
-
-
$850,000
-
$659,000
$630,000
Stimson House
N/A
Avg. Price / ft2
Past 12 months
Past 12 months
-
-
-
-
-
-
-
$1,213
-
-
-
-
-
-
-
-
-
-
-
-
$841
-
-
Stimson House
N/A
Avg. Price
Past 12 months
Past 12 months
-
$1,200,000
-
-
-
-
-
$1,698,000
-
-
-
-
-
-
-
-
-
-
-
-
$1,177,500
-
-
Stimson House
N/A
Median Price
Past 12 months
Past 12 months
-
$1,200,000
-
-
-
-
-
$1,698,000
-
-
-
-
-
-
-
-
-
-
-
-
$1,177,500
-
-
Stimson House
N/A
Avg. Price / ft2
Past 12 months
Past 12 months
-
-
-
-
-
-
-
-
-
-
-
-
-
-
-
-
-
-
-
-
-
-
-
Stimson House
N/A
Avg. Price
Past 12 months
Past 12 months
-
-
-
-
-
-
-
-
-
-
-
-
-
-
-
-
-
-
-
-
-
-
-
Stimson House
N/A
Median Price
Past 12 months
Past 12 months
-
-
-
-
-
-
-
-
-
-
-
-
-
-
-
-
-
-
-
-
-
-
-
Stimson House
N/A
Avg. Price / ft2
Past 12 months
Past 12 months
-
-
-
-
-
-
-
-
-
-
-
-
-
-
-
-
-
-
-
-
-
-
-
Stimson House
N/A
Avg. Price
Past 12 months
Past 12 months
-
-
-
-
-
-
-
-
-
-
-
-
-
-
-
-
-
-
-
-
-
-
-
Stimson House
N/A
Median Price
Past 12 months
Past 12 months
-
-
-
-
-
-
-
-
-
-
-
-
-
-
-
-
-
-
-
-
-
-
-
Quaker Ridge
$1,157
Avg. Price / ft2
Past 12 months
Past 12 months
$1,131
-
$1,116
$1,064
$1,102
$1,175
$1,141
$956
$1,128
$1,139
$930
$1,019
$792
$814
$797
$763
$740
$985
$913
$866
$859
$605
$539
Quaker Ridge
$1,100,833
Avg. Price
Past 12 months
Past 12 months
$1,378,750
$939,667
$839,400
$775,318
$1,000,000
$1,043,125
$894,375
$620,659
$1,043,814
$1,012,714
$827,833
$831,917
$606,622
$692,667
$732,909
$580,200
$665,750
$913,193
$783,676
$697,318
$682,545
$640,100
$442,833
Quaker Ridge
$780,000
Median Price
Past 12 months
Past 12 months
$1,100,000
$720,000
$697,500
$725,000
$950,000
$964,500
$740,000
$615,000
$924,000
$885,000
$685,000
$630,000
$527,500
$660,000
$645,000
$622,000
$552,500
$750,000
$660,000
$615,000
$685,000
$560,500
$408,750
Quaker Ridge
N/A
Avg. Price / ft2
Past 12 months
Past 12 months
-
-
$917
$1,241
-
-
-
$977
-
-
-
-
$756
-
$691
$698
-
-
-
$864
-
-
$582
Quaker Ridge
N/A
Avg. Price
Past 12 months
Past 12 months
-
-
$550,000
$704,833
-
$505,000
-
$605,000
$550,000
$630,000
$519,500
$487,250
$453,750
$385,000
$400,000
$425,000
-
$508,500
$490,000
$475,000
$395,000
-
$287,500
Quaker Ridge
N/A
Median Price
Past 12 months
Past 12 months
-
-
$550,000
$682,500
-
$505,000
-
$605,000
$550,000
$630,000
$519,500
$487,250
$457,000
$385,000
$400,000
$425,000
-
$508,500
$490,000
$475,000
$395,000
-
$287,500
Quaker Ridge
$1,054
Avg. Price / ft2
Past 12 months
Past 12 months
$1,054
-
$1,061
$1,020
$1,026
$1,175
$1,042
$946
$1,038
$1,034
$939
$908
$787
$785
$751
$755
$740
$711
$884
$777
-
$605
$510
Quaker Ridge
$697,083
Avg. Price
Past 12 months
Past 12 months
$642,500
$634,500
$681,700
$801,750
$707,500
$999,000
$727,500
$677,156
$801,688
$867,714
$666,875
$617,727
$584,917
$638,188
$579,250
$583,667
$558,900
$554,344
$615,813
$550,100
$629,500
$540,125
$427,222
Quaker Ridge
$717,500
Median Price
Past 12 months
Past 12 months
$642,500
$634,500
$697,500
$762,000
$642,500
$999,000
$696,000
$640,500
$766,250
$840,000
$663,750
$570,000
$565,000
$660,000
$565,000
$622,000
$520,000
$502,500
$610,000
$575,000
$594,000
$500,250
$395,000
Quaker Ridge
N/A
Avg. Price / ft2
Past 12 months
Past 12 months
-
-
$1,482
-
$1,300
-
$1,290
-
$1,353
$1,223
$912
$1,167
$900
$1,046
$884
$853
-
$1,226
$986
$926
$859
-
$611
Quaker Ridge
$1,512,500
Avg. Price
Past 12 months
Past 12 months
$1,530,000
$1,550,000
$2,075,000
-
$1,170,000
$1,334,250
$1,395,000
-
$1,263,333
$1,245,667
$1,248,000
$1,441,000
$765,000
$1,255,000
$1,090,000
$725,000
$1,200,000
$1,411,438
$1,039,000
$998,750
$903,333
$1,040,000
$592,900
Quaker Ridge
$1,512,500
Median Price
Past 12 months
Past 12 months
$1,530,000
$1,550,000
$2,075,000
-
$1,170,000
$1,334,250
$1,395,000
-
$1,295,000
$1,079,000
$1,475,000
$1,540,000
$765,000
$1,255,000
$1,205,000
$725,000
$1,200,000
$1,454,750
$1,025,000
$1,000,000
$775,000
$1,040,000
$545,000
Quaker Ridge
$1,286
Avg. Price / ft2
Past 12 months
Past 12 months
$1,286
-
-
-
$1,133
-
-
-
-
-
-
-
-
$875
-
-
-
$777
-
-
-
-
-
Quaker Ridge
$2,700,000
Avg. Price
Past 12 months
Past 12 months
$2,700,000
-
-
-
$1,500,000
-
-
-
$1,929,950
-
-
-
-
$1,925,000
-
-
-
$1,165,000
$2,021,000
-
-
-
-
Quaker Ridge
$2,700,000
Median Price
Past 12 months
Past 12 months
$2,700,000
-
-
-
$1,500,000
-
-
-
$1,929,950
-
-
-
-
$1,925,000
-
-
-
$1,165,000
$2,021,000
-
-
-
-
Quaker Ridge
N/A
Avg. Price / ft2
Past 12 months
Past 12 months
-
-
-
-
-
-
-
-
-
-
-
-
-
-
-
-
-
-
-
-
-
-
-
Quaker Ridge
N/A
Avg. Price
Past 12 months
Past 12 months
-
-
-
-
-
-
-
-
-
-
-
-
-
-
-
-
-
-
-
-
-
-
-
Quaker Ridge
N/A
Median Price
Past 12 months
Past 12 months
-
-
-
-
-
-
-
-
-
-
-
-
-
-
-
-
-
-
-
-
-
-
-
Quaker Ridge
N/A
Avg. Price / ft2
Past 12 months
Past 12 months
-
-
-
-
-
-
-
-
-
-
-
-
-
-
-
-
-
-
-
-
-
-
-
Quaker Ridge
N/A
Avg. Price
Past 12 months
Past 12 months
-
-
-
-
-
-
-
-
-
-
-
-
-
-
-
-
-
-
-
-
-
-
-
Quaker Ridge
N/A
Median Price
Past 12 months
Past 12 months
-
-
-
-
-
-
-
-
-
-
-
-
-
-
-
-
-
-
-
-
-
-
-
Gramercy Park Towers
$1,081
Avg. Price / ft2
Past 12 months
Past 12 months
$1,034
$1,144
$1,105
$1,051
$1,047
$968
$1,059
$1,065
$1,181
$974
$949
$939
$874
$793
$857
$701
$716
$947
$903
$764
$729
$580
$527
Gramercy Park Towers
$863,664
Avg. Price
Past 12 months
Past 12 months
$717,525
$738,400
$885,575
$884,136
$903,167
$629,250
$934,000
$900,130
$1,180,625
$690,235
$810,250
$856,026
$736,458
$647,232
$785,895
$502,500
$577,535
$754,202
$850,229
$628,571
$581,175
$430,644
$344,056
Gramercy Park Towers
$678,900
Median Price
Past 12 months
Past 12 months
$652,500
$657,500
$732,500
$687,500
$930,000
$629,250
$837,500
$737,550
$972,500
$635,000
$595,000
$580,000
$595,000
$540,000
$705,000
$502,500
$640,000
$660,000
$652,703
$490,000
$472,500
$391,575
$275,000
Gramercy Park Towers
$971
Avg. Price / ft2
Past 12 months
Past 12 months
$973
$925
$979
$935
$915
$877
$1,007
$1,067
$1,068
$933
$863
$849
$786
$688
$799
$692
$615
$923
$814
$724
$674
$559
$493
Gramercy Park Towers
$568,550
Avg. Price
Past 12 months
Past 12 months
$591,614
$544,750
$666,150
$605,818
$622,500
$570,000
$670,000
$659,300
$701,667
$599,083
$526,188
$550,700
$497,857
$452,207
$507,700
$385,000
$395,713
$605,024
$530,425
$476,000
$435,380
$348,788
$309,357
Gramercy Park Towers
$538,750
Median Price
Past 12 months
Past 12 months
$580,000
$544,750
$650,750
$570,000
$560,000
$570,000
$690,000
$680,000
$680,000
$579,500
$536,500
$539,000
$520,000
$450,000
$466,500
$385,000
$405,000
$600,429
$549,000
$490,000
$455,000
$340,500
$275,000
Gramercy Park Towers
$1,190
Avg. Price / ft2
Past 12 months
Past 12 months
$1,124
$1,253
$1,230
$1,158
$1,116
$1,059
$1,039
$1,064
$1,078
$1,018
$982
$949
$896
$840
$835
$709
$756
$974
$928
$832
$825
$607
$645
Gramercy Park Towers
$972,250
Avg. Price
Past 12 months
Past 12 months
$893,800
$972,500
$918,571
$919,500
$962,143
$688,500
$868,222
$872,000
$1,017,500
$836,250
$896,875
$761,640
$696,923
$665,278
$661,250
$620,000
$619,301
$764,779
$756,579
$720,000
$656,750
$512,500
$465,500
Gramercy Park Towers
$984,500
Median Price
Past 12 months
Past 12 months
$999,000
$972,500
$820,000
$980,000
$970,000
$688,500
$880,000
$912,500
$1,017,500
$847,500
$917,500
$830,000
$630,000
$725,000
$707,500
$620,000
$670,000
$782,071
$730,000
$720,000
$632,500
$562,500
$465,500
Gramercy Park Towers
N/A
Avg. Price / ft2
Past 12 months
Past 12 months
-
-
-
$1,336
$1,105
-
$1,259
-
$1,061
$1,174
$1,143
$1,162
$1,066
-
$1,012
-
$777
$969
$1,045
$897
$751
-
-
Gramercy Park Towers
$2,200,000
Avg. Price
Past 12 months
Past 12 months
-
-
$1,675,000
$1,365,000
$1,233,333
-
$1,700,000
$2,075,000
$1,355,000
$1,200,000
$1,600,000
$1,583,097
$1,282,500
-
$1,326,667
-
$795,000
$1,182,171
$1,465,400
$1,300,000
$768,000
-
-
Gramercy Park Towers
$2,200,000
Median Price
Past 12 months
Past 12 months
-
-
$1,675,000
$1,365,000
$1,255,000
-
$1,700,000
$2,075,000
$1,355,000
$1,200,000
$1,600,000
$1,634,291
$1,277,500
-
$1,310,000
-
$795,000
$1,172,500
$1,518,699
$1,300,000
$768,000
-
-
Gramercy Park Towers
N/A
Avg. Price / ft2
Past 12 months
Past 12 months
-
-
$1,484
$1,112
-
-
$1,300
-
$1,622
-
-
-
-
$1,156
$1,063
-
-
-
$1,209
-
$969
-
-
Gramercy Park Towers
N/A
Avg. Price
Past 12 months
Past 12 months
-
-
$2,375,000
$1,935,000
-
-
$2,080,000
$1,730,000
$2,595,000
-
-
-
-
$1,850,000
$1,615,000
-
-
-
$1,934,675
-
$1,550,000
-
-
Gramercy Park Towers
N/A
Median Price
Past 12 months
Past 12 months
-
-
$2,375,000
$2,060,000
-
-
$2,080,000
$1,730,000
$2,595,000
-
-
-
-
$1,850,000
$1,615,000
-
-
-
$1,934,675
-
$1,550,000
-
-
Gramercy Park Towers
N/A
Avg. Price / ft2
Past 12 months
Past 12 months
-
-
-
-
-
-
-
-
-
-
-
-
-
-
-
-
-
-
-
-
-
-
-
Gramercy Park Towers
N/A
Avg. Price
Past 12 months
Past 12 months
-
-
-
-
-
-
-
-
-
-
-
-
-
-
-
-
-
-
-
-
-
-
-
Gramercy Park Towers
N/A
Median Price
Past 12 months
Past 12 months
-
-
-
-
-
-
-
-
-
-
-
-
-
-
-
-
-
-
-
-
-
-
-
Gramercy Park Towers
N/A
Avg. Price / ft2
Past 12 months
Past 12 months
-
-
-
-
-
-
-
-
-
-
-
-
-
-
-
-
-
-
-
-
-
-
-
Gramercy Park Towers
N/A
Avg. Price
Past 12 months
Past 12 months
-
-
-
-
-
-
-
-
-
-
-
-
-
-
-
-
-
-
-
-
-
-
-
Gramercy Park Towers
N/A
Median Price
Past 12 months
Past 12 months
-
-
-
-
-
-
-
-
-
-
-
-
-
-
-
-
-
-
-
-
-
-
-
The Rutherford
$1,037
Avg. Price / ft2
Past 12 months
Past 12 months
$1,044
-
-
$1,042
$1,062
$1,149
-
$1,134
$1,142
$1,133
$1,146
$946
$891
$781
$915
$810
$786
$999
$977
$836
$801
$565
$505
The Rutherford
$634,571
Avg. Price
Past 12 months
Past 12 months
$643,667
$526,135
$804,250
$566,571
$1,248,333
$664,417
$472,000
$802,250
$706,700
$646,275
$844,271
$491,139
$601,900
$392,000
$440,000
$491,250
$531,250
$550,000
$468,833
$438,833
$540,476
$389,269
$298,325
The Rutherford
$610,000
Median Price
Past 12 months
Past 12 months
$567,500
$555,000
$804,250
$550,000
$1,480,000
$571,000
$472,000
$610,000
$672,500
$585,000
$578,750
$480,000
$480,000
$379,000
$440,000
$437,500
$481,250
$525,000
$451,000
$472,000
$469,000
$331,000
$297,500
The Rutherford
$1,066
Avg. Price / ft2
Past 12 months
Past 12 months
$1,066
-
-
$1,042
-
$1,149
-
$1,223
$1,141
$1,133
$1,146
$921
$854
$781
$956
$768
$758
$767
$1,148
$825
$738
$542
$450
The Rutherford
$560,500
Avg. Price
Past 12 months
Past 12 months
$552,400
$526,135
-
$566,571
-
$507,375
$472,000
$542,000
$591,857
$576,594
$476,042
$462,179
$432,533
$392,000
$430,000
$396,667
$393,333
$460,000
$479,600
$451,000
$353,000
$359,000
$262,500
The Rutherford
$567,500
Median Price
Past 12 months
Past 12 months
$525,000
$555,000
-
$550,000
-
$482,500
$472,000
$542,000
$640,000
$567,188
$425,000
$475,000
$445,600
$379,000
$430,000
$390,000
$420,000
$460,000
$487,000
$472,000
$315,000
$331,000
$285,000
The Rutherford
N/A
Avg. Price / ft2
Past 12 months
Past 12 months
-
-
-
-
$858
-
-
$1,042
$1,145
-
-
$1,008
$1,027
-
$874
$936
$853
$1,115
$806
$868
$874
$513
$560
The Rutherford
$550,000
Avg. Price
Past 12 months
Past 12 months
-
-
$804,250
-
$515,000
$978,500
-
$625,000
$974,667
$925,000
$250,000
$592,500
$850,000
-
$450,000
$775,000
$578,750
$595,000
$415,000
$499,000
$524,428
$346,250
$382,500
The Rutherford
$550,000
Median Price
Past 12 months
Past 12 months
-
-
$804,250
-
$515,000
$978,500
-
$625,000
$954,000
$925,000
$250,000
$592,500
$850,000
-
$450,000
$775,000
$578,750
$595,000
$415,000
$499,000
$524,428
$346,250
$382,500
The Rutherford
$1,000
Avg. Price / ft2
Past 12 months
Past 12 months
$1,000
-
-
-
$1,163
-
-
$1,136
-
-
-
-
$945
-
-
-
$708
-
-
-
$783
$642
-
The Rutherford
$1,100,000
Avg. Price
Past 12 months
Past 12 months
$1,100,000
-
-
-
$1,615,000
-
-
$1,500,000
-
-
$1,150,000
-
$1,370,000
-
-
-
$850,000
-
-
-
$1,135,000
$770,000
-
The Rutherford
$1,100,000
Median Price
Past 12 months
Past 12 months
$1,100,000
-
-
-
$1,615,000
-
-
$1,500,000
-
-
$1,150,000
-
$1,370,000
-
-
-
$850,000
-
-
-
$1,135,000
$770,000
-
The Rutherford
N/A
Avg. Price / ft2
Past 12 months
Past 12 months
-
-
-
-
-
-
-
-
-
-
-
-
-
-
-
-
-
-
-
-
-
-
-
The Rutherford
N/A
Avg. Price
Past 12 months
Past 12 months
-
-
-
-
-
-
-
-
-
-
$1,650,000
-
-
-
-
-
-
-
-
-
-
-
-
The Rutherford
N/A
Median Price
Past 12 months
Past 12 months
-
-
-
-
-
-
-
-
-
-
$1,650,000
-
-
-
-
-
-
-
-
-
-
-
-
The Rutherford
N/A
Avg. Price / ft2
Past 12 months
Past 12 months
-
-
-
-
-
-
-
-
-
-
-
-
-
-
-
-
-
-
-
-
-
-
-
The Rutherford
N/A
Avg. Price
Past 12 months
Past 12 months
-
-
-
-
-
-
-
-
-
-
-
-
-
-
-
-
-
-
-
-
-
-
-
The Rutherford
N/A
Median Price
Past 12 months
Past 12 months
-
-
-
-
-
-
-
-
-
-
-
-
-
-
-
-
-
-
-
-
-
-
-
The Rutherford
N/A
Avg. Price / ft2
Past 12 months
Past 12 months
-
-
-
-
-
-
-
-
-
-
-
-
-
-
-
-
-
-
-
-
-
-
-
The Rutherford
N/A
Avg. Price
Past 12 months
Past 12 months
-
-
-
-
-
-
-
-
-
-
-
-
-
-
-
-
-
-
-
-
-
-
-
The Rutherford
N/A
Median Price
Past 12 months
Past 12 months
-
-
-
-
-
-
-
-
-
-
-
-
-
-
-
-
-
-
-
-
-
-
-
Tracy Towers
$936
Avg. Price / ft2
Past 12 months
Past 12 months
$869
$1,001
$964
$941
$944
$849
$1,019
$1,003
$928
$907
$706
$799
$719
$657
$694
$707
$695
$724
$678
$667
$669
$491
$428
Tracy Towers
$515,000
Avg. Price
Past 12 months
Past 12 months
$515,000
$627,500
$520,500
$656,548
$532,273
$610,000
$526,833
$548,667
$540,167
$458,667
$484,643
$532,500
$470,833
$411,500
$479,188
$386,667
$377,577
$438,150
$420,750
$404,423
$364,948
$352,000
$250,300
Tracy Towers
$515,000
Median Price
Past 12 months
Past 12 months
$515,000
$660,000
$520,000
$672,500
$480,000
$595,000
$530,000
$560,000
$489,500
$474,125
$455,000
$435,000
$425,000
$405,000
$443,500
$395,000
$365,000
$455,000
$407,500
$395,000
$372,000
$315,000
$236,500
Tracy Towers
$936
Avg. Price / ft2
Past 12 months
Past 12 months
$869
$1,321
-
$876
$905
-
$944
$967
$928
$907
$566
$791
$735
$646
$733
$707
$723
$667
$738
$714
$566
$531
$419
Tracy Towers
$515,000
Avg. Price
Past 12 months
Past 12 months
$515,000
$597,500
$481,875
$551,111
$491,250
$595,000
$531,500
$525,500
$501,750
$458,667
$499,000
$435,000
$420,000
$379,857
$394,667
$386,667
$346,750
$390,084
$406,000
$392,667
$336,417
$291,000
$260,750
Tracy Towers
$515,000
Median Price
Past 12 months
Past 12 months
$515,000
$597,500
$520,000
$563,333
$490,000
$595,000
$531,500
$522,500
$489,500
$474,125
$499,000
$435,000
$425,000
$389,000
$399,000
$395,000
$345,000
$423,251
$406,000
$395,000
$367,000
$293,000
$260,750
Tracy Towers
N/A
Avg. Price / ft2
Past 12 months
Past 12 months
-
$833
$964
$1,072
$955
$833
-
$1,039
-
-
$729
$876
-
$711
$691
-
$682
$810
$658
$559
$690
$479
$434
Tracy Towers
N/A
Avg. Price
Past 12 months
Past 12 months
-
$500,000
$675,000
$722,500
$491,667
$500,000
-
$595,000
$449,000
-
$482,250
$401,667
-
$462,500
$480,667
-
$391,278
$510,250
$425,667
$430,875
$377,176
$357,000
$243,333
Tracy Towers
N/A
Median Price
Past 12 months
Past 12 months
-
$500,000
$675,000
$720,000
$472,500
$500,000
-
$595,000
$449,000
-
$452,500
$425,000
-
$462,500
$457,000
-
$367,500
$512,500
$407,500
$417,500
$375,000
$359,000
$235,000
Tracy Towers
N/A
Avg. Price / ft2
Past 12 months
Past 12 months
-
$850
-
$740
$1,000
$865
$1,171
-
-
-
-
$730
$659
$625
$640
-
-
-
-
-
$1,075
$448
-
Tracy Towers
N/A
Avg. Price
Past 12 months
Past 12 months
-
$721,250
-
$775,000
$940,000
$735,000
$517,500
-
$785,000
-
-
$777,500
$725,000
$531,000
$603,750
-
-
-
-
-
$475,000
$437,250
-
Tracy Towers
N/A
Median Price
Past 12 months
Past 12 months
-
$721,250
-
$775,000
$940,000
$735,000
$517,500
-
$785,000
-
-
$777,500
$725,000
$531,000
$603,750
-
-
-
-
-
$475,000
$472,000
-
Tracy Towers
N/A
Avg. Price / ft2
Past 12 months
Past 12 months
-
-
-
-
-
-
-
-
-
-
-
-
-
-
-
-
-
-
-
-
-
-
-
Tracy Towers
N/A
Avg. Price
Past 12 months
Past 12 months
-
-
-
-
-
-
-
-
-
-
-
-
-
-
-
-
-
-
-
-
-
-
-
Tracy Towers
N/A
Median Price
Past 12 months
Past 12 months
-
-
-
-
-
-
-
-
-
-
-
-
-
-
-
-
-
-
-
-
-
-
-
Tracy Towers
N/A
Avg. Price / ft2
Past 12 months
Past 12 months
-
-
-
-
-
-
-
-
-
-
-
-
-
-
-
-
-
-
-
-
-
-
-
Tracy Towers
N/A
Avg. Price
Past 12 months
Past 12 months
-
-
-
-
-
-
-
-
-
-
-
-
-
-
-
-
-
-
-
-
-
-
-
Tracy Towers
N/A
Median Price
Past 12 months
Past 12 months
-
-
-
-
-
-
-
-
-
-
-
-
-
-
-
-
-
-
-
-
-
-
-