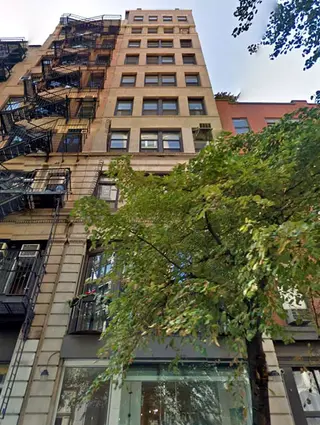
54 East 11th Street: Price Comparison
between Broadway & University Place Building Profile
54 East 11th Street
N/A
Avg. Price
Past 12 months
Past 12 months
2024
-
2023
$4,730,000
2022
-
2021
$4,999,899
2020
-
2019
-
2018
-
2017
$3,980,000
2016
$3,500,000
2015
$4,170,493
2014
-
2013
$3,787,000
2012
-
2011
$2,065,000
2010
$1,700,000
2009
-
2008
-
2007
-
2006
$2,000,000
2005
$2,250,000
2004
-
2003
$1,465,000
54 East 11th Street
N/A
Median Price
Past 12 months
Past 12 months
2024
-
2023
$4,730,000
2022
-
2021
$4,999,899
2020
-
2019
-
2018
-
2017
$3,980,000
2016
$3,500,000
2015
$4,200,000
2014
-
2013
$3,787,000
2012
-
2011
$2,065,000
2010
$1,700,000
2009
-
2008
-
2007
-
2006
$2,000,000
2005
$2,250,000
2004
-
2003
$1,465,000
54 East 11th Street
N/A
Avg. Price
Past 12 months
Past 12 months
2024
-
2023
-
2022
-
2021
-
2020
-
2019
-
2018
-
2017
-
2016
-
2015
-
2014
-
2013
-
2012
-
2011
-
2010
-
2009
-
2008
-
2007
-
2006
-
2005
-
2004
-
2003
-
54 East 11th Street
N/A
Median Price
Past 12 months
Past 12 months
2024
-
2023
-
2022
-
2021
-
2020
-
2019
-
2018
-
2017
-
2016
-
2015
-
2014
-
2013
-
2012
-
2011
-
2010
-
2009
-
2008
-
2007
-
2006
-
2005
-
2004
-
2003
-
54 East 11th Street
N/A
Avg. Price
Past 12 months
Past 12 months
2024
-
2023
-
2022
-
2021
$4,999,899
2020
-
2019
-
2018
-
2017
-
2016
-
2015
$4,155,740
2014
-
2013
-
2012
-
2011
$2,065,000
2010
$1,700,000
2009
-
2008
-
2007
-
2006
$2,000,000
2005
-
2004
-
2003
$1,465,000
54 East 11th Street
N/A
Median Price
Past 12 months
Past 12 months
2024
-
2023
-
2022
-
2021
$4,999,899
2020
-
2019
-
2018
-
2017
-
2016
-
2015
$4,155,740
2014
-
2013
-
2012
-
2011
$2,065,000
2010
$1,700,000
2009
-
2008
-
2007
-
2006
$2,000,000
2005
-
2004
-
2003
$1,465,000
54 East 11th Street
N/A
Avg. Price
Past 12 months
Past 12 months
2024
-
2023
$4,730,000
2022
-
2021
-
2020
-
2019
-
2018
-
2017
$3,980,000
2016
$3,500,000
2015
$4,200,000
2014
-
2013
$3,787,000
2012
-
2011
-
2010
-
2009
-
2008
-
2007
-
2006
-
2005
$2,250,000
2004
-
2003
-
54 East 11th Street
N/A
Median Price
Past 12 months
Past 12 months
2024
-
2023
$4,730,000
2022
-
2021
-
2020
-
2019
-
2018
-
2017
$3,980,000
2016
$3,500,000
2015
$4,200,000
2014
-
2013
$3,787,000
2012
-
2011
-
2010
-
2009
-
2008
-
2007
-
2006
-
2005
$2,250,000
2004
-
2003
-
54 East 11th Street
N/A
Avg. Price
Past 12 months
Past 12 months
2024
-
2023
-
2022
-
2021
-
2020
-
2019
-
2018
-
2017
-
2016
-
2015
-
2014
-
2013
-
2012
-
2011
-
2010
-
2009
-
2008
-
2007
-
2006
-
2005
-
2004
-
2003
-
54 East 11th Street
N/A
Median Price
Past 12 months
Past 12 months
2024
-
2023
-
2022
-
2021
-
2020
-
2019
-
2018
-
2017
-
2016
-
2015
-
2014
-
2013
-
2012
-
2011
-
2010
-
2009
-
2008
-
2007
-
2006
-
2005
-
2004
-
2003
-
54 East 11th Street
N/A
Avg. Price
Past 12 months
Past 12 months
2024
-
2023
-
2022
-
2021
-
2020
-
2019
-
2018
-
2017
-
2016
-
2015
-
2014
-
2013
-
2012
-
2011
-
2010
-
2009
-
2008
-
2007
-
2006
-
2005
-
2004
-
2003
-
54 East 11th Street
N/A
Median Price
Past 12 months
Past 12 months
2024
-
2023
-
2022
-
2021
-
2020
-
2019
-
2018
-
2017
-
2016
-
2015
-
2014
-
2013
-
2012
-
2011
-
2010
-
2009
-
2008
-
2007
-
2006
-
2005
-
2004
-
2003
-

 6sqft delivers the latest on real estate, architecture, and design, straight from New York City.
