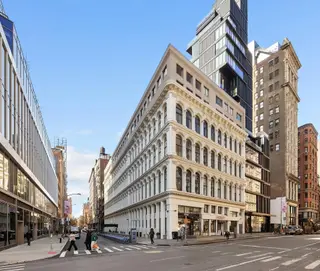
Cast Iron Building, 67 East 11th Street: Price Comparison
between University Place & Broadway Building Profile
Cast Iron Building
$1,363,400
Avg. Price
Past 12 months
Past 12 months
2025
$1,312,778
2024
$923,000
2023
$735,000
2022
$715,000
2021
$1,054,667
2020
$733,500
2019
$910,000
2018
$980,000
2017
$1,000,833
2016
$989,778
2015
$668,442
2014
$719,000
2013
$692,623
2012
$677,822
2011
$584,485
2010
$684,062
2009
$620,000
2008
$711,554
2007
$610,909
2006
$785,000
2005
$600,331
2004
$559,550
2003
$434,550
Cast Iron Building
$1,222,500
Median Price
Past 12 months
Past 12 months
2025
$1,105,000
2024
$1,120,000
2023
$610,000
2022
$627,500
2021
$999,000
2020
$622,000
2019
$808,750
2018
$822,500
2017
$1,047,500
2016
$1,090,000
2015
$659,317
2014
$712,000
2013
$605,500
2012
$702,966
2011
$643,340
2010
$610,000
2009
$622,500
2008
$677,500
2007
$559,000
2006
$810,000
2005
$533,838
2004
$565,000
2003
$387,750
Cast Iron Building
$400,000
Avg. Price
Past 12 months
Past 12 months
2025
$477,500
2024
$525,000
2023
$596,000
2022
$540,000
2021
-
2020
$555,000
2019
$726,250
2018
$655,000
2017
$632,500
2016
$604,000
2015
$549,452
2014
$618,400
2013
$488,875
2012
-
2011
$335,712
2010
-
2009
$452,500
2008
$560,037
2007
$446,000
2006
-
2005
$406,534
2004
-
2003
$254,500
Cast Iron Building
$400,000
Median Price
Past 12 months
Past 12 months
2025
$477,500
2024
$525,000
2023
$596,000
2022
$540,000
2021
-
2020
$555,000
2019
$726,250
2018
$655,000
2017
$632,500
2016
$604,000
2015
$488,360
2014
$649,000
2013
$497,500
2012
-
2011
$350,000
2010
-
2009
$452,500
2008
$560,037
2007
$437,500
2006
-
2005
$380,000
2004
-
2003
$254,500
Cast Iron Building
$1,488,625
Avg. Price
Past 12 months
Past 12 months
2025
$1,551,429
2024
$1,188,333
2023
$804,500
2022
$773,333
2021
$992,000
2020
$609,000
2019
$735,833
2018
$822,500
2017
$1,185,000
2016
$1,090,000
2015
$736,436
2014
$819,600
2013
$785,883
2012
$651,386
2011
$652,085
2010
$606,328
2009
$703,750
2008
$720,596
2007
$633,200
2006
$700,000
2005
$597,720
2004
$559,550
2003
$479,563
Cast Iron Building
$1,222,500
Median Price
Past 12 months
Past 12 months
2025
$1,195,000
2024
$1,150,000
2023
$804,500
2022
$680,000
2021
$992,000
2020
$609,000
2019
$795,000
2018
$822,500
2017
$1,206,250
2016
$1,100,000
2015
$722,500
2014
$814,000
2013
$795,892
2012
$655,931
2011
$678,340
2010
$592,656
2009
$720,000
2008
$755,000
2007
$570,000
2006
$707,500
2005
$593,000
2004
$565,000
2003
$434,250
Cast Iron Building
$1,325,000
Avg. Price
Past 12 months
Past 12 months
2025
-
2024
-
2023
-
2022
-
2021
$1,180,000
2020
$1,215,000
2019
$1,800,000
2018
$1,462,500
2017
-
2016
$1,125,000
2015
-
2014
-
2013
$1,390,000
2012
$810,000
2011
$790,000
2010
$995,000
2009
-
2008
$773,750
2007
$885,000
2006
$1,125,000
2005
$848,454
2004
-
2003
-
Cast Iron Building
$1,325,000
Median Price
Past 12 months
Past 12 months
2025
-
2024
-
2023
-
2022
-
2021
$1,180,000
2020
$1,215,000
2019
$1,800,000
2018
$1,462,500
2017
-
2016
$1,125,000
2015
-
2014
-
2013
$1,390,000
2012
$810,000
2011
$790,000
2010
$995,000
2009
-
2008
$773,750
2007
$885,000
2006
$1,125,000
2005
$843,070
2004
-
2003
-
Cast Iron Building
N/A
Avg. Price
Past 12 months
Past 12 months
2025
-
2024
-
2023
-
2022
-
2021
-
2020
-
2019
-
2018
-
2017
-
2016
-
2015
-
2014
-
2013
-
2012
-
2011
-
2010
-
2009
-
2008
-
2007
-
2006
-
2005
-
2004
-
2003
-
Cast Iron Building
N/A
Median Price
Past 12 months
Past 12 months
2025
-
2024
-
2023
-
2022
-
2021
-
2020
-
2019
-
2018
-
2017
-
2016
-
2015
-
2014
-
2013
-
2012
-
2011
-
2010
-
2009
-
2008
-
2007
-
2006
-
2005
-
2004
-
2003
-
Cast Iron Building
N/A
Avg. Price
Past 12 months
Past 12 months
2025
-
2024
-
2023
-
2022
-
2021
-
2020
-
2019
-
2018
-
2017
-
2016
-
2015
-
2014
-
2013
-
2012
-
2011
-
2010
-
2009
-
2008
-
2007
-
2006
-
2005
-
2004
-
2003
-
Cast Iron Building
N/A
Median Price
Past 12 months
Past 12 months
2025
-
2024
-
2023
-
2022
-
2021
-
2020
-
2019
-
2018
-
2017
-
2016
-
2015
-
2014
-
2013
-
2012
-
2011
-
2010
-
2009
-
2008
-
2007
-
2006
-
2005
-
2004
-
2003
-
32 Washington Square West
N/A
Avg. Price / ft2
Past 12 months
Past 12 months
-
-
-
-
-
$2,889
-
-
-
-
-
$1,201
$2,083
-
$1,750
-
$1,803
-
-
-
-
-
-
32 Washington Square West
N/A
Avg. Price
Past 12 months
Past 12 months
-
-
$3,625,000
-
-
$5,200,000
-
-
-
$7,519,500
$5,525,000
$2,162,500
$5,600,000
-
$2,651,250
-
$3,437,500
$2,933,333
-
$2,862,500
$2,221,453
-
$1,375,000
32 Washington Square West
N/A
Median Price
Past 12 months
Past 12 months
-
-
$3,475,000
-
-
$5,200,000
-
-
-
$7,519,500
$5,525,000
$2,162,500
$5,600,000
-
$2,651,250
-
$3,437,500
$3,300,000
-
$2,862,500
$2,425,000
-
$1,375,000
32 Washington Square West
N/A
Avg. Price / ft2
Past 12 months
Past 12 months
-
-
-
-
-
-
-
-
-
-
-
-
-
-
-
-
-
-
-
-
-
-
-
32 Washington Square West
N/A
Avg. Price
Past 12 months
Past 12 months
-
-
-
-
-
-
-
-
-
-
-
-
-
-
-
-
-
-
-
-
-
-
-
32 Washington Square West
N/A
Median Price
Past 12 months
Past 12 months
-
-
-
-
-
-
-
-
-
-
-
-
-
-
-
-
-
-
-
-
-
-
-
32 Washington Square West
N/A
Avg. Price / ft2
Past 12 months
Past 12 months
-
-
-
-
-
-
-
-
-
-
-
-
-
-
$1,750
-
-
-
-
-
-
-
-
32 Washington Square West
N/A
Avg. Price
Past 12 months
Past 12 months
-
-
$2,600,000
-
-
-
-
-
-
-
-
-
-
-
$2,651,250
-
$3,450,000
-
-
$2,862,500
$2,425,000
-
-
32 Washington Square West
N/A
Median Price
Past 12 months
Past 12 months
-
-
$2,600,000
-
-
-
-
-
-
-
-
-
-
-
$2,651,250
-
$3,450,000
-
-
$2,862,500
$2,425,000
-
-
32 Washington Square West
N/A
Avg. Price / ft2
Past 12 months
Past 12 months
-
-
-
-
-
-
-
-
-
-
-
$1,201
-
-
-
-
$1,803
-
-
-
-
-
-
32 Washington Square West
N/A
Avg. Price
Past 12 months
Past 12 months
-
-
$4,137,500
-
-
-
-
-
-
-
$4,150,000
$2,162,500
-
-
-
-
$3,425,000
$2,750,000
-
-
$2,752,000
-
-
32 Washington Square West
N/A
Median Price
Past 12 months
Past 12 months
-
-
$4,137,500
-
-
-
-
-
-
-
$4,150,000
$2,162,500
-
-
-
-
$3,425,000
$2,750,000
-
-
$2,752,000
-
-
32 Washington Square West
N/A
Avg. Price / ft2
Past 12 months
Past 12 months
-
-
-
-
-
$2,889
-
-
-
-
-
-
$2,083
-
-
-
-
-
-
-
-
-
-
32 Washington Square West
N/A
Avg. Price
Past 12 months
Past 12 months
-
-
-
-
-
$5,200,000
-
-
-
-
-
-
$3,750,000
-
-
-
-
-
-
-
-
-
-
32 Washington Square West
N/A
Median Price
Past 12 months
Past 12 months
-
-
-
-
-
$5,200,000
-
-
-
-
-
-
$3,750,000
-
-
-
-
-
-
-
-
-
-
32 Washington Square West
N/A
Avg. Price / ft2
Past 12 months
Past 12 months
-
-
-
-
-
-
-
-
-
-
-
-
-
-
-
-
-
-
-
-
-
-
-
32 Washington Square West
N/A
Avg. Price
Past 12 months
Past 12 months
-
-
-
-
-
-
-
-
-
$7,519,500
$6,900,000
-
$7,450,000
-
-
-
-
-
-
-
$1,487,359
-
$1,375,000
32 Washington Square West
N/A
Median Price
Past 12 months
Past 12 months
-
-
-
-
-
-
-
-
-
$7,519,500
$6,900,000
-
$7,450,000
-
-
-
-
-
-
-
$1,487,359
-
$1,375,000
The Gerken Building
N/A
Avg. Price / ft2
Past 12 months
Past 12 months
-
-
$1,800
-
-
-
-
-
-
-
-
-
$1,429
-
$743
-
-
-
-
$1,257
-
-
-
The Gerken Building
N/A
Avg. Price
Past 12 months
Past 12 months
-
-
$6,300,000
$4,300,000
-
-
-
-
-
-
-
-
$5,000,000
-
$2,600,000
-
-
-
-
$4,400,000
-
$2,995,000
-
The Gerken Building
N/A
Median Price
Past 12 months
Past 12 months
-
-
$6,300,000
$4,300,000
-
-
-
-
-
-
-
-
$5,000,000
-
$2,600,000
-
-
-
-
$4,400,000
-
$2,995,000
-
The Gerken Building
N/A
Avg. Price / ft2
Past 12 months
Past 12 months
-
-
-
-
-
-
-
-
-
-
-
-
-
-
-
-
-
-
-
-
-
-
-
The Gerken Building
N/A
Avg. Price
Past 12 months
Past 12 months
-
-
-
-
-
-
-
-
-
-
-
-
-
-
-
-
-
-
-
-
-
-
-
The Gerken Building
N/A
Median Price
Past 12 months
Past 12 months
-
-
-
-
-
-
-
-
-
-
-
-
-
-
-
-
-
-
-
-
-
-
-
The Gerken Building
N/A
Avg. Price / ft2
Past 12 months
Past 12 months
-
-
-
-
-
-
-
-
-
-
-
-
-
-
-
-
-
-
-
-
-
-
-
The Gerken Building
N/A
Avg. Price
Past 12 months
Past 12 months
-
-
-
$4,300,000
-
-
-
-
-
-
-
-
-
-
-
-
-
-
-
-
-
-
-
The Gerken Building
N/A
Median Price
Past 12 months
Past 12 months
-
-
-
$4,300,000
-
-
-
-
-
-
-
-
-
-
-
-
-
-
-
-
-
-
-
The Gerken Building
N/A
Avg. Price / ft2
Past 12 months
Past 12 months
-
-
$1,800
-
-
-
-
-
-
-
-
-
$1,429
-
-
-
-
-
-
$1,257
-
-
-
The Gerken Building
N/A
Avg. Price
Past 12 months
Past 12 months
-
-
$6,300,000
-
-
-
-
-
-
-
-
-
$5,000,000
-
-
-
-
-
-
$4,400,000
-
-
-
The Gerken Building
N/A
Median Price
Past 12 months
Past 12 months
-
-
$6,300,000
-
-
-
-
-
-
-
-
-
$5,000,000
-
-
-
-
-
-
$4,400,000
-
-
-
The Gerken Building
N/A
Avg. Price / ft2
Past 12 months
Past 12 months
-
-
-
-
-
-
-
-
-
-
-
-
-
-
$743
-
-
-
-
-
-
-
-
The Gerken Building
N/A
Avg. Price
Past 12 months
Past 12 months
-
-
-
-
-
-
-
-
-
-
-
-
-
-
$2,600,000
-
-
-
-
-
-
$2,995,000
-
The Gerken Building
N/A
Median Price
Past 12 months
Past 12 months
-
-
-
-
-
-
-
-
-
-
-
-
-
-
$2,600,000
-
-
-
-
-
-
$2,995,000
-
The Gerken Building
N/A
Avg. Price / ft2
Past 12 months
Past 12 months
-
-
-
-
-
-
-
-
-
-
-
-
-
-
-
-
-
-
-
-
-
-
-
The Gerken Building
N/A
Avg. Price
Past 12 months
Past 12 months
-
-
-
-
-
-
-
-
-
-
-
-
-
-
-
-
-
-
-
-
-
-
-
The Gerken Building
N/A
Median Price
Past 12 months
Past 12 months
-
-
-
-
-
-
-
-
-
-
-
-
-
-
-
-
-
-
-
-
-
-
-
644 Broadway
N/A
Avg. Price / ft2
Past 12 months
Past 12 months
-
-
-
$1,188
$1,369
$1,022
-
-
-
$1,196
-
$1,425
$1,018
-
-
-
$1,015
-
$771
-
$870
$761
-
644 Broadway
N/A
Avg. Price
Past 12 months
Past 12 months
-
-
-
$3,450,000
$3,691,667
$2,350,000
-
-
-
$2,750,000
-
$1,995,000
$2,850,000
-
-
-
$3,428,333
-
$3,000,000
-
$2,000,000
$1,065,000
$1,550,000
644 Broadway
N/A
Median Price
Past 12 months
Past 12 months
-
-
-
$3,450,000
$3,200,000
$2,350,000
-
-
-
$2,750,000
-
$1,995,000
$2,850,000
-
-
-
$3,435,000
-
$3,000,000
-
$2,000,000
$1,065,000
$1,550,000
644 Broadway
N/A
Avg. Price / ft2
Past 12 months
Past 12 months
-
-
-
-
-
-
-
-
-
-
-
-
-
-
-
-
-
-
-
-
-
-
-
644 Broadway
N/A
Avg. Price
Past 12 months
Past 12 months
-
-
-
-
-
-
-
-
-
-
-
-
-
-
-
-
-
-
-
-
-
-
-
644 Broadway
N/A
Median Price
Past 12 months
Past 12 months
-
-
-
-
-
-
-
-
-
-
-
-
-
-
-
-
-
-
-
-
-
-
-
644 Broadway
N/A
Avg. Price / ft2
Past 12 months
Past 12 months
-
-
-
-
$1,502
$1,022
-
-
-
$1,196
-
$1,425
$1,018
-
-
-
$1,015
-
-
-
$870
$761
-
644 Broadway
N/A
Avg. Price
Past 12 months
Past 12 months
-
-
-
-
$3,937,500
$2,350,000
-
-
-
$2,750,000
-
$1,995,000
$2,850,000
-
-
-
$3,450,000
-
-
-
$2,000,000
$1,065,000
$1,550,000
644 Broadway
N/A
Median Price
Past 12 months
Past 12 months
-
-
-
-
$3,937,500
$2,350,000
-
-
-
$2,750,000
-
$1,995,000
$2,850,000
-
-
-
$3,450,000
-
-
-
$2,000,000
$1,065,000
$1,550,000
644 Broadway
N/A
Avg. Price / ft2
Past 12 months
Past 12 months
-
-
-
$1,188
$1,102
-
-
-
-
-
-
-
-
-
-
-
$1,171
-
$771
-
-
-
-
644 Broadway
N/A
Avg. Price
Past 12 months
Past 12 months
-
-
-
$3,450,000
$3,200,000
-
-
-
-
-
-
-
-
-
-
-
$3,400,000
-
$3,000,000
-
-
-
-
644 Broadway
N/A
Median Price
Past 12 months
Past 12 months
-
-
-
$3,450,000
$3,200,000
-
-
-
-
-
-
-
-
-
-
-
$3,400,000
-
$3,000,000
-
-
-
-
644 Broadway
N/A
Avg. Price / ft2
Past 12 months
Past 12 months
-
-
-
-
-
-
-
-
-
-
-
-
-
-
-
-
$859
-
-
-
-
-
-
644 Broadway
N/A
Avg. Price
Past 12 months
Past 12 months
-
-
-
-
-
-
-
-
-
-
-
-
-
-
-
-
$3,435,000
-
-
-
-
-
-
644 Broadway
N/A
Median Price
Past 12 months
Past 12 months
-
-
-
-
-
-
-
-
-
-
-
-
-
-
-
-
$3,435,000
-
-
-
-
-
-
644 Broadway
N/A
Avg. Price / ft2
Past 12 months
Past 12 months
-
-
-
-
-
-
-
-
-
-
-
-
-
-
-
-
-
-
-
-
-
-
-
644 Broadway
N/A
Avg. Price
Past 12 months
Past 12 months
-
-
-
-
-
-
-
-
-
-
-
-
-
-
-
-
-
-
-
-
-
-
-
644 Broadway
N/A
Median Price
Past 12 months
Past 12 months
-
-
-
-
-
-
-
-
-
-
-
-
-
-
-
-
-
-
-
-
-
-
-
25 Minetta Lane
N/A
Avg. Price / ft2
Past 12 months
Past 12 months
-
$1,528
-
$1,366
$930
-
$2,768
-
-
$1,201
-
-
$923
$910
$873
$1,059
$1,200
$952
$896
$1,047
$901
-
$578
25 Minetta Lane
$766,667
Avg. Price
Past 12 months
Past 12 months
-
$947,500
$817,500
$740,000
$465,000
-
$1,915,000
$1,215,000
$840,000
$721,333
$587,283
$551,823
$488,000
$633,795
$513,333
$900,000
$723,400
$593,133
$907,500
$607,500
$704,235
-
$359,833
25 Minetta Lane
$775,000
Median Price
Past 12 months
Past 12 months
-
$947,500
$817,500
$740,000
$465,000
-
$2,100,000
$1,215,000
$840,000
$630,000
$587,283
$551,823
$470,000
$529,781
$515,000
$900,000
$720,000
$504,400
$907,500
$607,500
$735,000
-
$377,500
25 Minetta Lane
N/A
Avg. Price / ft2
Past 12 months
Past 12 months
-
$1,590
-
$1,366
$930
-
-
-
-
$1,070
-
-
$923
$910
$879
-
-
$841
$733
-
$744
-
-
25 Minetta Lane
$725,000
Avg. Price
Past 12 months
Past 12 months
-
$795,000
$640,000
$740,000
$465,000
-
-
-
-
$535,000
$587,283
-
$488,000
$489,320
$457,500
-
-
$464,700
$440,000
-
$445,589
-
-
25 Minetta Lane
$725,000
Median Price
Past 12 months
Past 12 months
-
$795,000
$640,000
$740,000
$465,000
-
-
-
-
$535,000
$587,283
-
$470,000
$486,250
$457,500
-
-
$464,700
$440,000
-
$445,589
-
-
25 Minetta Lane
N/A
Avg. Price / ft2
Past 12 months
Past 12 months
-
$1,467
-
-
-
-
$1,588
-
-
$1,332
-
-
-
-
$862
$1,059
$1,200
$1,063
-
$1,047
$1,059
-
$578
25 Minetta Lane
$850,000
Avg. Price
Past 12 months
Past 12 months
-
$1,100,000
$995,000
-
-
-
$1,350,000
$1,215,000
$840,000
$814,500
-
-
-
$826,428
$625,000
$900,000
$723,400
$850,000
-
$607,500
$876,667
-
$359,833
25 Minetta Lane
$850,000
Median Price
Past 12 months
Past 12 months
-
$1,100,000
$995,000
-
-
-
$1,350,000
$1,215,000
$840,000
$814,500
-
-
-
$849,626
$625,000
$900,000
$720,000
$850,000
-
$607,500
$900,000
-
$377,500
25 Minetta Lane
N/A
Avg. Price / ft2
Past 12 months
Past 12 months
-
-
-
-
-
-
$3,358
-
-
-
-
-
-
-
-
-
-
-
$1,058
-
-
-
-
25 Minetta Lane
N/A
Avg. Price
Past 12 months
Past 12 months
-
-
-
-
-
-
$2,197,500
-
-
-
-
-
-
-
-
-
-
-
$1,375,000
-
-
-
-
25 Minetta Lane
N/A
Median Price
Past 12 months
Past 12 months
-
-
-
-
-
-
$2,197,500
-
-
-
-
-
-
-
-
-
-
-
$1,375,000
-
-
-
-
25 Minetta Lane
N/A
Avg. Price / ft2
Past 12 months
Past 12 months
-
-
-
-
-
-
-
-
-
-
-
-
-
-
-
-
-
-
-
-
-
-
-
25 Minetta Lane
N/A
Avg. Price
Past 12 months
Past 12 months
-
-
-
-
-
-
-
-
-
-
-
-
-
-
-
-
-
-
-
-
-
-
-
25 Minetta Lane
N/A
Median Price
Past 12 months
Past 12 months
-
-
-
-
-
-
-
-
-
-
-
-
-
-
-
-
-
-
-
-
-
-
-
25 Minetta Lane
N/A
Avg. Price / ft2
Past 12 months
Past 12 months
-
-
-
-
-
-
-
-
-
-
-
-
-
-
-
-
-
-
-
-
-
-
-
25 Minetta Lane
N/A
Avg. Price
Past 12 months
Past 12 months
-
-
-
-
-
-
-
-
-
-
-
-
-
-
-
-
-
-
-
-
-
-
-
25 Minetta Lane
N/A
Median Price
Past 12 months
Past 12 months
-
-
-
-
-
-
-
-
-
-
-
-
-
-
-
-
-
-
-
-
-
-
-
15 West 11th Street
N/A
Avg. Price / ft2
Past 12 months
Past 12 months
-
-
-
-
-
-
-
-
-
-
-
-
$2,200
$1,278
-
-
-
$2,256
$1,333
-
$1,259
-
-
15 West 11th Street
$1,895,000
Avg. Price
Past 12 months
Past 12 months
-
-
-
-
-
-
$1,950,000
$9,995,000
$2,000,000
-
$1,875,000
$1,463,333
$2,906,800
$1,285,000
-
-
-
$2,479,500
$1,097,500
-
$1,762,500
$3,600,000
-
15 West 11th Street
$1,895,000
Median Price
Past 12 months
Past 12 months
-
-
-
-
-
-
$1,950,000
$9,995,000
$2,000,000
-
$1,875,000
$1,250,000
$2,075,000
$1,200,000
-
-
-
$2,479,500
$1,097,500
-
$1,762,500
$3,600,000
-
15 West 11th Street
N/A
Avg. Price / ft2
Past 12 months
Past 12 months
-
-
-
-
-
-
-
-
-
-
-
-
-
-
-
-
-
-
-
-
-
-
-
15 West 11th Street
N/A
Avg. Price
Past 12 months
Past 12 months
-
-
-
-
-
-
-
-
-
-
-
-
-
-
-
-
-
-
-
-
-
-
-
15 West 11th Street
N/A
Median Price
Past 12 months
Past 12 months
-
-
-
-
-
-
-
-
-
-
-
-
-
-
-
-
-
-
-
-
-
-
-
15 West 11th Street
N/A
Avg. Price / ft2
Past 12 months
Past 12 months
-
-
-
-
-
-
-
-
-
-
-
-
-
$1,278
-
-
-
-
$1,333
-
$1,039
-
-
15 West 11th Street
$1,895,000
Avg. Price
Past 12 months
Past 12 months
-
-
-
-
-
-
-
-
-
-
$1,100,000
$1,250,000
$1,294,667
$1,146,667
-
-
-
-
$1,097,500
-
$935,000
-
-
15 West 11th Street
$1,895,000
Median Price
Past 12 months
Past 12 months
-
-
-
-
-
-
-
-
-
-
$1,100,000
$1,250,000
$949,000
$1,150,000
-
-
-
-
$1,097,500
-
$935,000
-
-
15 West 11th Street
N/A
Avg. Price / ft2
Past 12 months
Past 12 months
-
-
-
-
-
-
-
-
-
-
-
-
$2,200
-
-
-
-
$2,256
-
-
$1,480
-
-
15 West 11th Street
N/A
Avg. Price
Past 12 months
Past 12 months
-
-
-
-
-
-
$1,950,000
-
$2,000,000
-
$2,650,000
$1,950,000
$3,850,000
$1,700,000
-
-
-
$2,479,500
-
-
$2,590,000
-
-
15 West 11th Street
N/A
Median Price
Past 12 months
Past 12 months
-
-
-
-
-
-
$1,950,000
-
$2,000,000
-
$2,650,000
$1,950,000
$3,850,000
$1,700,000
-
-
-
$2,479,500
-
-
$2,590,000
-
-
15 West 11th Street
N/A
Avg. Price / ft2
Past 12 months
Past 12 months
-
-
-
-
-
-
-
-
-
-
-
-
-
-
-
-
-
-
-
-
-
-
-
15 West 11th Street
N/A
Avg. Price
Past 12 months
Past 12 months
-
-
-
-
-
-
-
-
-
-
-
-
-
-
-
-
-
-
-
-
-
-
-
15 West 11th Street
N/A
Median Price
Past 12 months
Past 12 months
-
-
-
-
-
-
-
-
-
-
-
-
-
-
-
-
-
-
-
-
-
-
-
15 West 11th Street
N/A
Avg. Price / ft2
Past 12 months
Past 12 months
-
-
-
-
-
-
-
-
-
-
-
-
-
-
-
-
-
-
-
-
-
-
-
15 West 11th Street
N/A
Avg. Price
Past 12 months
Past 12 months
-
-
-
-
-
-
-
$9,995,000
-
-
-
-
$6,800,000
-
-
-
-
-
-
-
-
$3,600,000
-
15 West 11th Street
N/A
Median Price
Past 12 months
Past 12 months
-
-
-
-
-
-
-
$9,995,000
-
-
-
-
$6,800,000
-
-
-
-
-
-
-
-
$3,600,000
-
15 West 11th Street
N/A
Avg. Price / ft2
Past 12 months
Past 12 months
-
-
-
-
-
-
-
-
-
-
-
-
-
-
-
-
-
-
-
-
-
-
-
15 West 11th Street
N/A
Avg. Price
Past 12 months
Past 12 months
-
-
-
-
-
-
-
-
-
-
-
-
-
-
-
-
-
-
-
-
-
-
-
15 West 11th Street
N/A
Median Price
Past 12 months
Past 12 months
-
-
-
-
-
-
-
-
-
-
-
-
-
-
-
-
-
-
-
-
-
-
-
30 East 10th Street
N/A
Avg. Price / ft2
Past 12 months
Past 12 months
-
-
-
-
$1,267
-
$1,667
$1,544
-
$1,333
-
-
$1,167
-
-
-
-
-
-
-
-
$806
-
30 East 10th Street
$5,850,000
Avg. Price
Past 12 months
Past 12 months
-
-
-
-
$2,280,000
-
$2,750,000
$5,325,000
$2,200,000
$4,000,000
-
-
$2,100,000
-
-
-
-
-
-
-
-
$1,450,000
-
30 East 10th Street
$5,850,000
Median Price
Past 12 months
Past 12 months
-
-
-
-
$2,280,000
-
$2,750,000
$5,325,000
$2,200,000
$4,000,000
-
-
$2,100,000
-
-
-
-
-
-
-
-
$1,450,000
-
30 East 10th Street
N/A
Avg. Price / ft2
Past 12 months
Past 12 months
-
-
-
-
-
-
-
-
-
-
-
-
-
-
-
-
-
-
-
-
-
-
-
30 East 10th Street
N/A
Avg. Price
Past 12 months
Past 12 months
-
-
-
-
-
-
-
-
-
-
-
-
-
-
-
-
-
-
-
-
-
-
-
30 East 10th Street
N/A
Median Price
Past 12 months
Past 12 months
-
-
-
-
-
-
-
-
-
-
-
-
-
-
-
-
-
-
-
-
-
-
-
30 East 10th Street
N/A
Avg. Price / ft2
Past 12 months
Past 12 months
-
-
-
-
$1,267
-
-
-
-
-
-
-
$1,167
-
-
-
-
-
-
-
-
$806
-
30 East 10th Street
N/A
Avg. Price
Past 12 months
Past 12 months
-
-
-
-
$2,280,000
-
-
-
-
-
-
-
$2,100,000
-
-
-
-
-
-
-
-
$1,450,000
-
30 East 10th Street
N/A
Median Price
Past 12 months
Past 12 months
-
-
-
-
$2,280,000
-
-
-
-
-
-
-
$2,100,000
-
-
-
-
-
-
-
-
$1,450,000
-
30 East 10th Street
N/A
Avg. Price / ft2
Past 12 months
Past 12 months
-
-
-
-
-
-
-
$1,544
-
-
-
-
-
-
-
-
-
-
-
-
-
-
-
30 East 10th Street
N/A
Avg. Price
Past 12 months
Past 12 months
-
-
-
-
-
-
-
$2,625,000
-
-
-
-
-
-
-
-
-
-
-
-
-
-
-
30 East 10th Street
N/A
Median Price
Past 12 months
Past 12 months
-
-
-
-
-
-
-
$2,625,000
-
-
-
-
-
-
-
-
-
-
-
-
-
-
-
30 East 10th Street
N/A
Avg. Price / ft2
Past 12 months
Past 12 months
-
-
-
-
-
-
$1,667
-
-
$1,333
-
-
-
-
-
-
-
-
-
-
-
-
-
30 East 10th Street
$5,850,000
Avg. Price
Past 12 months
Past 12 months
-
-
-
-
-
-
$2,750,000
$8,025,000
$2,200,000
$4,000,000
-
-
-
-
-
-
-
-
-
-
-
-
-
30 East 10th Street
$5,850,000
Median Price
Past 12 months
Past 12 months
-
-
-
-
-
-
$2,750,000
$8,025,000
$2,200,000
$4,000,000
-
-
-
-
-
-
-
-
-
-
-
-
-
30 East 10th Street
N/A
Avg. Price / ft2
Past 12 months
Past 12 months
-
-
-
-
-
-
-
-
-
-
-
-
-
-
-
-
-
-
-
-
-
-
-
30 East 10th Street
N/A
Avg. Price
Past 12 months
Past 12 months
-
-
-
-
-
-
-
-
-
-
-
-
-
-
-
-
-
-
-
-
-
-
-
30 East 10th Street
N/A
Median Price
Past 12 months
Past 12 months
-
-
-
-
-
-
-
-
-
-
-
-
-
-
-
-
-
-
-
-
-
-
-
30 East 10th Street
N/A
Avg. Price / ft2
Past 12 months
Past 12 months
-
-
-
-
-
-
-
-
-
-
-
-
-
-
-
-
-
-
-
-
-
-
-
30 East 10th Street
N/A
Avg. Price
Past 12 months
Past 12 months
-
-
-
-
-
-
-
-
-
-
-
-
-
-
-
-
-
-
-
-
-
-
-
30 East 10th Street
N/A
Median Price
Past 12 months
Past 12 months
-
-
-
-
-
-
-
-
-
-
-
-
-
-
-
-
-
-
-
-
-
-
-
840 Broadway
N/A
Avg. Price / ft2
Past 12 months
Past 12 months
-
$1,008
-
-
-
$1,383
-
$1,400
-
-
-
-
-
-
-
-
-
-
-
-
-
-
-
840 Broadway
N/A
Avg. Price
Past 12 months
Past 12 months
-
$3,025,000
-
-
-
$4,150,000
-
$4,200,000
-
-
-
-
-
-
-
-
-
$3,850,000
$3,200,000
-
-
-
-
840 Broadway
N/A
Median Price
Past 12 months
Past 12 months
-
$3,025,000
-
-
-
$4,150,000
-
$4,200,000
-
-
-
-
-
-
-
-
-
$3,850,000
$3,200,000
-
-
-
-
840 Broadway
N/A
Avg. Price / ft2
Past 12 months
Past 12 months
-
-
-
-
-
-
-
-
-
-
-
-
-
-
-
-
-
-
-
-
-
-
-
840 Broadway
N/A
Avg. Price
Past 12 months
Past 12 months
-
-
-
-
-
-
-
-
-
-
-
-
-
-
-
-
-
-
-
-
-
-
-
840 Broadway
N/A
Median Price
Past 12 months
Past 12 months
-
-
-
-
-
-
-
-
-
-
-
-
-
-
-
-
-
-
-
-
-
-
-
840 Broadway
N/A
Avg. Price / ft2
Past 12 months
Past 12 months
-
$1,008
-
-
-
-
-
-
-
-
-
-
-
-
-
-
-
-
-
-
-
-
-
840 Broadway
N/A
Avg. Price
Past 12 months
Past 12 months
-
$3,025,000
-
-
-
-
-
-
-
-
-
-
-
-
-
-
-
-
-
-
-
-
-
840 Broadway
N/A
Median Price
Past 12 months
Past 12 months
-
$3,025,000
-
-
-
-
-
-
-
-
-
-
-
-
-
-
-
-
-
-
-
-
-
840 Broadway
N/A
Avg. Price / ft2
Past 12 months
Past 12 months
-
-
-
-
-
$1,383
-
$1,400
-
-
-
-
-
-
-
-
-
-
-
-
-
-
-
840 Broadway
N/A
Avg. Price
Past 12 months
Past 12 months
-
-
-
-
-
$4,150,000
-
$4,200,000
-
-
-
-
-
-
-
-
-
-
-
-
-
-
-
840 Broadway
N/A
Median Price
Past 12 months
Past 12 months
-
-
-
-
-
$4,150,000
-
$4,200,000
-
-
-
-
-
-
-
-
-
-
-
-
-
-
-
840 Broadway
N/A
Avg. Price / ft2
Past 12 months
Past 12 months
-
-
-
-
-
-
-
-
-
-
-
-
-
-
-
-
-
-
-
-
-
-
-
840 Broadway
N/A
Avg. Price
Past 12 months
Past 12 months
-
-
-
-
-
-
-
-
-
-
-
-
-
-
-
-
-
-
-
-
-
-
-
840 Broadway
N/A
Median Price
Past 12 months
Past 12 months
-
-
-
-
-
-
-
-
-
-
-
-
-
-
-
-
-
-
-
-
-
-
-
840 Broadway
N/A
Avg. Price / ft2
Past 12 months
Past 12 months
-
-
-
-
-
-
-
-
-
-
-
-
-
-
-
-
-
-
-
-
-
-
-
840 Broadway
N/A
Avg. Price
Past 12 months
Past 12 months
-
-
-
-
-
-
-
-
-
-
-
-
-
-
-
-
-
-
-
-
-
-
-
840 Broadway
N/A
Median Price
Past 12 months
Past 12 months
-
-
-
-
-
-
-
-
-
-
-
-
-
-
-
-
-
-
-
-
-
-
-
61 East 11th Street
N/A
Avg. Price / ft2
Past 12 months
Past 12 months
-
-
$1,227
-
-
$1,727
-
-
-
-
-
-
-
-
-
-
-
-
$1,234
-
-
-
-
61 East 11th Street
N/A
Avg. Price
Past 12 months
Past 12 months
-
-
$2,700,000
-
-
$3,800,000
-
-
-
-
-
-
-
-
-
-
-
-
$2,715,000
-
-
-
-
61 East 11th Street
N/A
Median Price
Past 12 months
Past 12 months
-
-
$2,700,000
-
-
$3,800,000
-
-
-
-
-
-
-
-
-
-
-
-
$2,715,000
-
-
-
-
61 East 11th Street
N/A
Avg. Price / ft2
Past 12 months
Past 12 months
-
-
-
-
-
-
-
-
-
-
-
-
-
-
-
-
-
-
-
-
-
-
-
61 East 11th Street
N/A
Avg. Price
Past 12 months
Past 12 months
-
-
-
-
-
-
-
-
-
-
-
-
-
-
-
-
-
-
-
-
-
-
-
61 East 11th Street
N/A
Median Price
Past 12 months
Past 12 months
-
-
-
-
-
-
-
-
-
-
-
-
-
-
-
-
-
-
-
-
-
-
-
61 East 11th Street
N/A
Avg. Price / ft2
Past 12 months
Past 12 months
-
-
$1,227
-
-
-
-
-
-
-
-
-
-
-
-
-
-
-
-
-
-
-
-
61 East 11th Street
N/A
Avg. Price
Past 12 months
Past 12 months
-
-
$2,700,000
-
-
-
-
-
-
-
-
-
-
-
-
-
-
-
-
-
-
-
-
61 East 11th Street
N/A
Median Price
Past 12 months
Past 12 months
-
-
$2,700,000
-
-
-
-
-
-
-
-
-
-
-
-
-
-
-
-
-
-
-
-
61 East 11th Street
N/A
Avg. Price / ft2
Past 12 months
Past 12 months
-
-
-
-
-
-
-
-
-
-
-
-
-
-
-
-
-
-
$1,184
-
-
-
-
61 East 11th Street
N/A
Avg. Price
Past 12 months
Past 12 months
-
-
-
-
-
-
-
-
-
-
-
-
-
-
-
-
-
-
$2,605,000
-
-
-
-
61 East 11th Street
N/A
Median Price
Past 12 months
Past 12 months
-
-
-
-
-
-
-
-
-
-
-
-
-
-
-
-
-
-
$2,605,000
-
-
-
-
61 East 11th Street
N/A
Avg. Price / ft2
Past 12 months
Past 12 months
-
-
-
-
-
$1,727
-
-
-
-
-
-
-
-
-
-
-
-
$1,284
-
-
-
-
61 East 11th Street
N/A
Avg. Price
Past 12 months
Past 12 months
-
-
-
-
-
$3,800,000
-
-
-
-
-
-
-
-
-
-
-
-
$2,825,000
-
-
-
-
61 East 11th Street
N/A
Median Price
Past 12 months
Past 12 months
-
-
-
-
-
$3,800,000
-
-
-
-
-
-
-
-
-
-
-
-
$2,825,000
-
-
-
-
61 East 11th Street
N/A
Avg. Price / ft2
Past 12 months
Past 12 months
-
-
-
-
-
-
-
-
-
-
-
-
-
-
-
-
-
-
-
-
-
-
-
61 East 11th Street
N/A
Avg. Price
Past 12 months
Past 12 months
-
-
-
-
-
-
-
-
-
-
-
-
-
-
-
-
-
-
-
-
-
-
-
61 East 11th Street
N/A
Median Price
Past 12 months
Past 12 months
-
-
-
-
-
-
-
-
-
-
-
-
-
-
-
-
-
-
-
-
-
-
-
61 East 11th Street
N/A
Avg. Price / ft2
Past 12 months
Past 12 months
-
-
-
-
-
-
-
-
-
-
-
-
-
-
-
-
-
-
-
-
-
-
-
61 East 11th Street
N/A
Avg. Price
Past 12 months
Past 12 months
-
-
-
-
-
-
-
-
-
-
-
-
-
-
-
-
-
-
-
-
-
-
-
61 East 11th Street
N/A
Median Price
Past 12 months
Past 12 months
-
-
-
-
-
-
-
-
-
-
-
-
-
-
-
-
-
-
-
-
-
-
-
Snug Harbor
N/A
Avg. Price / ft2
Past 12 months
Past 12 months
$1,320
$1,626
$2,174
-
$1,723
-
$1,517
$2,000
$1,379
$1,510
-
$1,330
$1,377
$768
$795
$839
$842
$1,126
$916
$1,019
$634
-
$558
Snug Harbor
$1,187,500
Avg. Price
Past 12 months
Past 12 months
$1,820,000
$2,018,333
$1,950,000
-
$1,995,000
-
$2,398,250
$1,955,000
$1,712,500
$1,853,133
$1,550,000
$2,255,000
$1,531,667
$1,087,500
$1,502,500
$650,000
$950,000
$2,210,000
$972,500
$1,412,500
$1,516,333
-
$912,500
Snug Harbor
$1,187,500
Median Price
Past 12 months
Past 12 months
$1,820,000
$2,195,000
$1,950,000
-
$1,836,000
-
$2,398,250
$1,955,000
$1,712,500
$1,873,550
$1,550,000
$2,475,000
$1,640,000
$1,087,500
$1,655,000
$650,000
$950,000
$2,210,000
$972,500
$1,412,500
$1,450,000
-
$912,500
Snug Harbor
N/A
Avg. Price / ft2
Past 12 months
Past 12 months
-
-
-
-
-
-
-
-
-
-
-
-
-
-
-
-
-
-
-
-
-
-
-
Snug Harbor
N/A
Avg. Price
Past 12 months
Past 12 months
-
-
-
-
-
-
-
-
-
-
-
-
-
-
-
-
-
-
-
-
-
-
-
Snug Harbor
N/A
Median Price
Past 12 months
Past 12 months
-
-
-
-
-
-
-
-
-
-
-
-
-
-
-
-
-
-
-
-
-
-
-
Snug Harbor
N/A
Avg. Price / ft2
Past 12 months
Past 12 months
-
-
$2,174
-
-
-
$1,416
-
-
$2,036
-
$1,194
-
-
-
$839
$722
-
$961
-
-
-
-
Snug Harbor
$1,187,500
Avg. Price
Past 12 months
Past 12 months
-
-
$2,000,000
-
-
-
$1,097,500
$1,310,000
-
$1,451,775
-
$925,000
-
-
-
$650,000
$650,000
-
$745,000
-
$949,000
-
-
Snug Harbor
$1,187,500
Median Price
Past 12 months
Past 12 months
-
-
$2,000,000
-
-
-
$1,097,500
$1,310,000
-
$1,451,775
-
$925,000
-
-
-
$650,000
$650,000
-
$745,000
-
$949,000
-
-
Snug Harbor
N/A
Avg. Price / ft2
Past 12 months
Past 12 months
$1,320
$1,626
-
-
$1,723
-
-
$2,000
$1,379
$1,603
-
-
$1,215
$841
-
-
$962
-
$870
$1,068
-
-
$558
Snug Harbor
N/A
Avg. Price
Past 12 months
Past 12 months
$1,820,000
$1,877,500
$1,900,000
-
$1,995,000
-
-
$2,600,000
$1,712,500
$2,183,558
$1,550,000
-
$1,297,500
$925,000
$1,350,000
-
$1,250,000
$1,845,000
$1,200,000
$1,175,000
$2,150,000
-
$912,500
Snug Harbor
N/A
Median Price
Past 12 months
Past 12 months
$1,820,000
$1,877,500
$1,900,000
-
$1,836,000
-
-
$2,600,000
$1,712,500
$2,183,558
$1,550,000
-
$1,297,500
$925,000
$1,350,000
-
$1,250,000
$1,845,000
$1,200,000
$1,175,000
$2,150,000
-
$912,500
Snug Harbor
N/A
Avg. Price / ft2
Past 12 months
Past 12 months
-
-
-
-
-
-
-
-
-
$798
-
$1,325
$1,538
$694
$795
-
-
-
-
$971
-
-
-
Snug Harbor
N/A
Avg. Price
Past 12 months
Past 12 months
-
-
-
-
-
-
-
-
-
$1,995,000
-
$2,475,000
$2,000,000
$1,250,000
$1,655,000
-
-
-
-
$1,650,000
-
-
-
Snug Harbor
N/A
Median Price
Past 12 months
Past 12 months
-
-
-
-
-
-
-
-
-
$1,995,000
-
$2,475,000
$2,000,000
$1,250,000
$1,655,000
-
-
-
-
$1,650,000
-
-
-
Snug Harbor
N/A
Avg. Price / ft2
Past 12 months
Past 12 months
-
-
-
-
-
-
$1,617
-
-
-
-
$1,471
-
-
-
-
-
$1,126
-
-
$634
-
-
Snug Harbor
N/A
Avg. Price
Past 12 months
Past 12 months
-
-
-
-
-
-
$3,699,000
-
-
-
-
$3,365,000
-
-
-
-
-
$2,575,000
-
-
$1,450,000
-
-
Snug Harbor
N/A
Median Price
Past 12 months
Past 12 months
-
-
-
-
-
-
$3,699,000
-
-
-
-
$3,365,000
-
-
-
-
-
$2,575,000
-
-
$1,450,000
-
-
Snug Harbor
N/A
Avg. Price / ft2
Past 12 months
Past 12 months
-
-
-
-
-
-
-
-
-
-
-
-
-
-
-
-
-
-
-
-
-
-
-
Snug Harbor
N/A
Avg. Price
Past 12 months
Past 12 months
-
-
-
-
-
-
-
-
-
-
-
-
-
-
-
-
-
-
-
-
-
-
-
Snug Harbor
N/A
Median Price
Past 12 months
Past 12 months
-
-
-
-
-
-
-
-
-
-
-
-
-
-
-
-
-
-
-
-
-
-
-
Parker Towne House
N/A
Avg. Price / ft2
Past 12 months
Past 12 months
-
$1,370
-
$1,848
$1,345
$1,254
$1,875
$1,381
$1,519
-
$1,275
$1,334
$1,049
$945
$972
$922
$799
$1,360
$733
$819
$636
$612
$592
Parker Towne House
$747,500
Avg. Price
Past 12 months
Past 12 months
$2,400,000
$1,112,750
$1,001,250
$1,200,125
$1,005,000
$914,167
$1,850,000
$1,307,500
$994,364
$1,184,494
$960,086
$1,385,750
$577,000
$671,251
$989,000
$710,333
$433,083
$1,299,875
$480,667
$603,913
$555,029
$411,350
$503,689
Parker Towne House
$747,500
Median Price
Past 12 months
Past 12 months
$2,400,000
$650,500
$640,000
$1,225,000
$680,000
$610,000
$1,850,000
$1,550,000
$775,000
$705,000
$660,000
$1,075,000
$577,000
$463,000
$1,070,000
$430,000
$442,000
$790,000
$456,000
$457,565
$475,000
$350,000
$569,000
Parker Towne House
N/A
Avg. Price / ft2
Past 12 months
Past 12 months
-
$1,370
-
$1,182
$1,082
$1,215
-
$1,243
$1,293
-
$1,199
$1,171
$1,049
$945
$944
$852
$799
$988
$829
$756
$794
$612
$491
Parker Towne House
$760,000
Avg. Price
Past 12 months
Past 12 months
-
$633,667
$467,500
$650,000
$595,000
$608,750
-
$643,750
$718,001
$576,741
$617,800
$563,333
$577,000
$425,100
$425,000
$427,500
$438,364
$395,000
$434,500
$369,000
$370,000
$339,071
$238,940
Parker Towne House
$760,000
Median Price
Past 12 months
Past 12 months
-
$601,000
$467,500
$650,000
$595,000
$608,750
-
$643,750
$739,253
$576,741
$617,800
$550,000
$577,000
$449,000
$425,000
$427,500
$449,000
$395,000
$434,500
$375,000
$370,000
$335,000
$270,000
Parker Towne House
N/A
Avg. Price / ft2
Past 12 months
Past 12 months
-
-
-
$2,400
-
-
-
-
$1,867
-
-
-
-
-
$1,070
-
-
-
$637
-
$611
-
-
Parker Towne House
$735,000
Avg. Price
Past 12 months
Past 12 months
-
-
$795,000
$1,800,000
-
-
-
-
$1,195,000
-
$800,000
$1,550,000
-
-
$1,070,000
-
-
-
$573,000
-
$667,550
$600,000
$602,000
Parker Towne House
$735,000
Median Price
Past 12 months
Past 12 months
-
-
$795,000
$1,800,000
-
-
-
-
$1,250,000
-
$800,000
$1,550,000
-
-
$1,070,000
-
-
-
$573,000
-
$660,100
$600,000
$602,000
Parker Towne House
N/A
Avg. Price / ft2
Past 12 months
Past 12 months
-
-
-
$1,963
$1,872
$1,293
$1,875
$1,520
$1,850
-
$1,350
$1,824
-
-
$937
$1,063
-
$1,484
-
$925
$528
-
$692
Parker Towne House
N/A
Avg. Price
Past 12 months
Past 12 months
$2,400,000
-
$2,275,000
$1,962,500
$1,825,000
$1,525,000
$1,850,000
$1,750,000
$1,850,000
$2,400,000
$1,925,000
$2,537,250
-
$1,160,000
$1,150,000
$1,276,000
-
$2,204,750
-
$944,750
$475,000
-
$802,500
Parker Towne House
N/A
Median Price
Past 12 months
Past 12 months
$2,400,000
-
$2,275,000
$1,962,500
$1,825,000
$1,525,000
$1,850,000
$1,700,000
$1,850,000
$2,400,000
$1,925,000
$2,537,250
-
$1,160,000
$1,195,000
$1,276,000
-
$2,096,000
-
$942,000
$475,000
-
$802,500
Parker Towne House
N/A
Avg. Price / ft2
Past 12 months
Past 12 months
-
-
-
-
-
-
-
-
-
-
-
-
-
-
-
-
-
-
-
-
-
-
-
Parker Towne House
N/A
Avg. Price
Past 12 months
Past 12 months
-
-
-
-
-
-
-
-
-
-
-
-
-
-
-
-
-
-
-
-
-
-
-
Parker Towne House
N/A
Median Price
Past 12 months
Past 12 months
-
-
-
-
-
-
-
-
-
-
-
-
-
-
-
-
-
-
-
-
-
-
-
Parker Towne House
N/A
Avg. Price / ft2
Past 12 months
Past 12 months
-
-
-
-
-
-
-
-
-
-
-
-
-
-
-
-
-
-
-
-
-
-
-
Parker Towne House
N/A
Avg. Price
Past 12 months
Past 12 months
-
$2,550,000
-
-
-
-
-
-
-
-
-
-
-
-
-
-
-
-
-
-
-
-
-
Parker Towne House
N/A
Median Price
Past 12 months
Past 12 months
-
$2,550,000
-
-
-
-
-
-
-
-
-
-
-
-
-
-
-
-
-
-
-
-
-
Parker Towne House
N/A
Avg. Price / ft2
Past 12 months
Past 12 months
-
-
-
-
-
-
-
-
-
-
-
-
-
-
-
-
-
-
-
-
-
-
-
Parker Towne House
N/A
Avg. Price
Past 12 months
Past 12 months
-
-
-
-
-
-
-
-
-
-
-
-
-
-
-
-
-
-
-
-
-
-
-
Parker Towne House
N/A
Median Price
Past 12 months
Past 12 months
-
-
-
-
-
-
-
-
-
-
-
-
-
-
-
-
-
-
-
-
-
-
-