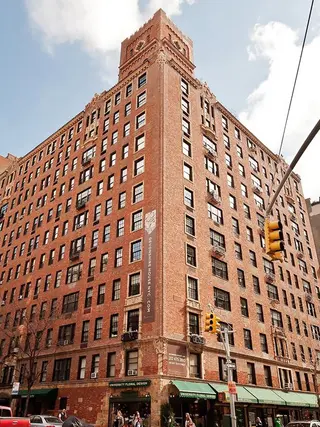
Devonshire House, 28 East 10th Street: Price Comparison
between University Place & Broadway Building Profile
Devonshire House
$2,393
Avg. Price / ft2
Past 12 months
Past 12 months
2025
$2,393
2024
$2,300
2023
$2,486
2022
$2,537
2021
$1,941
2020
$2,169
2019
$2,077
2018
$2,216
2017
$2,404
2016
$3,105
2015
$2,139
2014
$2,175
2013
$1,958
2012
$2,118
2011
$1,613
2010
$1,524
2009
-
2008
-
2007
-
2006
-
2005
-
2004
-
2003
-
Devonshire House
$2,957,500
Avg. Price
Past 12 months
Past 12 months
2025
$2,957,500
2024
$2,838,962
2023
$3,124,000
2022
$2,926,875
2021
$2,641,610
2020
$3,475,000
2019
$3,105,105
2018
$3,128,145
2017
$2,706,495
2016
$4,323,527
2015
$1,993,750
2014
$1,890,546
2013
$3,117,088
2012
$2,923,465
2011
$2,409,241
2010
$2,385,833
2009
-
2008
-
2007
-
2006
-
2005
-
2004
-
2003
-
Devonshire House
$2,393
Median Price / ft2
Past 12 months
Past 12 months
2025
$2,393
2024
$2,608
2023
$2,477
2022
$2,489
2021
$1,960
2020
$2,169
2019
$1,998
2018
$2,151
2017
$2,431
2016
$2,965
2015
$2,082
2014
$2,108
2013
$2,179
2012
$2,053
2011
$1,604
2010
$1,635
2009
-
2008
-
2007
-
2006
-
2005
-
2004
-
2003
-
Devonshire House
$2,957,500
Median Price
Past 12 months
Past 12 months
2025
$2,957,500
2024
$2,500,000
2023
$2,800,000
2022
$2,200,000
2021
$2,200,000
2020
$3,475,000
2019
$2,670,000
2018
$2,950,000
2017
$2,100,000
2016
$4,322,500
2015
$1,737,500
2014
$1,830,064
2013
$2,250,000
2012
$2,425,000
2011
$1,339,408
2010
$1,883,762
2009
-
2008
-
2007
-
2006
-
2005
-
2004
-
2003
-
Devonshire House
N/A
Avg. Price / ft2
Past 12 months
Past 12 months
2025
-
2024
-
2023
$2,378
2022
-
2021
-
2020
-
2019
-
2018
-
2017
$2,797
2016
$4,378
2015
-
2014
$2,182
2013
-
2012
-
2011
$1,254
2010
$995
2009
-
2008
-
2007
-
2006
-
2005
-
2004
-
2003
-
Devonshire House
N/A
Avg. Price
Past 12 months
Past 12 months
2025
-
2024
-
2023
$975,000
2022
-
2021
-
2020
$1,050,000
2019
-
2018
-
2017
$1,314,613
2016
$1,795,000
2015
-
2014
$1,025,500
2013
-
2012
-
2011
$623,971
2010
$435,500
2009
-
2008
-
2007
-
2006
-
2005
-
2004
-
2003
-
Devonshire House
N/A
Median Price / ft2
Past 12 months
Past 12 months
2025
-
2024
-
2023
$2,378
2022
-
2021
-
2020
-
2019
-
2018
-
2017
$2,797
2016
$4,378
2015
-
2014
$2,182
2013
-
2012
-
2011
$1,301
2010
$995
2009
-
2008
-
2007
-
2006
-
2005
-
2004
-
2003
-
Devonshire House
N/A
Median Price
Past 12 months
Past 12 months
2025
-
2024
-
2023
$975,000
2022
-
2021
-
2020
$1,050,000
2019
-
2018
-
2017
$1,314,613
2016
$1,795,000
2015
-
2014
$1,025,500
2013
-
2012
-
2011
$611,459
2010
$435,500
2009
-
2008
-
2007
-
2006
-
2005
-
2004
-
2003
-
Devonshire House
$2,016
Avg. Price / ft2
Past 12 months
Past 12 months
2025
$2,016
2024
$2,976
2023
$2,851
2022
$2,495
2021
$1,921
2020
-
2019
-
2018
$2,382
2017
$2,257
2016
$2,109
2015
$1,785
2014
$2,243
2013
$1,732
2012
$2,130
2011
$1,361
2010
$1,507
2009
-
2008
-
2007
-
2006
-
2005
-
2004
-
2003
-
Devonshire House
$1,665,000
Avg. Price
Past 12 months
Past 12 months
2025
$1,665,000
2024
$2,500,000
2023
$2,395,000
2022
$1,968,000
2021
$1,633,219
2020
-
2019
-
2018
$2,150,054
2017
$1,809,336
2016
$1,624,109
2015
$1,491,667
2014
$1,830,064
2013
$1,365,000
2012
$2,047,106
2011
$1,094,409
2010
$1,353,363
2009
-
2008
-
2007
-
2006
-
2005
-
2004
-
2003
-
Devonshire House
$2,016
Median Price / ft2
Past 12 months
Past 12 months
2025
$2,016
2024
$2,976
2023
$2,851
2022
$2,500
2021
$1,921
2020
-
2019
-
2018
$2,230
2017
$2,301
2016
$2,109
2015
$1,665
2014
$2,243
2013
$1,271
2012
$1,998
2011
$1,486
2010
$1,563
2009
-
2008
-
2007
-
2006
-
2005
-
2004
-
2003
-
Devonshire House
$1,665,000
Median Price
Past 12 months
Past 12 months
2025
$1,665,000
2024
$2,500,000
2023
$2,395,000
2022
$2,100,000
2021
$1,633,219
2020
-
2019
-
2018
$2,090,163
2017
$1,810,000
2016
$1,624,109
2015
$1,375,000
2014
$1,830,064
2013
$1,050,000
2012
$1,610,000
2011
$1,200,000
2010
$1,368,431
2009
-
2008
-
2007
-
2006
-
2005
-
2004
-
2003
-
Devonshire House
$2,771
Avg. Price / ft2
Past 12 months
Past 12 months
2025
$2,771
2024
$1,961
2023
$2,519
2022
$2,607
2021
-
2020
-
2019
$2,186
2018
$2,064
2017
$2,548
2016
$3,348
2015
$3,202
2014
-
2013
$1,118
2012
$1,968
2011
$1,865
2010
$1,236
2009
-
2008
-
2007
-
2006
-
2005
-
2004
-
2003
-
Devonshire House
$4,250,000
Avg. Price
Past 12 months
Past 12 months
2025
$4,250,000
2024
$3,008,443
2023
$3,300,000
2022
$4,525,000
2021
-
2020
-
2019
$2,430,957
2018
$3,066,667
2017
$2,900,000
2016
$6,850,000
2015
$3,500,000
2014
-
2013
$1,094,619
2012
$2,851,006
2011
$2,839,644
2010
$1,656,894
2009
-
2008
-
2007
-
2006
-
2005
-
2004
-
2003
-
Devonshire House
$2,771
Median Price / ft2
Past 12 months
Past 12 months
2025
$2,771
2024
$1,961
2023
$2,519
2022
$2,477
2021
-
2020
-
2019
$2,186
2018
$2,151
2017
$2,548
2016
$3,348
2015
$3,202
2014
-
2013
$1,118
2012
$1,968
2011
$1,914
2010
$1,311
2009
-
2008
-
2007
-
2006
-
2005
-
2004
-
2003
-
Devonshire House
$4,250,000
Median Price
Past 12 months
Past 12 months
2025
$4,250,000
2024
$3,008,443
2023
$3,300,000
2022
$3,800,000
2021
-
2020
-
2019
$2,430,957
2018
$3,300,000
2017
$2,900,000
2016
$6,850,000
2015
$3,500,000
2014
-
2013
$1,094,619
2012
$2,851,006
2011
$2,494,712
2010
$1,891,881
2009
-
2008
-
2007
-
2006
-
2005
-
2004
-
2003
-
Devonshire House
N/A
Avg. Price / ft2
Past 12 months
Past 12 months
2025
-
2024
-
2023
-
2022
-
2021
$1,960
2020
-
2019
$2,005
2018
$2,196
2017
$2,453
2016
-
2015
-
2014
$2,033
2013
$2,465
2012
$2,003
2011
$2,096
2010
$1,730
2009
-
2008
-
2007
-
2006
-
2005
-
2004
-
2003
-
Devonshire House
N/A
Avg. Price
Past 12 months
Past 12 months
2025
-
2024
-
2023
-
2022
-
2021
$3,650,000
2020
-
2019
$3,442,180
2018
$4,687,500
2017
$3,900,000
2016
-
2015
-
2014
$2,876,556
2013
$5,543,333
2012
$4,550,000
2011
$5,736,354
2010
$3,712,820
2009
-
2008
-
2007
-
2006
-
2005
-
2004
-
2003
-
Devonshire House
N/A
Median Price / ft2
Past 12 months
Past 12 months
2025
-
2024
-
2023
-
2022
-
2021
$1,960
2020
-
2019
$1,998
2018
$2,196
2017
$2,453
2016
-
2015
-
2014
$2,033
2013
$2,470
2012
$2,003
2011
$1,971
2010
$1,714
2009
-
2008
-
2007
-
2006
-
2005
-
2004
-
2003
-
Devonshire House
N/A
Median Price
Past 12 months
Past 12 months
2025
-
2024
-
2023
-
2022
-
2021
$3,650,000
2020
-
2019
$3,525,000
2018
$4,687,500
2017
$3,900,000
2016
-
2015
-
2014
$2,876,556
2013
$5,500,000
2012
$4,550,000
2011
$4,264,431
2010
$3,825,000
2009
-
2008
-
2007
-
2006
-
2005
-
2004
-
2003
-
Devonshire House
N/A
Avg. Price / ft2
Past 12 months
Past 12 months
2025
-
2024
-
2023
$2,161
2022
-
2021
-
2020
$2,169
2019
-
2018
-
2017
$2,409
2016
$2,583
2015
-
2014
-
2013
-
2012
$2,463
2011
-
2010
$1,913
2009
-
2008
-
2007
-
2006
-
2005
-
2004
-
2003
-
Devonshire House
N/A
Avg. Price
Past 12 months
Past 12 months
2025
-
2024
-
2023
$5,650,000
2022
-
2021
-
2020
$5,900,000
2019
-
2018
-
2017
$6,300,000
2016
$7,025,000
2015
-
2014
-
2013
-
2012
$6,700,000
2011
-
2010
$5,100,000
2009
-
2008
-
2007
-
2006
-
2005
-
2004
-
2003
-
Devonshire House
N/A
Median Price / ft2
Past 12 months
Past 12 months
2025
-
2024
-
2023
$2,161
2022
-
2021
-
2020
$2,169
2019
-
2018
-
2017
$2,409
2016
$2,583
2015
-
2014
-
2013
-
2012
$2,463
2011
-
2010
$1,912
2009
-
2008
-
2007
-
2006
-
2005
-
2004
-
2003
-
Devonshire House
N/A
Median Price
Past 12 months
Past 12 months
2025
-
2024
-
2023
$5,650,000
2022
-
2021
-
2020
$5,900,000
2019
-
2018
-
2017
$6,300,000
2016
$7,025,000
2015
-
2014
-
2013
-
2012
$6,700,000
2011
-
2010
$5,200,000
2009
-
2008
-
2007
-
2006
-
2005
-
2004
-
2003
-
Devonshire House
N/A
Avg. Price / ft2
Past 12 months
Past 12 months
2025
-
2024
-
2023
-
2022
-
2021
-
2020
-
2019
-
2018
-
2017
-
2016
-
2015
-
2014
-
2013
-
2012
-
2011
-
2010
-
2009
-
2008
-
2007
-
2006
-
2005
-
2004
-
2003
-
Devonshire House
N/A
Avg. Price
Past 12 months
Past 12 months
2025
-
2024
-
2023
-
2022
-
2021
-
2020
-
2019
-
2018
-
2017
-
2016
-
2015
-
2014
-
2013
-
2012
-
2011
-
2010
-
2009
-
2008
-
2007
-
2006
-
2005
-
2004
-
2003
-
Devonshire House
N/A
Median Price / ft2
Past 12 months
Past 12 months
2025
-
2024
-
2023
-
2022
-
2021
-
2020
-
2019
-
2018
-
2017
-
2016
-
2015
-
2014
-
2013
-
2012
-
2011
-
2010
-
2009
-
2008
-
2007
-
2006
-
2005
-
2004
-
2003
-
Devonshire House
N/A
Median Price
Past 12 months
Past 12 months
2025
-
2024
-
2023
-
2022
-
2021
-
2020
-
2019
-
2018
-
2017
-
2016
-
2015
-
2014
-
2013
-
2012
-
2011
-
2010
-
2009
-
2008
-
2007
-
2006
-
2005
-
2004
-
2003
-
The Greenwich Lane
N/A
Avg. Price / ft2
Past 12 months
Past 12 months
-
-
-
-
-
-
$3,478
-
$3,312
$5,083
$4,123
-
-
-
-
-
-
-
-
-
-
-
-
The Greenwich Lane
N/A
Avg. Price
Past 12 months
Past 12 months
-
-
-
-
-
-
$15,750,000
-
$16,107,750
$25,044,283
$17,017,279
-
-
-
-
-
-
-
-
-
-
-
-
The Greenwich Lane
N/A
Median Price / ft2
Past 12 months
Past 12 months
-
-
-
-
-
-
$3,478
-
$3,293
$5,083
$4,069
-
-
-
-
-
-
-
-
-
-
-
-
The Greenwich Lane
N/A
Median Price
Past 12 months
Past 12 months
-
-
-
-
-
-
$15,750,000
-
$16,323,426
$25,044,283
$18,459,296
-
-
-
-
-
-
-
-
-
-
-
-
The Greenwich Lane
N/A
Avg. Price / ft2
Past 12 months
Past 12 months
-
-
-
-
-
-
-
-
-
-
$3,522
-
-
-
-
-
-
-
-
-
-
-
-
The Greenwich Lane
N/A
Avg. Price
Past 12 months
Past 12 months
-
-
-
-
-
-
-
-
-
-
$3,846,408
-
-
-
-
-
-
-
-
-
-
-
-
The Greenwich Lane
N/A
Median Price / ft2
Past 12 months
Past 12 months
-
-
-
-
-
-
-
-
-
-
$3,522
-
-
-
-
-
-
-
-
-
-
-
-
The Greenwich Lane
N/A
Median Price
Past 12 months
Past 12 months
-
-
-
-
-
-
-
-
-
-
$3,846,408
-
-
-
-
-
-
-
-
-
-
-
-
The Greenwich Lane
N/A
Avg. Price / ft2
Past 12 months
Past 12 months
-
-
-
-
-
-
-
-
-
-
-
-
-
-
-
-
-
-
-
-
-
-
-
The Greenwich Lane
N/A
Avg. Price
Past 12 months
Past 12 months
-
-
-
-
-
-
-
-
-
-
-
-
-
-
-
-
-
-
-
-
-
-
-
The Greenwich Lane
N/A
Median Price / ft2
Past 12 months
Past 12 months
-
-
-
-
-
-
-
-
-
-
-
-
-
-
-
-
-
-
-
-
-
-
-
The Greenwich Lane
N/A
Median Price
Past 12 months
Past 12 months
-
-
-
-
-
-
-
-
-
-
-
-
-
-
-
-
-
-
-
-
-
-
-
The Greenwich Lane
N/A
Avg. Price / ft2
Past 12 months
Past 12 months
-
-
-
-
-
-
-
-
-
$5,083
$5,174
-
-
-
-
-
-
-
-
-
-
-
-
The Greenwich Lane
N/A
Avg. Price
Past 12 months
Past 12 months
-
-
-
-
-
-
-
-
-
$25,044,283
$25,489,850
-
-
-
-
-
-
-
-
-
-
-
-
The Greenwich Lane
N/A
Median Price / ft2
Past 12 months
Past 12 months
-
-
-
-
-
-
-
-
-
$5,083
$5,174
-
-
-
-
-
-
-
-
-
-
-
-
The Greenwich Lane
N/A
Median Price
Past 12 months
Past 12 months
-
-
-
-
-
-
-
-
-
$25,044,283
$25,489,850
-
-
-
-
-
-
-
-
-
-
-
-
The Greenwich Lane
N/A
Avg. Price / ft2
Past 12 months
Past 12 months
-
-
-
-
-
-
$3,478
-
$3,312
-
$4,011
-
-
-
-
-
-
-
-
-
-
-
-
The Greenwich Lane
N/A
Avg. Price
Past 12 months
Past 12 months
-
-
-
-
-
-
$15,750,000
-
$16,107,750
-
$18,191,855
-
-
-
-
-
-
-
-
-
-
-
-
The Greenwich Lane
N/A
Median Price / ft2
Past 12 months
Past 12 months
-
-
-
-
-
-
$3,478
-
$3,293
-
$4,069
-
-
-
-
-
-
-
-
-
-
-
-
The Greenwich Lane
N/A
Median Price
Past 12 months
Past 12 months
-
-
-
-
-
-
$15,750,000
-
$16,323,426
-
$18,459,296
-
-
-
-
-
-
-
-
-
-
-
-
12 East 12th Street
N/A
Avg. Price / ft2
Past 12 months
Past 12 months
-
$2,328
$1,644
$1,583
-
-
$1,448
$1,853
-
$1,828
$1,816
$1,311
$1,600
$2,585
-
$860
$1,003
$1,143
$1,066
-
$1,092
$1,071
-
12 East 12th Street
N/A
Avg. Price
Past 12 months
Past 12 months
-
$4,237,500
$7,087,500
$2,750,000
-
-
$4,200,000
$3,250,000
-
$5,050,000
$4,995,000
$1,145,531
$1,400,000
$3,495,000
-
$1,500,000
$1,595,000
$999,000
$2,456,667
-
$4,950,000
$2,945,000
-
12 East 12th Street
N/A
Median Price / ft2
Past 12 months
Past 12 months
-
$2,328
$1,644
$1,583
-
-
$1,448
$1,853
-
$1,828
$1,816
$1,311
$1,600
$2,585
-
$860
$1,003
$1,143
$1,015
-
$1,092
$1,071
-
12 East 12th Street
N/A
Median Price
Past 12 months
Past 12 months
-
$4,237,500
$7,087,500
$2,750,000
-
-
$4,200,000
$3,250,000
-
$5,050,000
$4,995,000
$1,145,531
$1,400,000
$3,495,000
-
$1,500,000
$1,595,000
$999,000
$1,910,000
-
$4,950,000
$2,945,000
-
12 East 12th Street
N/A
Avg. Price / ft2
Past 12 months
Past 12 months
-
-
-
-
-
-
-
-
-
-
-
-
-
-
-
$805
-
-
-
-
-
-
-
12 East 12th Street
N/A
Avg. Price
Past 12 months
Past 12 months
-
-
-
-
-
-
-
-
-
-
-
-
-
-
-
$2,200,000
-
-
-
-
-
-
-
12 East 12th Street
N/A
Median Price / ft2
Past 12 months
Past 12 months
-
-
-
-
-
-
-
-
-
-
-
-
-
-
-
$805
-
-
-
-
-
-
-
12 East 12th Street
N/A
Median Price
Past 12 months
Past 12 months
-
-
-
-
-
-
-
-
-
-
-
-
-
-
-
$2,200,000
-
-
-
-
-
-
-
12 East 12th Street
N/A
Avg. Price / ft2
Past 12 months
Past 12 months
-
$1,532
-
-
-
-
-
-
-
-
-
$1,311
$1,600
-
-
$915
-
$1,143
-
-
-
-
-
12 East 12th Street
N/A
Avg. Price
Past 12 months
Past 12 months
-
$4,250,000
-
-
-
-
-
-
-
-
-
$1,145,531
$1,400,000
-
-
$800,000
-
$999,000
-
-
-
-
-
12 East 12th Street
N/A
Median Price / ft2
Past 12 months
Past 12 months
-
$1,532
-
-
-
-
-
-
-
-
-
$1,311
$1,600
-
-
$915
-
$1,143
-
-
-
-
-
12 East 12th Street
N/A
Median Price
Past 12 months
Past 12 months
-
$4,250,000
-
-
-
-
-
-
-
-
-
$1,145,531
$1,400,000
-
-
$800,000
-
$999,000
-
-
-
-
-
12 East 12th Street
N/A
Avg. Price / ft2
Past 12 months
Past 12 months
-
$3,125
$1,709
$1,583
-
-
$1,448
$1,853
-
$1,828
$1,816
-
-
$2,585
-
-
$1,003
-
$1,092
-
-
$1,071
-
12 East 12th Street
N/A
Avg. Price
Past 12 months
Past 12 months
-
$4,225,000
$4,700,000
$2,750,000
-
-
$4,200,000
$3,250,000
-
$5,050,000
$4,995,000
-
-
$3,495,000
-
-
$1,595,000
-
$1,385,000
-
-
$2,945,000
-
12 East 12th Street
N/A
Median Price / ft2
Past 12 months
Past 12 months
-
$3,125
$1,709
$1,583
-
-
$1,448
$1,853
-
$1,828
$1,816
-
-
$2,585
-
-
$1,003
-
$1,092
-
-
$1,071
-
12 East 12th Street
N/A
Median Price
Past 12 months
Past 12 months
-
$4,225,000
$4,700,000
$2,750,000
-
-
$4,200,000
$3,250,000
-
$5,050,000
$4,995,000
-
-
$3,495,000
-
-
$1,595,000
-
$1,385,000
-
-
$2,945,000
-
12 East 12th Street
N/A
Avg. Price / ft2
Past 12 months
Past 12 months
-
-
-
-
-
-
-
-
-
-
-
-
-
-
-
-
-
-
$1,015
-
$1,092
-
-
12 East 12th Street
N/A
Avg. Price
Past 12 months
Past 12 months
-
-
-
-
-
-
-
-
-
-
-
-
-
-
-
-
-
-
$4,600,000
-
$4,950,000
-
-
12 East 12th Street
N/A
Median Price / ft2
Past 12 months
Past 12 months
-
-
-
-
-
-
-
-
-
-
-
-
-
-
-
-
-
-
$1,015
-
$1,092
-
-
12 East 12th Street
N/A
Median Price
Past 12 months
Past 12 months
-
-
-
-
-
-
-
-
-
-
-
-
-
-
-
-
-
-
$4,600,000
-
$4,950,000
-
-
12 East 12th Street
N/A
Avg. Price / ft2
Past 12 months
Past 12 months
-
-
-
-
-
-
-
-
-
-
-
-
-
-
-
-
-
-
-
-
-
-
-
12 East 12th Street
N/A
Avg. Price
Past 12 months
Past 12 months
-
-
-
-
-
-
-
-
-
-
-
-
-
-
-
-
-
-
-
-
-
-
-
12 East 12th Street
N/A
Median Price / ft2
Past 12 months
Past 12 months
-
-
-
-
-
-
-
-
-
-
-
-
-
-
-
-
-
-
-
-
-
-
-
12 East 12th Street
N/A
Median Price
Past 12 months
Past 12 months
-
-
-
-
-
-
-
-
-
-
-
-
-
-
-
-
-
-
-
-
-
-
-
12 East 12th Street
N/A
Avg. Price / ft2
Past 12 months
Past 12 months
-
-
$1,579
-
-
-
-
-
-
-
-
-
-
-
-
-
-
-
-
-
-
-
-
12 East 12th Street
N/A
Avg. Price
Past 12 months
Past 12 months
-
-
$9,475,000
-
-
-
-
-
-
-
-
-
-
-
-
-
-
-
-
-
-
-
-
12 East 12th Street
N/A
Median Price / ft2
Past 12 months
Past 12 months
-
-
$1,579
-
-
-
-
-
-
-
-
-
-
-
-
-
-
-
-
-
-
-
-
12 East 12th Street
N/A
Median Price
Past 12 months
Past 12 months
-
-
$9,475,000
-
-
-
-
-
-
-
-
-
-
-
-
-
-
-
-
-
-
-
-
29 East 10th Street
N/A
Avg. Price / ft2
Past 12 months
Past 12 months
-
-
-
-
-
-
$2,480
-
$2,356
-
$1,807
-
-
-
-
-
-
-
-
-
-
-
-
29 East 10th Street
N/A
Avg. Price
Past 12 months
Past 12 months
-
-
-
-
-
-
$9,999,999
-
$9,500,000
-
$3,250,000
-
-
-
-
-
-
-
-
-
-
-
-
29 East 10th Street
N/A
Median Price / ft2
Past 12 months
Past 12 months
-
-
-
-
-
-
$2,480
-
$2,356
-
$1,807
-
-
-
-
-
-
-
-
-
-
-
-
29 East 10th Street
N/A
Median Price
Past 12 months
Past 12 months
-
-
-
-
-
-
$9,999,999
-
$9,500,000
-
$3,250,000
-
-
-
-
-
-
-
-
-
-
-
-
29 East 10th Street
N/A
Avg. Price / ft2
Past 12 months
Past 12 months
-
-
-
-
-
-
-
-
-
-
-
-
-
-
-
-
-
-
-
-
-
-
-
29 East 10th Street
N/A
Avg. Price
Past 12 months
Past 12 months
-
-
-
-
-
-
-
-
-
-
-
-
-
-
-
-
-
-
-
-
-
-
-
29 East 10th Street
N/A
Median Price / ft2
Past 12 months
Past 12 months
-
-
-
-
-
-
-
-
-
-
-
-
-
-
-
-
-
-
-
-
-
-
-
29 East 10th Street
N/A
Median Price
Past 12 months
Past 12 months
-
-
-
-
-
-
-
-
-
-
-
-
-
-
-
-
-
-
-
-
-
-
-
29 East 10th Street
N/A
Avg. Price / ft2
Past 12 months
Past 12 months
-
-
-
-
-
-
-
-
-
-
$1,807
-
-
-
-
-
-
-
-
-
-
-
-
29 East 10th Street
N/A
Avg. Price
Past 12 months
Past 12 months
-
-
-
-
-
-
-
-
-
-
$3,250,000
-
-
-
-
-
-
-
-
-
-
-
-
29 East 10th Street
N/A
Median Price / ft2
Past 12 months
Past 12 months
-
-
-
-
-
-
-
-
-
-
$1,807
-
-
-
-
-
-
-
-
-
-
-
-
29 East 10th Street
N/A
Median Price
Past 12 months
Past 12 months
-
-
-
-
-
-
-
-
-
-
$3,250,000
-
-
-
-
-
-
-
-
-
-
-
-
29 East 10th Street
N/A
Avg. Price / ft2
Past 12 months
Past 12 months
-
-
-
-
-
-
-
-
-
-
-
-
-
-
-
-
-
-
-
-
-
-
-
29 East 10th Street
N/A
Avg. Price
Past 12 months
Past 12 months
-
-
-
-
-
-
-
-
-
-
-
-
-
-
-
-
-
-
-
-
-
-
-
29 East 10th Street
N/A
Median Price / ft2
Past 12 months
Past 12 months
-
-
-
-
-
-
-
-
-
-
-
-
-
-
-
-
-
-
-
-
-
-
-
29 East 10th Street
N/A
Median Price
Past 12 months
Past 12 months
-
-
-
-
-
-
-
-
-
-
-
-
-
-
-
-
-
-
-
-
-
-
-
29 East 10th Street
N/A
Avg. Price / ft2
Past 12 months
Past 12 months
-
-
-
-
-
-
$2,480
-
$2,356
-
-
-
-
-
-
-
-
-
-
-
-
-
-
29 East 10th Street
N/A
Avg. Price
Past 12 months
Past 12 months
-
-
-
-
-
-
$9,999,999
-
$9,500,000
-
-
-
-
-
-
-
-
-
-
-
-
-
-
29 East 10th Street
N/A
Median Price / ft2
Past 12 months
Past 12 months
-
-
-
-
-
-
$2,480
-
$2,356
-
-
-
-
-
-
-
-
-
-
-
-
-
-
29 East 10th Street
N/A
Median Price
Past 12 months
Past 12 months
-
-
-
-
-
-
$9,999,999
-
$9,500,000
-
-
-
-
-
-
-
-
-
-
-
-
-
-
Delos Residences
N/A
Avg. Price / ft2
Past 12 months
Past 12 months
-
-
-
-
-
$1,838
-
-
-
$2,599
-
$1,545
-
-
-
-
-
-
-
-
-
-
-
Delos Residences
N/A
Avg. Price
Past 12 months
Past 12 months
-
-
-
-
-
$14,000,000
-
-
-
$14,040,719
-
$5,660,000
-
-
-
-
-
-
-
-
-
-
-
Delos Residences
N/A
Median Price / ft2
Past 12 months
Past 12 months
-
-
-
-
-
$1,838
-
-
-
$2,184
-
$1,545
-
-
-
-
-
-
-
-
-
-
-
Delos Residences
N/A
Median Price
Past 12 months
Past 12 months
-
-
-
-
-
$14,000,000
-
-
-
$8,000,000
-
$5,660,000
-
-
-
-
-
-
-
-
-
-
-
Delos Residences
N/A
Avg. Price / ft2
Past 12 months
Past 12 months
-
-
-
-
-
-
-
-
-
-
-
-
-
-
-
-
-
-
-
-
-
-
-
Delos Residences
N/A
Avg. Price
Past 12 months
Past 12 months
-
-
-
-
-
-
-
-
-
-
-
-
-
-
-
-
-
-
-
-
-
-
-
Delos Residences
N/A
Median Price / ft2
Past 12 months
Past 12 months
-
-
-
-
-
-
-
-
-
-
-
-
-
-
-
-
-
-
-
-
-
-
-
Delos Residences
N/A
Median Price
Past 12 months
Past 12 months
-
-
-
-
-
-
-
-
-
-
-
-
-
-
-
-
-
-
-
-
-
-
-
Delos Residences
N/A
Avg. Price / ft2
Past 12 months
Past 12 months
-
-
-
-
-
-
-
-
-
$2,184
-
$1,545
-
-
-
-
-
-
-
-
-
-
-
Delos Residences
N/A
Avg. Price
Past 12 months
Past 12 months
-
-
-
-
-
-
-
-
-
$8,000,000
-
$5,660,000
-
-
-
-
-
-
-
-
-
-
-
Delos Residences
N/A
Median Price / ft2
Past 12 months
Past 12 months
-
-
-
-
-
-
-
-
-
$2,184
-
$1,545
-
-
-
-
-
-
-
-
-
-
-
Delos Residences
N/A
Median Price
Past 12 months
Past 12 months
-
-
-
-
-
-
-
-
-
$8,000,000
-
$5,660,000
-
-
-
-
-
-
-
-
-
-
-
Delos Residences
N/A
Avg. Price / ft2
Past 12 months
Past 12 months
-
-
-
-
-
$1,838
-
-
-
$3,429
-
-
-
-
-
-
-
-
-
-
-
-
-
Delos Residences
N/A
Avg. Price
Past 12 months
Past 12 months
-
-
-
-
-
$14,000,000
-
-
-
$26,122,156
-
-
-
-
-
-
-
-
-
-
-
-
-
Delos Residences
N/A
Median Price / ft2
Past 12 months
Past 12 months
-
-
-
-
-
$1,838
-
-
-
$3,429
-
-
-
-
-
-
-
-
-
-
-
-
-
Delos Residences
N/A
Median Price
Past 12 months
Past 12 months
-
-
-
-
-
$14,000,000
-
-
-
$26,122,156
-
-
-
-
-
-
-
-
-
-
-
-
-
Delos Residences
N/A
Avg. Price / ft2
Past 12 months
Past 12 months
-
-
-
-
-
-
-
-
-
-
-
-
-
-
-
-
-
-
-
-
-
-
-
Delos Residences
N/A
Avg. Price
Past 12 months
Past 12 months
-
-
-
-
-
-
-
-
-
-
-
-
-
-
-
-
-
-
-
-
-
-
-
Delos Residences
N/A
Median Price / ft2
Past 12 months
Past 12 months
-
-
-
-
-
-
-
-
-
-
-
-
-
-
-
-
-
-
-
-
-
-
-
Delos Residences
N/A
Median Price
Past 12 months
Past 12 months
-
-
-
-
-
-
-
-
-
-
-
-
-
-
-
-
-
-
-
-
-
-
-
31 West 11th Street
N/A
Avg. Price / ft2
Past 12 months
Past 12 months
-
$2,101
-
-
-
$2,556
-
$2,672
-
$2,692
-
$2,713
-
$2,201
-
$2,028
$1,170
$1,787
-
-
-
-
-
31 West 11th Street
N/A
Avg. Price
Past 12 months
Past 12 months
-
$4,587,500
$1,295,000
-
-
$4,995,000
-
$5,200,000
-
$4,025,000
-
$4,847,500
-
$3,925,000
-
$3,699,883
$3,462,050
$3,151,742
-
-
-
-
-
31 West 11th Street
N/A
Median Price / ft2
Past 12 months
Past 12 months
-
$2,101
-
-
-
$2,556
-
$2,672
-
$2,692
-
$2,713
-
$2,201
-
$1,928
$1,170
$1,939
-
-
-
-
-
31 West 11th Street
N/A
Median Price
Past 12 months
Past 12 months
-
$4,587,500
$1,295,000
-
-
$4,995,000
-
$5,200,000
-
$4,025,000
-
$4,847,500
-
$3,925,000
-
$3,767,525
$3,462,050
$3,049,658
-
-
-
-
-
31 West 11th Street
N/A
Avg. Price / ft2
Past 12 months
Past 12 months
-
-
-
-
-
-
-
-
-
-
-
-
-
-
-
-
-
-
-
-
-
-
-
31 West 11th Street
N/A
Avg. Price
Past 12 months
Past 12 months
-
-
-
-
-
-
-
-
-
-
-
-
-
-
-
-
-
-
-
-
-
-
-
31 West 11th Street
N/A
Median Price / ft2
Past 12 months
Past 12 months
-
-
-
-
-
-
-
-
-
-
-
-
-
-
-
-
-
-
-
-
-
-
-
31 West 11th Street
N/A
Median Price
Past 12 months
Past 12 months
-
-
-
-
-
-
-
-
-
-
-
-
-
-
-
-
-
-
-
-
-
-
-
31 West 11th Street
N/A
Avg. Price / ft2
Past 12 months
Past 12 months
-
-
-
-
-
-
-
-
-
$2,442
-
-
-
-
-
-
-
$643
-
-
-
-
-
31 West 11th Street
N/A
Avg. Price
Past 12 months
Past 12 months
-
-
$1,295,000
-
-
-
-
-
-
$2,300,000
-
-
-
-
-
-
-
$605,475
-
-
-
-
-
31 West 11th Street
N/A
Median Price / ft2
Past 12 months
Past 12 months
-
-
-
-
-
-
-
-
-
$2,442
-
-
-
-
-
-
-
$643
-
-
-
-
-
31 West 11th Street
N/A
Median Price
Past 12 months
Past 12 months
-
-
$1,295,000
-
-
-
-
-
-
$2,300,000
-
-
-
-
-
-
-
$605,475
-
-
-
-
-
31 West 11th Street
N/A
Avg. Price / ft2
Past 12 months
Past 12 months
-
$2,101
-
-
-
-
-
-
-
-
-
$2,384
-
$1,971
-
$1,748
$1,170
$1,873
-
-
-
-
-
31 West 11th Street
N/A
Avg. Price
Past 12 months
Past 12 months
-
$4,587,500
-
-
-
-
-
-
-
-
-
$3,750,000
-
$3,100,000
-
$2,750,000
$3,462,050
$2,946,985
-
-
-
-
-
31 West 11th Street
N/A
Median Price / ft2
Past 12 months
Past 12 months
-
$2,101
-
-
-
-
-
-
-
-
-
$2,384
-
$1,971
-
$1,748
$1,170
$1,876
-
-
-
-
-
31 West 11th Street
N/A
Median Price
Past 12 months
Past 12 months
-
$4,587,500
-
-
-
-
-
-
-
-
-
$3,750,000
-
$3,100,000
-
$2,750,000
$3,462,050
$2,950,379
-
-
-
-
-
31 West 11th Street
N/A
Avg. Price / ft2
Past 12 months
Past 12 months
-
-
-
-
-
$2,556
-
$2,672
-
$2,943
-
$3,042
-
$2,431
-
$2,167
-
$2,070
-
-
-
-
-
31 West 11th Street
N/A
Avg. Price
Past 12 months
Past 12 months
-
-
-
-
-
$4,995,000
-
$5,200,000
-
$5,750,000
-
$5,945,000
-
$4,750,000
-
$4,174,825
-
$4,042,452
-
-
-
-
-
31 West 11th Street
N/A
Median Price / ft2
Past 12 months
Past 12 months
-
-
-
-
-
$2,556
-
$2,672
-
$2,943
-
$3,042
-
$2,431
-
$2,167
-
$2,032
-
-
-
-
-
31 West 11th Street
N/A
Median Price
Past 12 months
Past 12 months
-
-
-
-
-
$4,995,000
-
$5,200,000
-
$5,750,000
-
$5,945,000
-
$4,750,000
-
$4,174,825
-
$3,971,175
-
-
-
-
-
31 West 11th Street
N/A
Avg. Price / ft2
Past 12 months
Past 12 months
-
-
-
-
-
-
-
-
-
-
-
-
-
-
-
-
-
$992
-
-
-
-
-
31 West 11th Street
N/A
Avg. Price
Past 12 months
Past 12 months
-
-
-
-
-
-
-
-
-
-
-
-
-
-
-
-
-
$2,473,000
-
-
-
-
-
31 West 11th Street
N/A
Median Price / ft2
Past 12 months
Past 12 months
-
-
-
-
-
-
-
-
-
-
-
-
-
-
-
-
-
$992
-
-
-
-
-
31 West 11th Street
N/A
Median Price
Past 12 months
Past 12 months
-
-
-
-
-
-
-
-
-
-
-
-
-
-
-
-
-
$2,473,000
-
-
-
-
-
31 West 11th Street
N/A
Avg. Price / ft2
Past 12 months
Past 12 months
-
-
-
-
-
-
-
-
-
-
-
-
-
-
-
-
-
-
-
-
-
-
-
31 West 11th Street
N/A
Avg. Price
Past 12 months
Past 12 months
-
-
-
-
-
-
-
-
-
-
-
-
-
-
-
-
-
-
-
-
-
-
-
31 West 11th Street
N/A
Median Price / ft2
Past 12 months
Past 12 months
-
-
-
-
-
-
-
-
-
-
-
-
-
-
-
-
-
-
-
-
-
-
-
31 West 11th Street
N/A
Median Price
Past 12 months
Past 12 months
-
-
-
-
-
-
-
-
-
-
-
-
-
-
-
-
-
-
-
-
-
-
-
9 West 10th Street
N/A
Avg. Price / ft2
Past 12 months
Past 12 months
-
-
-
$1,570
-
-
-
-
-
-
-
-
-
-
$1,277
-
-
-
-
-
$1,245
-
-
9 West 10th Street
N/A
Avg. Price
Past 12 months
Past 12 months
-
-
-
$664,000
-
-
-
-
-
-
-
-
-
-
$540,000
-
-
-
-
-
$1,697,500
-
-
9 West 10th Street
N/A
Median Price / ft2
Past 12 months
Past 12 months
-
-
-
$1,570
-
-
-
-
-
-
-
-
-
-
$1,277
-
-
-
-
-
$1,245
-
-
9 West 10th Street
N/A
Median Price
Past 12 months
Past 12 months
-
-
-
$664,000
-
-
-
-
-
-
-
-
-
-
$540,000
-
-
-
-
-
$1,697,500
-
-
9 West 10th Street
N/A
Avg. Price / ft2
Past 12 months
Past 12 months
-
-
-
$1,570
-
-
-
-
-
-
-
-
-
-
$1,277
-
-
-
-
-
$1,348
-
-
9 West 10th Street
N/A
Avg. Price
Past 12 months
Past 12 months
-
-
-
$664,000
-
-
-
-
-
-
-
-
-
-
$540,000
-
-
-
-
-
$570,000
-
-
9 West 10th Street
N/A
Median Price / ft2
Past 12 months
Past 12 months
-
-
-
$1,570
-
-
-
-
-
-
-
-
-
-
$1,277
-
-
-
-
-
$1,348
-
-
9 West 10th Street
N/A
Median Price
Past 12 months
Past 12 months
-
-
-
$664,000
-
-
-
-
-
-
-
-
-
-
$540,000
-
-
-
-
-
$570,000
-
-
9 West 10th Street
N/A
Avg. Price / ft2
Past 12 months
Past 12 months
-
-
-
-
-
-
-
-
-
-
-
-
-
-
-
-
-
-
-
-
-
-
-
9 West 10th Street
N/A
Avg. Price
Past 12 months
Past 12 months
-
-
-
-
-
-
-
-
-
-
-
-
-
-
-
-
-
-
-
-
-
-
-
9 West 10th Street
N/A
Median Price / ft2
Past 12 months
Past 12 months
-
-
-
-
-
-
-
-
-
-
-
-
-
-
-
-
-
-
-
-
-
-
-
9 West 10th Street
N/A
Median Price
Past 12 months
Past 12 months
-
-
-
-
-
-
-
-
-
-
-
-
-
-
-
-
-
-
-
-
-
-
-
9 West 10th Street
N/A
Avg. Price / ft2
Past 12 months
Past 12 months
-
-
-
-
-
-
-
-
-
-
-
-
-
-
-
-
-
-
-
-
$1,142
-
-
9 West 10th Street
N/A
Avg. Price
Past 12 months
Past 12 months
-
-
-
-
-
-
-
-
-
-
-
-
-
-
-
-
-
-
-
-
$2,825,000
-
-
9 West 10th Street
N/A
Median Price / ft2
Past 12 months
Past 12 months
-
-
-
-
-
-
-
-
-
-
-
-
-
-
-
-
-
-
-
-
$1,142
-
-
9 West 10th Street
N/A
Median Price
Past 12 months
Past 12 months
-
-
-
-
-
-
-
-
-
-
-
-
-
-
-
-
-
-
-
-
$2,825,000
-
-
9 West 10th Street
N/A
Avg. Price / ft2
Past 12 months
Past 12 months
-
-
-
-
-
-
-
-
-
-
-
-
-
-
-
-
-
-
-
-
-
-
-
9 West 10th Street
N/A
Avg. Price
Past 12 months
Past 12 months
-
-
-
-
-
-
-
-
-
-
-
-
-
-
-
-
-
-
-
-
-
-
-
9 West 10th Street
N/A
Median Price / ft2
Past 12 months
Past 12 months
-
-
-
-
-
-
-
-
-
-
-
-
-
-
-
-
-
-
-
-
-
-
-
9 West 10th Street
N/A
Median Price
Past 12 months
Past 12 months
-
-
-
-
-
-
-
-
-
-
-
-
-
-
-
-
-
-
-
-
-
-
-
The Greenwich Lane
$4,144
Avg. Price / ft2
Past 12 months
Past 12 months
$4,190
$4,789
-
$4,518
$3,530
$3,708
$3,518
$3,279
$3,960
$3,279
-
-
-
-
-
-
-
-
-
-
-
-
-
The Greenwich Lane
$8,050,000
Avg. Price
Past 12 months
Past 12 months
$9,945,417
$14,630,000
-
$12,641,188
$7,228,571
$11,600,000
$9,981,543
$8,584,496
$9,976,725
$7,267,002
-
-
-
-
-
-
-
-
-
-
-
-
-
The Greenwich Lane
$4,224
Median Price / ft2
Past 12 months
Past 12 months
$4,370
$4,894
-
$4,167
$3,378
$3,817
$3,518
$3,191
$3,744
$3,085
-
-
-
-
-
-
-
-
-
-
-
-
-
The Greenwich Lane
$6,400,000
Median Price
Past 12 months
Past 12 months
$8,950,000
$14,360,000
-
$9,992,250
$6,600,000
$11,550,000
$9,981,543
$8,125,000
$7,324,890
$5,660,050
-
-
-
-
-
-
-
-
-
-
-
-
-
The Greenwich Lane
N/A
Avg. Price / ft2
Past 12 months
Past 12 months
-
-
-
-
-
-
$2,294
$3,191
$2,573
$2,572
-
-
-
-
-
-
-
-
-
-
-
-
-
The Greenwich Lane
N/A
Avg. Price
Past 12 months
Past 12 months
-
-
-
-
-
-
$1,163,086
$1,617,819
$1,372,854
$1,607,619
-
-
-
-
-
-
-
-
-
-
-
-
-
The Greenwich Lane
N/A
Median Price / ft2
Past 12 months
Past 12 months
-
-
-
-
-
-
$2,294
$3,191
$2,573
$2,572
-
-
-
-
-
-
-
-
-
-
-
-
-
The Greenwich Lane
N/A
Median Price
Past 12 months
Past 12 months
-
-
-
-
-
-
$1,163,086
$1,617,819
$1,372,854
$1,607,619
-
-
-
-
-
-
-
-
-
-
-
-
-
The Greenwich Lane
$3,104
Avg. Price / ft2
Past 12 months
Past 12 months
$3,104
-
-
-
-
-
-
$2,653
$2,927
$2,752
-
-
-
-
-
-
-
-
-
-
-
-
-
The Greenwich Lane
$3,200,000
Avg. Price
Past 12 months
Past 12 months
$3,200,000
-
-
-
-
-
-
$3,200,000
$3,529,671
$2,788,182
-
-
-
-
-
-
-
-
-
-
-
-
-
The Greenwich Lane
$3,104
Median Price / ft2
Past 12 months
Past 12 months
$3,104
-
-
-
-
-
-
$2,653
$2,927
$2,735
-
-
-
-
-
-
-
-
-
-
-
-
-
The Greenwich Lane
$3,200,000
Median Price
Past 12 months
Past 12 months
$3,200,000
-
-
-
-
-
-
$3,200,000
$3,529,671
$2,857,571
-
-
-
-
-
-
-
-
-
-
-
-
-
The Greenwich Lane
$4,224
Avg. Price / ft2
Past 12 months
Past 12 months
$4,224
$3,788
-
$3,837
$3,711
-
-
-
$4,036
$3,256
-
-
-
-
-
-
-
-
-
-
-
-
-
The Greenwich Lane
$6,400,000
Avg. Price
Past 12 months
Past 12 months
$6,400,000
$6,347,500
-
$7,572,500
$6,850,000
-
-
-
$7,399,282
$5,688,398
-
-
-
-
-
-
-
-
-
-
-
-
-
The Greenwich Lane
$4,224
Median Price / ft2
Past 12 months
Past 12 months
$4,224
$3,788
-
$3,837
$3,795
-
-
-
$3,971
$3,277
-
-
-
-
-
-
-
-
-
-
-
-
-
The Greenwich Lane
$6,400,000
Median Price
Past 12 months
Past 12 months
$6,400,000
$6,347,500
-
$7,572,500
$5,750,000
-
-
-
$6,498,686
$5,460,996
-
-
-
-
-
-
-
-
-
-
-
-
-
The Greenwich Lane
$4,515
Avg. Price / ft2
Past 12 months
Past 12 months
$4,515
$5,631
-
$4,467
$3,378
$3,214
$4,741
$4,534
$3,622
$3,833
-
-
-
-
-
-
-
-
-
-
-
-
-
The Greenwich Lane
$11,500,000
Avg. Price
Past 12 months
Past 12 months
$11,500,000
$22,325,000
-
$11,021,125
$8,100,000
$7,050,000
$18,800,000
$15,806,474
$8,662,425
$11,560,926
-
-
-
-
-
-
-
-
-
-
-
-
-
The Greenwich Lane
$4,515
Median Price / ft2
Past 12 months
Past 12 months
$4,515
$5,631
-
$4,167
$3,378
$3,214
$4,741
$4,534
$3,542
$3,275
-
-
-
-
-
-
-
-
-
-
-
-
-
The Greenwich Lane
$11,500,000
Median Price
Past 12 months
Past 12 months
$11,500,000
$22,325,000
-
$9,992,250
$8,100,000
$7,050,000
$18,800,000
$15,806,474
$8,492,712
$7,805,146
-
-
-
-
-
-
-
-
-
-
-
-
-
The Greenwich Lane
$4,906
Avg. Price / ft2
Past 12 months
Past 12 months
$5,096
$5,948
-
$5,302
$2,775
$4,126
-
$3,844
$5,248
$3,537
-
-
-
-
-
-
-
-
-
-
-
-
-
The Greenwich Lane
$15,950,000
Avg. Price
Past 12 months
Past 12 months
$17,686,250
$23,500,000
-
$20,950,000
$8,250,000
$16,300,000
-
$14,173,186
$23,661,122
$12,604,791
-
-
-
-
-
-
-
-
-
-
-
-
-
The Greenwich Lane
$4,906
Median Price / ft2
Past 12 months
Past 12 months
$5,096
$5,948
-
$5,302
$2,775
$4,126
-
$3,844
$4,750
$3,681
-
-
-
-
-
-
-
-
-
-
-
-
-
The Greenwich Lane
$15,950,000
Median Price
Past 12 months
Past 12 months
$17,686,250
$23,500,000
-
$20,950,000
$8,250,000
$16,300,000
-
$14,173,186
$18,762,033
$13,522,992
-
-
-
-
-
-
-
-
-
-
-
-
-
The Greenwich Lane
N/A
Avg. Price / ft2
Past 12 months
Past 12 months
-
-
-
-
-
$4,278
-
$2,172
-
$3,736
-
-
-
-
-
-
-
-
-
-
-
-
-
The Greenwich Lane
N/A
Avg. Price
Past 12 months
Past 12 months
-
-
-
-
-
$16,000,000
-
$8,125,000
-
$13,821,243
-
-
-
-
-
-
-
-
-
-
-
-
-
The Greenwich Lane
N/A
Median Price / ft2
Past 12 months
Past 12 months
-
-
-
-
-
$4,278
-
$2,172
-
$3,736
-
-
-
-
-
-
-
-
-
-
-
-
-
The Greenwich Lane
N/A
Median Price
Past 12 months
Past 12 months
-
-
-
-
-
$16,000,000
-
$8,125,000
-
$13,821,243
-
-
-
-
-
-
-
-
-
-
-
-
-
The Waverly Building
$4,082
Avg. Price / ft2
Past 12 months
Past 12 months
-
-
$2,653
$2,570
$1,952
-
-
$2,721
$2,892
$2,410
$2,762
$2,662
$2,381
$2,516
$2,010
$1,912
$1,031
$1,507
-
-
-
-
-
The Waverly Building
$16,225,000
Avg. Price
Past 12 months
Past 12 months
-
-
$5,100,000
$3,750,000
$2,992,500
-
-
$6,950,000
$9,800,000
$3,495,000
$9,650,000
$5,100,000
$3,352,500
$6,512,500
$6,800,000
$4,967,250
$1,258,725
$3,298,477
-
-
-
-
-
The Waverly Building
$4,082
Median Price / ft2
Past 12 months
Past 12 months
-
-
$2,653
$2,570
$2,257
-
-
$2,721
$2,892
$2,410
$2,762
$2,662
$2,381
$2,176
$2,010
$1,716
$1,031
$1,404
-
-
-
-
-
The Waverly Building
$16,225,000
Median Price
Past 12 months
Past 12 months
-
-
$5,100,000
$3,750,000
$3,415,000
-
-
$6,950,000
$9,800,000
$3,495,000
$9,650,000
$5,100,000
$3,352,500
$4,050,000
$6,800,000
$3,237,500
$1,258,725
$2,647,450
-
-
-
-
-
The Waverly Building
N/A
Avg. Price / ft2
Past 12 months
Past 12 months
-
-
-
-
-
-
-
-
-
-
-
-
-
-
-
-
-
-
-
-
-
-
-
The Waverly Building
N/A
Avg. Price
Past 12 months
Past 12 months
-
-
-
-
-
-
-
-
-
-
-
-
-
-
-
-
-
-
-
-
-
-
-
The Waverly Building
N/A
Median Price / ft2
Past 12 months
Past 12 months
-
-
-
-
-
-
-
-
-
-
-
-
-
-
-
-
-
-
-
-
-
-
-
The Waverly Building
N/A
Median Price
Past 12 months
Past 12 months
-
-
-
-
-
-
-
-
-
-
-
-
-
-
-
-
-
-
-
-
-
-
-
The Waverly Building
N/A
Avg. Price / ft2
Past 12 months
Past 12 months
-
-
-
-
$862
-
-
-
-
-
-
-
-
-
-
-
$1,015
$935
-
-
-
-
-
The Waverly Building
N/A
Avg. Price
Past 12 months
Past 12 months
-
-
-
-
$840,000
-
-
-
-
-
-
-
-
-
-
-
$990,000
$911,333
-
-
-
-
-
The Waverly Building
N/A
Median Price / ft2
Past 12 months
Past 12 months
-
-
-
-
$862
-
-
-
-
-
-
-
-
-
-
-
$1,015
$935
-
-
-
-
-
The Waverly Building
N/A
Median Price
Past 12 months
Past 12 months
-
-
-
-
$840,000
-
-
-
-
-
-
-
-
-
-
-
$990,000
$911,333
-
-
-
-
-
The Waverly Building
N/A
Avg. Price / ft2
Past 12 months
Past 12 months
-
-
$2,653
$2,570
$2,316
-
-
$2,330
-
$2,410
-
$2,662
$2,381
$2,110
-
$1,715
$1,047
$1,451
-
-
-
-
-
The Waverly Building
N/A
Avg. Price
Past 12 months
Past 12 months
-
-
$5,100,000
$3,750,000
$3,710,000
-
-
$3,400,000
-
$3,495,000
-
$5,100,000
$3,352,500
$3,733,333
-
$2,868,750
$1,527,450
$2,377,058
-
-
-
-
-
The Waverly Building
N/A
Median Price / ft2
Past 12 months
Past 12 months
-
-
$2,653
$2,570
$2,276
-
-
$2,330
-
$2,410
-
$2,662
$2,381
$2,116
-
$1,715
$1,047
$1,396
-
-
-
-
-
The Waverly Building
N/A
Median Price
Past 12 months
Past 12 months
-
-
$5,100,000
$3,750,000
$3,530,000
-
-
$3,400,000
-
$3,495,000
-
$5,100,000
$3,352,500
$3,800,000
-
$2,868,750
$1,527,450
$2,508,812
-
-
-
-
-
The Waverly Building
N/A
Avg. Price / ft2
Past 12 months
Past 12 months
-
-
-
-
-
-
-
$3,111
$2,892
-
$2,762
-
-
-
$2,010
-
-
$1,703
-
-
-
-
-
The Waverly Building
N/A
Avg. Price
Past 12 months
Past 12 months
-
-
-
-
-
-
-
$10,500,000
$9,800,000
-
$9,650,000
-
-
-
$6,800,000
-
-
$5,820,995
-
-
-
-
-
The Waverly Building
N/A
Median Price / ft2
Past 12 months
Past 12 months
-
-
-
-
-
-
-
$3,111
$2,892
-
$2,762
-
-
-
$2,010
-
-
$1,705
-
-
-
-
-
The Waverly Building
N/A
Median Price
Past 12 months
Past 12 months
-
-
-
-
-
-
-
$10,500,000
$9,800,000
-
$9,650,000
-
-
-
$6,800,000
-
-
$5,753,112
-
-
-
-
-
The Waverly Building
$4,082
Avg. Price / ft2
Past 12 months
Past 12 months
-
-
-
-
-
-
-
-
-
-
-
-
-
$3,736
-
$2,305
-
$1,837
-
-
-
-
-
The Waverly Building
$16,225,000
Avg. Price
Past 12 months
Past 12 months
-
-
-
-
-
-
-
-
-
-
-
-
-
$14,850,000
-
$9,164,250
-
$6,236,781
-
-
-
-
-
The Waverly Building
$4,082
Median Price / ft2
Past 12 months
Past 12 months
-
-
-
-
-
-
-
-
-
-
-
-
-
$3,736
-
$2,305
-
$1,837
-
-
-
-
-
The Waverly Building
$16,225,000
Median Price
Past 12 months
Past 12 months
-
-
-
-
-
-
-
-
-
-
-
-
-
$14,850,000
-
$9,164,250
-
$6,236,781
-
-
-
-
-
The Waverly Building
N/A
Avg. Price / ft2
Past 12 months
Past 12 months
-
-
-
-
-
-
-
-
-
-
-
-
-
-
-
-
-
-
-
-
-
-
-
The Waverly Building
N/A
Avg. Price
Past 12 months
Past 12 months
-
-
-
-
-
-
-
-
-
-
-
-
-
-
-
-
-
-
-
-
-
-
-
The Waverly Building
N/A
Median Price / ft2
Past 12 months
Past 12 months
-
-
-
-
-
-
-
-
-
-
-
-
-
-
-
-
-
-
-
-
-
-
-
The Waverly Building
N/A
Median Price
Past 12 months
Past 12 months
-
-
-
-
-
-
-
-
-
-
-
-
-
-
-
-
-
-
-
-
-
-
-
The Greenwich Lane
$3,910
Avg. Price / ft2
Past 12 months
Past 12 months
$3,730
$3,151
$3,268
$3,388
$2,943
$3,033
$2,846
$2,960
$3,792
$2,883
$2,381
-
-
-
-
-
-
-
-
-
-
-
-
The Greenwich Lane
$9,016,167
Avg. Price
Past 12 months
Past 12 months
$9,972,500
$4,995,000
$4,840,000
$7,786,250
$6,081,563
$7,961,250
$5,400,000
$6,950,000
$11,506,131
$6,022,522
$3,064,933
-
-
-
-
-
-
-
-
-
-
-
-
The Greenwich Lane
$3,541
Median Price / ft2
Past 12 months
Past 12 months
$3,730
$3,151
$3,382
$3,115
$2,681
$3,089
$2,846
$2,934
$3,245
$2,772
$2,381
-
-
-
-
-
-
-
-
-
-
-
-
The Greenwich Lane
$7,950,000
Median Price
Past 12 months
Past 12 months
$9,972,500
$4,995,000
$4,995,000
$6,747,500
$6,420,000
$8,222,500
$5,400,000
$7,450,000
$8,758,750
$4,537,154
$3,064,933
-
-
-
-
-
-
-
-
-
-
-
-
The Greenwich Lane
N/A
Avg. Price / ft2
Past 12 months
Past 12 months
-
-
-
-
-
-
-
-
-
-
-
-
-
-
-
-
-
-
-
-
-
-
-
The Greenwich Lane
N/A
Avg. Price
Past 12 months
Past 12 months
-
-
-
-
-
-
-
-
-
-
-
-
-
-
-
-
-
-
-
-
-
-
-
The Greenwich Lane
N/A
Median Price / ft2
Past 12 months
Past 12 months
-
-
-
-
-
-
-
-
-
-
-
-
-
-
-
-
-
-
-
-
-
-
-
The Greenwich Lane
N/A
Median Price
Past 12 months
Past 12 months
-
-
-
-
-
-
-
-
-
-
-
-
-
-
-
-
-
-
-
-
-
-
-
The Greenwich Lane
$3,541
Avg. Price / ft2
Past 12 months
Past 12 months
-
-
$3,382
$3,021
$3,333
-
$2,747
-
-
$2,666
-
-
-
-
-
-
-
-
-
-
-
-
-
The Greenwich Lane
$4,100,000
Avg. Price
Past 12 months
Past 12 months
-
-
$3,950,000
$2,697,500
$4,145,000
-
$2,500,000
-
-
$2,711,007
-
-
-
-
-
-
-
-
-
-
-
-
-
The Greenwich Lane
$3,541
Median Price / ft2
Past 12 months
Past 12 months
-
-
$3,382
$3,021
$3,333
-
$2,747
-
-
$2,577
-
-
-
-
-
-
-
-
-
-
-
-
-
The Greenwich Lane
$4,100,000
Median Price
Past 12 months
Past 12 months
-
-
$3,950,000
$2,697,500
$4,145,000
-
$2,500,000
-
-
$2,424,312
-
-
-
-
-
-
-
-
-
-
-
-
-
The Greenwich Lane
N/A
Avg. Price / ft2
Past 12 months
Past 12 months
-
$3,151
$3,211
$3,049
$2,519
$2,490
-
$2,887
-
$2,677
-
-
-
-
-
-
-
-
-
-
-
-
-
The Greenwich Lane
N/A
Avg. Price
Past 12 months
Past 12 months
-
$4,995,000
$5,285,000
$4,800,000
$4,200,000
$3,900,000
-
$5,900,000
-
$4,525,203
-
-
-
-
-
-
-
-
-
-
-
-
-
The Greenwich Lane
N/A
Median Price / ft2
Past 12 months
Past 12 months
-
$3,151
$3,211
$3,049
$2,519
$2,490
-
$2,887
-
$2,640
-
-
-
-
-
-
-
-
-
-
-
-
-
The Greenwich Lane
N/A
Median Price
Past 12 months
Past 12 months
-
$4,995,000
$5,285,000
$4,800,000
$4,200,000
$3,900,000
-
$5,900,000
-
$4,351,205
-
-
-
-
-
-
-
-
-
-
-
-
-
The Greenwich Lane
$4,206
Avg. Price / ft2
Past 12 months
Past 12 months
$3,730
-
-
$4,006
$3,077
$3,089
-
$2,996
$3,792
$3,071
$2,381
-
-
-
-
-
-
-
-
-
-
-
-
The Greenwich Lane
$11,474,250
Avg. Price
Past 12 months
Past 12 months
$9,972,500
-
-
$12,998,333
$8,204,167
$8,222,500
-
$7,475,000
$11,506,131
$8,387,940
$3,064,933
-
-
-
-
-
-
-
-
-
-
-
-
The Greenwich Lane
$4,206
Median Price / ft2
Past 12 months
Past 12 months
$3,730
-
-
$3,494
$2,979
$3,089
-
$2,996
$3,245
$2,980
$2,381
-
-
-
-
-
-
-
-
-
-
-
-
The Greenwich Lane
$11,474,250
Median Price
Past 12 months
Past 12 months
$9,972,500
-
-
$9,999,999
$7,562,500
$8,222,500
-
$7,475,000
$8,758,750
$7,500,147
$3,064,933
-
-
-
-
-
-
-
-
-
-
-
-
The Greenwich Lane
N/A
Avg. Price / ft2
Past 12 months
Past 12 months
-
-
-
$2,945
$2,608
$3,465
$2,945
-
-
$3,615
-
-
-
-
-
-
-
-
-
-
-
-
-
The Greenwich Lane
N/A
Avg. Price
Past 12 months
Past 12 months
-
-
-
$8,300,000
$7,350,000
$11,500,000
$8,300,000
-
-
$12,984,586
-
-
-
-
-
-
-
-
-
-
-
-
-
The Greenwich Lane
N/A
Median Price / ft2
Past 12 months
Past 12 months
-
-
-
$2,945
$2,608
$3,465
$2,945
-
-
$2,995
-
-
-
-
-
-
-
-
-
-
-
-
-
The Greenwich Lane
N/A
Median Price
Past 12 months
Past 12 months
-
-
-
$8,300,000
$7,350,000
$11,500,000
$8,300,000
-
-
$8,439,031
-
-
-
-
-
-
-
-
-
-
-
-
-
The Greenwich Lane
N/A
Avg. Price / ft2
Past 12 months
Past 12 months
-
-
-
-
-
-
-
-
-
-
-
-
-
-
-
-
-
-
-
-
-
-
-
The Greenwich Lane
N/A
Avg. Price
Past 12 months
Past 12 months
-
-
-
-
-
-
-
-
-
-
-
-
-
-
-
-
-
-
-
-
-
-
-
The Greenwich Lane
N/A
Median Price / ft2
Past 12 months
Past 12 months
-
-
-
-
-
-
-
-
-
-
-
-
-
-
-
-
-
-
-
-
-
-
-
The Greenwich Lane
N/A
Median Price
Past 12 months
Past 12 months
-
-
-
-
-
-
-
-
-
-
-
-
-
-
-
-
-
-
-
-
-
-
-
The Greenwich Lane
$3,630
Avg. Price / ft2
Past 12 months
Past 12 months
$4,156
$5,786
$3,358
$2,679
$3,682
$2,591
-
-
$3,819
$2,896
$3,471
-
-
-
-
-
-
-
-
-
-
-
-
The Greenwich Lane
$6,000,000
Avg. Price
Past 12 months
Past 12 months
$11,125,000
$26,250,000
$6,825,000
$2,875,000
$13,787,500
$8,000,000
-
-
$14,121,163
$7,784,453
$10,494,449
-
-
-
-
-
-
-
-
-
-
-
-
The Greenwich Lane
$3,630
Median Price / ft2
Past 12 months
Past 12 months
$4,156
$5,786
$3,358
$2,679
$3,682
$2,591
-
-
$3,893
$2,756
$2,896
-
-
-
-
-
-
-
-
-
-
-
-
The Greenwich Lane
$6,000,000
Median Price
Past 12 months
Past 12 months
$11,125,000
$26,250,000
$6,825,000
$2,875,000
$13,787,500
$8,000,000
-
-
$13,513,489
$6,532,138
$6,908,810
-
-
-
-
-
-
-
-
-
-
-
-
The Greenwich Lane
N/A
Avg. Price / ft2
Past 12 months
Past 12 months
-
-
-
-
-
-
-
-
-
-
-
-
-
-
-
-
-
-
-
-
-
-
-
The Greenwich Lane
N/A
Avg. Price
Past 12 months
Past 12 months
-
-
-
-
-
-
-
-
-
-
-
-
-
-
-
-
-
-
-
-
-
-
-
The Greenwich Lane
N/A
Median Price / ft2
Past 12 months
Past 12 months
-
-
-
-
-
-
-
-
-
-
-
-
-
-
-
-
-
-
-
-
-
-
-
The Greenwich Lane
N/A
Median Price
Past 12 months
Past 12 months
-
-
-
-
-
-
-
-
-
-
-
-
-
-
-
-
-
-
-
-
-
-
-
The Greenwich Lane
N/A
Avg. Price / ft2
Past 12 months
Past 12 months
-
-
-
$2,679
-
-
-
-
-
$2,464
-
-
-
-
-
-
-
-
-
-
-
-
-
The Greenwich Lane
N/A
Avg. Price
Past 12 months
Past 12 months
-
-
-
$2,875,000
-
-
-
-
-
$2,643,952
-
-
-
-
-
-
-
-
-
-
-
-
-
The Greenwich Lane
N/A
Median Price / ft2
Past 12 months
Past 12 months
-
-
-
$2,679
-
-
-
-
-
$2,464
-
-
-
-
-
-
-
-
-
-
-
-
-
The Greenwich Lane
N/A
Median Price
Past 12 months
Past 12 months
-
-
-
$2,875,000
-
-
-
-
-
$2,643,952
-
-
-
-
-
-
-
-
-
-
-
-
-
The Greenwich Lane
N/A
Avg. Price / ft2
Past 12 months
Past 12 months
-
-
$3,321
-
-
-
-
-
-
$2,559
$2,689
-
-
-
-
-
-
-
-
-
-
-
-
The Greenwich Lane
N/A
Avg. Price
Past 12 months
Past 12 months
-
-
$5,550,000
-
-
-
-
-
-
$5,159,019
$4,493,020
-
-
-
-
-
-
-
-
-
-
-
-
The Greenwich Lane
N/A
Median Price / ft2
Past 12 months
Past 12 months
-
-
$3,321
-
-
-
-
-
-
$2,559
$2,695
-
-
-
-
-
-
-
-
-
-
-
-
The Greenwich Lane
N/A
Median Price
Past 12 months
Past 12 months
-
-
$5,550,000
-
-
-
-
-
-
$5,159,019
$4,502,527
-
-
-
-
-
-
-
-
-
-
-
-
The Greenwich Lane
$3,630
Avg. Price / ft2
Past 12 months
Past 12 months
$4,156
$6,953
$3,395
-
$3,146
-
-
-
$3,893
$2,921
$3,794
-
-
-
-
-
-
-
-
-
-
-
-
The Greenwich Lane
$6,000,000
Avg. Price
Past 12 months
Past 12 months
$11,125,000
$28,000,000
$8,100,000
-
$5,200,000
-
-
-
$13,513,489
$6,320,806
$10,637,987
-
-
-
-
-
-
-
-
-
-
-
-
The Greenwich Lane
$3,630
Median Price / ft2
Past 12 months
Past 12 months
$4,156
$6,953
$3,395
-
$3,146
-
-
-
$3,893
$2,762
$2,920
-
-
-
-
-
-
-
-
-
-
-
-
The Greenwich Lane
$6,000,000
Median Price
Past 12 months
Past 12 months
$11,125,000
$28,000,000
$8,100,000
-
$5,200,000
-
-
-
$13,513,489
$6,465,837
$5,888,131
-
-
-
-
-
-
-
-
-
-
-
-
The Greenwich Lane
N/A
Avg. Price / ft2
Past 12 months
Past 12 months
-
-
-
-
-
$2,591
-
-
$3,782
$3,148
$3,649
-
-
-
-
-
-
-
-
-
-
-
-
The Greenwich Lane
N/A
Avg. Price
Past 12 months
Past 12 months
-
-
-
-
-
$8,000,000
-
-
$14,425,000
$11,845,942
$12,748,515
-
-
-
-
-
-
-
-
-
-
-
-
The Greenwich Lane
N/A
Median Price / ft2
Past 12 months
Past 12 months
-
-
-
-
-
$2,591
-
-
$3,782
$2,832
$2,988
-
-
-
-
-
-
-
-
-
-
-
-
The Greenwich Lane
N/A
Median Price
Past 12 months
Past 12 months
-
-
-
-
-
$8,000,000
-
-
$14,425,000
$9,865,123
$9,168,499
-
-
-
-
-
-
-
-
-
-
-
-
The Greenwich Lane
N/A
Avg. Price / ft2
Past 12 months
Past 12 months
-
$4,619
-
-
$4,219
-
-
-
-
-
$3,990
-
-
-
-
-
-
-
-
-
-
-
-
The Greenwich Lane
N/A
Avg. Price
Past 12 months
Past 12 months
-
$24,500,000
-
-
$22,375,000
-
-
-
-
-
$21,162,385
-
-
-
-
-
-
-
-
-
-
-
-
The Greenwich Lane
N/A
Median Price / ft2
Past 12 months
Past 12 months
-
$4,619
-
-
$4,219
-
-
-
-
-
$3,990
-
-
-
-
-
-
-
-
-
-
-
-
The Greenwich Lane
N/A
Median Price
Past 12 months
Past 12 months
-
$24,500,000
-
-
$22,375,000
-
-
-
-
-
$21,162,385
-
-
-
-
-
-
-
-
-
-
-
-