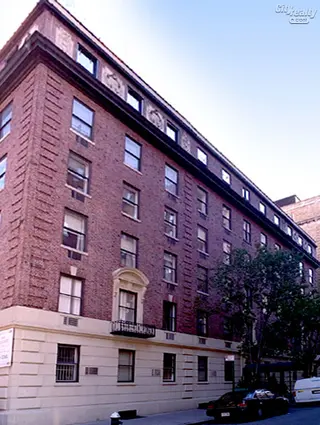
The Albert, 23 East 10th Street: Price Comparison
between University Place & Broadway Building Profile
The Albert
$1,064,688
Avg. Price
Past 12 months
Past 12 months
2024
$992,917
2023
$860,000
2022
$1,037,778
2021
$1,414,875
2020
$2,313,333
2019
$835,000
2018
$2,182,800
2017
$1,168,688
2016
$1,021,571
2015
$936,000
2014
$1,187,601
2013
$829,376
2012
$1,031,433
2011
$730,409
2010
$637,400
2009
$593,625
2008
$710,722
2007
$939,091
2006
$699,275
2005
$639,938
2004
$543,002
2003
$494,700
The Albert
$1,160,000
Median Price
Past 12 months
Past 12 months
2024
$937,500
2023
$867,500
2022
$935,000
2021
$1,237,500
2020
$1,100,000
2019
$835,000
2018
$1,850,000
2017
$1,024,500
2016
$965,750
2015
$850,000
2014
$1,020,000
2013
$715,000
2012
$705,000
2011
$665,000
2010
$625,000
2009
$587,000
2008
$730,000
2007
$757,000
2006
$667,500
2005
$650,000
2004
$465,500
2003
$410,000
The Albert
$612,500
Avg. Price
Past 12 months
Past 12 months
2024
$837,500
2023
$722,500
2022
$555,000
2021
-
2020
$590,000
2019
-
2018
-
2017
$545,500
2016
$678,783
2015
$566,667
2014
$625,000
2013
$458,000
2012
$435,000
2011
$509,667
2010
$475,000
2009
$412,500
2008
$425,000
2007
-
2006
$521,875
2005
$422,500
2004
$378,000
2003
$309,000
The Albert
$612,500
Median Price
Past 12 months
Past 12 months
2024
$837,500
2023
$727,500
2022
$565,000
2021
-
2020
$590,000
2019
-
2018
-
2017
$545,500
2016
$700,000
2015
$585,000
2014
$625,000
2013
$458,000
2012
$435,000
2011
$500,000
2010
$475,000
2009
$412,500
2008
$425,000
2007
-
2006
$493,750
2005
$422,500
2004
$355,000
2003
$309,000
The Albert
$1,060,000
Avg. Price
Past 12 months
Past 12 months
2024
$1,112,143
2023
$951,667
2022
$1,112,500
2021
$1,056,000
2020
$1,100,000
2019
$835,000
2018
$957,000
2017
$1,084,000
2016
$952,917
2015
$932,667
2014
$795,927
2013
$664,325
2012
$684,056
2011
$755,071
2010
$624,875
2009
$654,000
2008
$704,500
2007
$670,625
2006
$638,400
2005
$624,000
2004
$470,358
2003
$419,227
The Albert
$1,065,000
Median Price
Past 12 months
Past 12 months
2024
$1,100,000
2023
$900,000
2022
$1,005,000
2021
$987,000
2020
$1,100,000
2019
$835,000
2018
$957,000
2017
$1,024,500
2016
$965,750
2015
$900,000
2014
$786,854
2013
$687,500
2012
$650,000
2011
$790,000
2010
$625,000
2009
$637,000
2008
$730,000
2007
$655,000
2006
$655,000
2005
$645,000
2004
$451,000
2003
$400,000
The Albert
$1,215,000
Avg. Price
Past 12 months
Past 12 months
2024
$960,000
2023
-
2022
$1,612,500
2021
$1,773,750
2020
-
2019
-
2018
$1,850,000
2017
-
2016
$1,501,667
2015
$1,500,000
2014
$1,368,333
2013
$1,446,667
2012
$1,293,333
2011
$1,220,000
2010
$900,000
2009
-
2008
$1,012,000
2007
$927,500
2006
$919,000
2005
$843,333
2004
$699,972
2003
$740,000
The Albert
$1,215,000
Median Price
Past 12 months
Past 12 months
2024
$960,000
2023
-
2022
$1,612,500
2021
$1,825,000
2020
-
2019
-
2018
$1,850,000
2017
-
2016
$1,480,000
2015
$1,500,000
2014
$1,420,000
2013
$1,395,000
2012
$1,080,000
2011
$1,220,000
2010
$900,000
2009
-
2008
$1,012,000
2007
$927,500
2006
$824,500
2005
$910,000
2004
$682,944
2003
$740,000
The Albert
N/A
Avg. Price
Past 12 months
Past 12 months
2024
-
2023
-
2022
-
2021
-
2020
-
2019
-
2018
$2,850,000
2017
$2,300,000
2016
-
2015
-
2014
$2,700,000
2013
$1,310,000
2012
$1,800,000
2011
-
2010
-
2009
-
2008
-
2007
-
2006
-
2005
-
2004
$1,640,000
2003
$1,200,000
The Albert
N/A
Median Price
Past 12 months
Past 12 months
2024
-
2023
-
2022
-
2021
-
2020
-
2019
-
2018
$2,850,000
2017
$2,300,000
2016
-
2015
-
2014
$2,700,000
2013
$1,310,000
2012
$1,800,000
2011
-
2010
-
2009
-
2008
-
2007
-
2006
-
2005
-
2004
$1,640,000
2003
$1,200,000
The Albert
N/A
Avg. Price
Past 12 months
Past 12 months
2024
-
2023
-
2022
-
2021
-
2020
-
2019
-
2018
$4,300,000
2017
-
2016
-
2015
-
2014
-
2013
-
2012
$3,200,000
2011
-
2010
-
2009
-
2008
-
2007
-
2006
-
2005
-
2004
-
2003
-
The Albert
N/A
Median Price
Past 12 months
Past 12 months
2024
-
2023
-
2022
-
2021
-
2020
-
2019
-
2018
$4,300,000
2017
-
2016
-
2015
-
2014
-
2013
-
2012
$3,200,000
2011
-
2010
-
2009
-
2008
-
2007
-
2006
-
2005
-
2004
-
2003
-
The Albert
N/A
Avg. Price
Past 12 months
Past 12 months
2024
-
2023
-
2022
-
2021
-
2020
-
2019
-
2018
-
2017
-
2016
-
2015
-
2014
-
2013
-
2012
-
2011
-
2010
-
2009
-
2008
-
2007
$3,110,000
2006
-
2005
-
2004
-
2003
$560,000
The Albert
N/A
Median Price
Past 12 months
Past 12 months
2024
-
2023
-
2022
-
2021
-
2020
-
2019
-
2018
-
2017
-
2016
-
2015
-
2014
-
2013
-
2012
-
2011
-
2010
-
2009
-
2008
-
2007
$3,110,000
2006
-
2005
-
2004
-
2003
$560,000
40 Fifth Avenue
N/A
Avg. Price / ft2
Past 12 months
Past 12 months
-
-
-
-
-
-
-
-
-
-
-
$1,846
$1,167
$2,333
-
$1,317
-
$2,181
$1,769
-
$1,222
-
40 Fifth Avenue
$8,345,000
Avg. Price
Past 12 months
Past 12 months
$3,850,000
-
$3,500,000
$9,250,000
-
$2,942,500
$2,808,333
$5,025,000
-
$2,750,000
$2,375,000
$5,449,215
$2,950,000
$4,075,000
-
$6,991,667
$3,100,000
$2,792,000
$4,675,000
$1,450,000
$2,350,000
$2,375,000
40 Fifth Avenue
$3,595,000
Median Price
Past 12 months
Past 12 months
$3,850,000
-
$3,500,000
$9,250,000
-
$2,942,500
$2,875,000
$5,025,000
-
$2,750,000
$2,375,000
$3,214,003
$1,950,000
$4,200,000
-
$8,000,000
$3,100,000
$2,800,000
$4,675,000
$1,450,000
$1,925,000
$2,375,000
40 Fifth Avenue
N/A
Avg. Price / ft2
Past 12 months
Past 12 months
-
-
-
-
-
-
-
-
-
-
-
-
-
-
-
-
-
-
-
-
-
-
40 Fifth Avenue
N/A
Avg. Price
Past 12 months
Past 12 months
-
-
-
-
-
-
-
-
-
-
-
-
-
-
-
-
-
-
-
-
-
-
40 Fifth Avenue
N/A
Median Price
Past 12 months
Past 12 months
-
-
-
-
-
-
-
-
-
-
-
-
-
-
-
-
-
-
-
-
-
-
40 Fifth Avenue
N/A
Avg. Price / ft2
Past 12 months
Past 12 months
-
-
-
-
-
-
-
-
-
-
-
-
-
-
-
-
-
-
-
-
-
-
40 Fifth Avenue
N/A
Avg. Price
Past 12 months
Past 12 months
-
-
-
-
-
-
-
-
-
-
-
-
-
-
-
-
-
-
-
$1,300,000
-
-
40 Fifth Avenue
N/A
Median Price
Past 12 months
Past 12 months
-
-
-
-
-
-
-
-
-
-
-
-
-
-
-
-
-
-
-
$1,300,000
-
-
40 Fifth Avenue
N/A
Avg. Price / ft2
Past 12 months
Past 12 months
-
-
-
-
-
-
-
-
-
-
-
$1,846
-
-
-
-
-
-
$1,769
-
-
-
40 Fifth Avenue
$3,017,500
Avg. Price
Past 12 months
Past 12 months
-
-
$3,500,000
$4,000,000
-
$2,360,000
$2,808,333
$3,500,000
-
$2,750,000
$2,375,000
$2,834,751
$3,550,000
-
-
$8,000,000
$3,100,000
$2,161,667
$3,450,000
$1,600,000
$1,625,000
$2,400,000
40 Fifth Avenue
$3,017,500
Median Price
Past 12 months
Past 12 months
-
-
$3,500,000
$4,000,000
-
$2,360,000
$2,875,000
$3,500,000
-
$2,750,000
$2,375,000
$2,862,500
$3,550,000
-
-
$8,000,000
$3,100,000
$2,585,000
$3,450,000
$1,600,000
$1,625,000
$2,400,000
40 Fifth Avenue
N/A
Avg. Price / ft2
Past 12 months
Past 12 months
-
-
-
-
-
-
-
-
-
-
-
-
$1,167
$2,333
-
$1,317
-
$2,181
-
-
$1,222
-
40 Fifth Avenue
N/A
Avg. Price
Past 12 months
Past 12 months
$3,850,000
-
-
-
-
$3,525,000
-
$6,550,000
-
-
-
$3,400,000
$1,750,000
$4,075,000
-
$1,975,000
-
$3,737,500
-
-
$3,075,000
$2,350,000
40 Fifth Avenue
N/A
Median Price
Past 12 months
Past 12 months
$3,850,000
-
-
-
-
$3,525,000
-
$6,550,000
-
-
-
$3,400,000
$1,750,000
$4,200,000
-
$1,975,000
-
$3,737,500
-
-
$3,075,000
$2,350,000
40 Fifth Avenue
N/A
Avg. Price / ft2
Past 12 months
Past 12 months
-
-
-
-
-
-
-
-
-
-
-
-
-
-
-
-
-
-
-
-
-
-
40 Fifth Avenue
N/A
Avg. Price
Past 12 months
Past 12 months
-
-
-
-
-
-
-
-
-
-
-
$15,000,000
-
-
-
$11,000,000
-
-
-
-
-
-
40 Fifth Avenue
N/A
Median Price
Past 12 months
Past 12 months
-
-
-
-
-
-
-
-
-
-
-
$15,000,000
-
-
-
$11,000,000
-
-
-
-
-
-
40 Fifth Avenue
N/A
Avg. Price / ft2
Past 12 months
Past 12 months
-
-
-
-
-
-
-
-
-
-
-
-
-
-
-
-
-
-
-
-
-
-
40 Fifth Avenue
$19,000,000
Avg. Price
Past 12 months
Past 12 months
-
-
-
$14,500,000
-
-
-
-
-
-
-
-
-
-
-
-
-
-
-
-
-
-
40 Fifth Avenue
$19,000,000
Median Price
Past 12 months
Past 12 months
-
-
-
$14,500,000
-
-
-
-
-
-
-
-
-
-
-
-
-
-
-
-
-
-
43 Fifth Avenue
N/A
Avg. Price / ft2
Past 12 months
Past 12 months
-
-
-
-
-
-
-
-
-
-
-
-
-
-
-
-
-
-
-
-
-
-
43 Fifth Avenue
$8,625,000
Avg. Price
Past 12 months
Past 12 months
$2,700,000
-
$1,675,000
-
-
$3,950,000
$1,595,000
$3,800,000
$3,261,000
-
$3,700,000
$1,116,667
$850,000
-
-
$1,600,000
$1,625,000
$905,329
-
$4,235,000
$2,385,000
$893,500
43 Fifth Avenue
$8,625,000
Median Price
Past 12 months
Past 12 months
$2,700,000
-
$1,675,000
-
-
$3,950,000
$1,595,000
$3,800,000
$3,261,000
-
$2,300,000
$1,091,244
$850,000
-
-
$1,600,000
$1,625,000
$905,329
-
$4,235,000
$2,250,000
$893,500
43 Fifth Avenue
N/A
Avg. Price / ft2
Past 12 months
Past 12 months
-
-
-
-
-
-
-
-
-
-
-
-
-
-
-
-
-
-
-
-
-
-
43 Fifth Avenue
N/A
Avg. Price
Past 12 months
Past 12 months
-
-
-
-
-
-
-
-
-
-
-
-
-
-
-
-
-
-
-
-
-
-
43 Fifth Avenue
N/A
Median Price
Past 12 months
Past 12 months
-
-
-
-
-
-
-
-
-
-
-
-
-
-
-
-
-
-
-
-
-
-
43 Fifth Avenue
N/A
Avg. Price / ft2
Past 12 months
Past 12 months
-
-
-
-
-
-
-
-
-
-
-
-
-
-
-
-
-
-
-
-
-
-
43 Fifth Avenue
N/A
Avg. Price
Past 12 months
Past 12 months
-
-
$1,675,000
-
-
-
$1,595,000
-
$622,000
-
-
-
-
-
-
-
-
-
-
-
-
-
43 Fifth Avenue
N/A
Median Price
Past 12 months
Past 12 months
-
-
$1,675,000
-
-
-
$1,595,000
-
$622,000
-
-
-
-
-
-
-
-
-
-
-
-
-
43 Fifth Avenue
N/A
Avg. Price / ft2
Past 12 months
Past 12 months
-
-
-
-
-
-
-
-
-
-
-
-
-
-
-
-
-
-
-
-
-
-
43 Fifth Avenue
N/A
Avg. Price
Past 12 months
Past 12 months
$2,700,000
-
-
-
-
$3,950,000
-
$3,800,000
-
-
$1,750,000
$800,000
$850,000
-
-
$1,600,000
-
$1,260,000
-
-
$3,690,000
-
43 Fifth Avenue
N/A
Median Price
Past 12 months
Past 12 months
$2,700,000
-
-
-
-
$3,950,000
-
$3,800,000
-
-
$1,750,000
$800,000
$850,000
-
-
$1,600,000
-
$1,260,000
-
-
$3,690,000
-
43 Fifth Avenue
N/A
Avg. Price / ft2
Past 12 months
Past 12 months
-
-
-
-
-
-
-
-
-
-
-
-
-
-
-
-
-
-
-
-
-
-
43 Fifth Avenue
N/A
Avg. Price
Past 12 months
Past 12 months
-
-
-
-
-
-
-
-
-
-
-
-
-
-
-
-
-
-
-
-
$2,250,000
$1,430,000
43 Fifth Avenue
N/A
Median Price
Past 12 months
Past 12 months
-
-
-
-
-
-
-
-
-
-
-
-
-
-
-
-
-
-
-
-
$2,250,000
$1,430,000
43 Fifth Avenue
N/A
Avg. Price / ft2
Past 12 months
Past 12 months
-
-
-
-
-
-
-
-
-
-
-
-
-
-
-
-
-
-
-
-
-
-
43 Fifth Avenue
$8,625,000
Avg. Price
Past 12 months
Past 12 months
-
-
-
-
-
-
-
-
$5,900,000
-
$7,600,000
-
-
-
-
-
-
-
-
$4,100,000
-
-
43 Fifth Avenue
$8,625,000
Median Price
Past 12 months
Past 12 months
-
-
-
-
-
-
-
-
$5,900,000
-
$7,600,000
-
-
-
-
-
-
-
-
$4,100,000
-
-
43 Fifth Avenue
N/A
Avg. Price / ft2
Past 12 months
Past 12 months
-
-
-
-
-
-
-
-
-
-
-
-
-
-
-
-
-
-
-
-
-
-
43 Fifth Avenue
N/A
Avg. Price
Past 12 months
Past 12 months
-
-
-
-
-
-
-
-
-
-
-
-
-
-
-
-
-
-
-
-
-
-
43 Fifth Avenue
N/A
Median Price
Past 12 months
Past 12 months
-
-
-
-
-
-
-
-
-
-
-
-
-
-
-
-
-
-
-
-
-
-
The Gerken Building
N/A
Avg. Price / ft2
Past 12 months
Past 12 months
-
$1,800
-
-
-
-
-
-
-
-
-
$1,429
-
$743
-
-
-
-
$1,257
-
-
-
The Gerken Building
N/A
Avg. Price
Past 12 months
Past 12 months
-
$6,300,000
$4,300,000
-
-
-
-
-
-
-
-
$5,000,000
-
$2,600,000
-
-
-
-
$4,400,000
-
$2,995,000
-
The Gerken Building
N/A
Median Price
Past 12 months
Past 12 months
-
$6,300,000
$4,300,000
-
-
-
-
-
-
-
-
$5,000,000
-
$2,600,000
-
-
-
-
$4,400,000
-
$2,995,000
-
The Gerken Building
N/A
Avg. Price / ft2
Past 12 months
Past 12 months
-
-
-
-
-
-
-
-
-
-
-
-
-
-
-
-
-
-
-
-
-
-
The Gerken Building
N/A
Avg. Price
Past 12 months
Past 12 months
-
-
-
-
-
-
-
-
-
-
-
-
-
-
-
-
-
-
-
-
-
-
The Gerken Building
N/A
Median Price
Past 12 months
Past 12 months
-
-
-
-
-
-
-
-
-
-
-
-
-
-
-
-
-
-
-
-
-
-
The Gerken Building
N/A
Avg. Price / ft2
Past 12 months
Past 12 months
-
-
-
-
-
-
-
-
-
-
-
-
-
-
-
-
-
-
-
-
-
-
The Gerken Building
N/A
Avg. Price
Past 12 months
Past 12 months
-
-
$4,300,000
-
-
-
-
-
-
-
-
-
-
-
-
-
-
-
-
-
-
-
The Gerken Building
N/A
Median Price
Past 12 months
Past 12 months
-
-
$4,300,000
-
-
-
-
-
-
-
-
-
-
-
-
-
-
-
-
-
-
-
The Gerken Building
N/A
Avg. Price / ft2
Past 12 months
Past 12 months
-
$1,800
-
-
-
-
-
-
-
-
-
$1,429
-
-
-
-
-
-
$1,257
-
-
-
The Gerken Building
N/A
Avg. Price
Past 12 months
Past 12 months
-
$6,300,000
-
-
-
-
-
-
-
-
-
$5,000,000
-
-
-
-
-
-
$4,400,000
-
-
-
The Gerken Building
N/A
Median Price
Past 12 months
Past 12 months
-
$6,300,000
-
-
-
-
-
-
-
-
-
$5,000,000
-
-
-
-
-
-
$4,400,000
-
-
-
The Gerken Building
N/A
Avg. Price / ft2
Past 12 months
Past 12 months
-
-
-
-
-
-
-
-
-
-
-
-
-
$743
-
-
-
-
-
-
-
-
The Gerken Building
N/A
Avg. Price
Past 12 months
Past 12 months
-
-
-
-
-
-
-
-
-
-
-
-
-
$2,600,000
-
-
-
-
-
-
$2,995,000
-
The Gerken Building
N/A
Median Price
Past 12 months
Past 12 months
-
-
-
-
-
-
-
-
-
-
-
-
-
$2,600,000
-
-
-
-
-
-
$2,995,000
-
The Gerken Building
N/A
Avg. Price / ft2
Past 12 months
Past 12 months
-
-
-
-
-
-
-
-
-
-
-
-
-
-
-
-
-
-
-
-
-
-
The Gerken Building
N/A
Avg. Price
Past 12 months
Past 12 months
-
-
-
-
-
-
-
-
-
-
-
-
-
-
-
-
-
-
-
-
-
-
The Gerken Building
N/A
Median Price
Past 12 months
Past 12 months
-
-
-
-
-
-
-
-
-
-
-
-
-
-
-
-
-
-
-
-
-
-
29 East 9th Street
N/A
Avg. Price / ft2
Past 12 months
Past 12 months
-
-
-
$2,214
-
-
-
-
-
-
-
$1,250
-
-
-
$1,271
$1,844
$953
-
$1,186
$870
-
29 East 9th Street
N/A
Avg. Price
Past 12 months
Past 12 months
-
-
-
$3,100,000
-
-
$1,895,000
-
-
-
$2,100,000
$2,375,000
-
-
-
$1,445,000
$1,475,000
$1,810,000
$2,110,000
$980,000
$1,712,500
$1,800,000
29 East 9th Street
N/A
Median Price
Past 12 months
Past 12 months
-
-
-
$3,100,000
-
-
$1,895,000
-
-
-
$2,100,000
$2,375,000
-
-
-
$1,445,000
$1,475,000
$1,810,000
$2,110,000
$875,000
$1,712,500
$1,800,000
29 East 9th Street
N/A
Avg. Price / ft2
Past 12 months
Past 12 months
-
-
-
-
-
-
-
-
-
-
-
-
-
-
-
-
-
-
-
-
-
-
29 East 9th Street
N/A
Avg. Price
Past 12 months
Past 12 months
-
-
-
-
-
-
-
-
-
-
-
-
-
-
-
-
-
-
-
-
-
-
29 East 9th Street
N/A
Median Price
Past 12 months
Past 12 months
-
-
-
-
-
-
-
-
-
-
-
-
-
-
-
-
-
-
-
-
-
-
29 East 9th Street
N/A
Avg. Price / ft2
Past 12 months
Past 12 months
-
-
-
$2,214
-
-
-
-
-
-
-
$1,250
-
-
-
$1,271
$1,844
-
-
$1,186
-
-
29 East 9th Street
N/A
Avg. Price
Past 12 months
Past 12 months
-
-
-
$3,100,000
-
-
-
-
-
-
-
$1,250,000
-
-
-
$1,445,000
$1,475,000
$1,237,500
-
$980,000
-
-
29 East 9th Street
N/A
Median Price
Past 12 months
Past 12 months
-
-
-
$3,100,000
-
-
-
-
-
-
-
$1,250,000
-
-
-
$1,445,000
$1,475,000
$1,237,500
-
$875,000
-
-
29 East 9th Street
N/A
Avg. Price / ft2
Past 12 months
Past 12 months
-
-
-
-
-
-
-
-
-
-
-
-
-
-
-
-
-
-
-
-
-
-
29 East 9th Street
N/A
Avg. Price
Past 12 months
Past 12 months
-
-
-
-
-
-
$1,895,000
-
-
-
$2,100,000
-
-
-
-
-
-
-
$1,325,000
-
$1,250,000
-
29 East 9th Street
N/A
Median Price
Past 12 months
Past 12 months
-
-
-
-
-
-
$1,895,000
-
-
-
$2,100,000
-
-
-
-
-
-
-
$1,325,000
-
$1,250,000
-
29 East 9th Street
N/A
Avg. Price / ft2
Past 12 months
Past 12 months
-
-
-
-
-
-
-
-
-
-
-
-
-
-
-
-
-
$953
-
-
$870
-
29 East 9th Street
N/A
Avg. Price
Past 12 months
Past 12 months
-
-
-
-
-
-
-
-
-
-
-
$3,500,000
-
-
-
-
-
$2,382,500
$2,895,000
-
$2,175,000
$1,800,000
29 East 9th Street
N/A
Median Price
Past 12 months
Past 12 months
-
-
-
-
-
-
-
-
-
-
-
$3,500,000
-
-
-
-
-
$2,382,500
$2,895,000
-
$2,175,000
$1,800,000
29 East 9th Street
N/A
Avg. Price / ft2
Past 12 months
Past 12 months
-
-
-
-
-
-
-
-
-
-
-
-
-
-
-
-
-
-
-
-
-
-
29 East 9th Street
N/A
Avg. Price
Past 12 months
Past 12 months
-
-
-
-
-
-
-
-
-
-
-
-
-
-
-
-
-
-
-
-
-
-
29 East 9th Street
N/A
Median Price
Past 12 months
Past 12 months
-
-
-
-
-
-
-
-
-
-
-
-
-
-
-
-
-
-
-
-
-
-
29 East 9th Street
N/A
Avg. Price / ft2
Past 12 months
Past 12 months
-
-
-
-
-
-
-
-
-
-
-
-
-
-
-
-
-
-
-
-
-
-
29 East 9th Street
N/A
Avg. Price
Past 12 months
Past 12 months
-
-
-
-
-
-
-
-
-
-
-
-
-
-
-
-
-
-
-
-
-
-
29 East 9th Street
N/A
Median Price
Past 12 months
Past 12 months
-
-
-
-
-
-
-
-
-
-
-
-
-
-
-
-
-
-
-
-
-
-
Saint Germain
N/A
Avg. Price / ft2
Past 12 months
Past 12 months
$1,571
$1,305
$1,400
$1,750
$1,372
-
$1,199
$1,336
$1,453
$1,254
$1,346
-
$1,301
$1,194
$1,073
$1,007
$1,075
$986
$938
$828
$783
$536
Saint Germain
$925,000
Avg. Price
Past 12 months
Past 12 months
$1,237,000
$857,083
$1,020,000
$940,000
$943,750
$1,125,000
$905,750
$856,224
$1,217,667
$1,179,166
$891,555
$1,043,750
$709,251
$787,500
$715,876
$760,198
$1,027,098
$821,235
$712,133
$734,375
$465,657
$373,611
Saint Germain
$770,000
Median Price
Past 12 months
Past 12 months
$1,075,000
$802,500
$1,020,000
$872,500
$943,750
$1,125,000
$905,750
$725,000
$975,000
$945,000
$920,000
$782,500
$752,500
$737,500
$779,720
$760,000
$767,295
$687,523
$635,000
$668,750
$385,000
$389,000
Saint Germain
N/A
Avg. Price / ft2
Past 12 months
Past 12 months
-
$1,292
-
-
$1,556
-
-
$1,304
$1,567
$1,075
-
-
$990
-
$1,195
-
$1,000
-
$979
-
$633
-
Saint Germain
$760,000
Avg. Price
Past 12 months
Past 12 months
$800,000
$770,000
-
$615,000
$700,000
-
-
$668,392
$705,000
$635,000
$712,775
-
$537,667
$465,000
$537,908
$470,000
$518,750
$496,208
$411,800
$425,000
$355,120
$330,000
Saint Germain
$760,000
Median Price
Past 12 months
Past 12 months
$800,000
$770,000
-
$615,000
$700,000
-
-
$678,284
$705,000
$635,000
$712,775
-
$555,000
$465,000
$537,908
$470,000
$518,750
$491,250
$411,800
$425,000
$365,000
$330,000
Saint Germain
N/A
Avg. Price / ft2
Past 12 months
Past 12 months
$1,571
$1,317
$1,400
$1,750
-
-
$1,199
$1,400
$1,397
$1,343
$1,346
-
$1,456
$1,304
$1,012
$1,029
$1,112
$986
$918
$828
-
$536
Saint Germain
$966,250
Avg. Price
Past 12 months
Past 12 months
$1,045,000
$900,625
$1,020,000
$1,048,333
-
$1,125,000
$905,750
$1,106,667
$967,000
$916,667
$936,250
$758,333
$779,086
$752,500
$804,860
$780,000
$843,363
$708,929
$654,519
$668,750
$399,000
$416,500
Saint Germain
$945,000
Median Price
Past 12 months
Past 12 months
$1,075,000
$896,250
$1,020,000
$995,000
-
$1,125,000
$905,750
$1,120,000
$920,000
$920,000
$930,000
$735,000
$809,000
$735,000
$804,860
$800,000
$800,000
$687,523
$635,000
$668,750
$399,000
$416,000
Saint Germain
N/A
Avg. Price / ft2
Past 12 months
Past 12 months
-
-
-
-
$1,188
-
-
-
-
-
-
-
-
$1,083
-
$985
-
-
-
-
$1,085
-
Saint Germain
N/A
Avg. Price
Past 12 months
Past 12 months
$2,250,000
-
$1,020,000
-
$1,187,500
-
-
-
$1,806,333
$1,804,442
-
$1,900,000
$805,000
$1,018,750
-
$1,182,439
$2,595,000
$1,370,873
$1,095,000
$1,175,000
$1,085,000
$485,000
Saint Germain
N/A
Median Price
Past 12 months
Past 12 months
$2,250,000
-
$1,020,000
-
$1,187,500
-
-
-
$2,150,000
$1,850,000
-
$1,900,000
$805,000
$1,018,750
-
$1,182,439
$2,595,000
$1,438,278
$1,095,000
$1,175,000
$1,085,000
$485,000
Saint Germain
N/A
Avg. Price / ft2
Past 12 months
Past 12 months
-
-
-
-
-
-
-
-
-
-
-
-
-
-
-
-
-
-
-
-
-
-
Saint Germain
N/A
Avg. Price
Past 12 months
Past 12 months
-
-
-
-
-
-
-
-
-
-
-
-
-
-
-
$568,750
-
-
-
-
-
-
Saint Germain
N/A
Median Price
Past 12 months
Past 12 months
-
-
-
-
-
-
-
-
-
-
-
-
-
-
-
$568,750
-
-
-
-
-
-
Saint Germain
N/A
Avg. Price / ft2
Past 12 months
Past 12 months
-
-
-
-
-
-
-
-
-
-
-
-
-
-
-
-
-
-
-
-
-
-
Saint Germain
N/A
Avg. Price
Past 12 months
Past 12 months
-
-
-
-
-
-
-
-
-
-
-
-
-
-
-
-
-
-
-
-
-
-
Saint Germain
N/A
Median Price
Past 12 months
Past 12 months
-
-
-
-
-
-
-
-
-
-
-
-
-
-
-
-
-
-
-
-
-
-
Saint Germain
N/A
Avg. Price / ft2
Past 12 months
Past 12 months
-
-
-
-
-
-
-
-
-
-
-
-
-
-
-
-
-
-
-
-
-
-
Saint Germain
N/A
Avg. Price
Past 12 months
Past 12 months
-
-
-
-
-
-
-
-
-
-
-
-
-
-
-
-
-
-
-
-
-
-
Saint Germain
N/A
Median Price
Past 12 months
Past 12 months
-
-
-
-
-
-
-
-
-
-
-
-
-
-
-
-
-
-
-
-
-
-
644 Broadway
N/A
Avg. Price / ft2
Past 12 months
Past 12 months
-
-
$1,188
$1,369
$1,022
-
-
-
$1,196
-
$1,425
$1,018
-
-
-
$1,015
-
$771
-
$870
$761
-
644 Broadway
N/A
Avg. Price
Past 12 months
Past 12 months
-
-
$3,450,000
$3,691,667
$2,350,000
-
-
-
$2,750,000
-
$1,995,000
$2,850,000
-
-
-
$3,428,333
-
$3,000,000
-
$2,000,000
$1,065,000
$1,550,000
644 Broadway
N/A
Median Price
Past 12 months
Past 12 months
-
-
$3,450,000
$3,200,000
$2,350,000
-
-
-
$2,750,000
-
$1,995,000
$2,850,000
-
-
-
$3,435,000
-
$3,000,000
-
$2,000,000
$1,065,000
$1,550,000
644 Broadway
N/A
Avg. Price / ft2
Past 12 months
Past 12 months
-
-
-
-
-
-
-
-
-
-
-
-
-
-
-
-
-
-
-
-
-
-
644 Broadway
N/A
Avg. Price
Past 12 months
Past 12 months
-
-
-
-
-
-
-
-
-
-
-
-
-
-
-
-
-
-
-
-
-
-
644 Broadway
N/A
Median Price
Past 12 months
Past 12 months
-
-
-
-
-
-
-
-
-
-
-
-
-
-
-
-
-
-
-
-
-
-
644 Broadway
N/A
Avg. Price / ft2
Past 12 months
Past 12 months
-
-
-
$1,502
$1,022
-
-
-
$1,196
-
$1,425
$1,018
-
-
-
$1,015
-
-
-
$870
$761
-
644 Broadway
N/A
Avg. Price
Past 12 months
Past 12 months
-
-
-
$3,937,500
$2,350,000
-
-
-
$2,750,000
-
$1,995,000
$2,850,000
-
-
-
$3,450,000
-
-
-
$2,000,000
$1,065,000
$1,550,000
644 Broadway
N/A
Median Price
Past 12 months
Past 12 months
-
-
-
$3,937,500
$2,350,000
-
-
-
$2,750,000
-
$1,995,000
$2,850,000
-
-
-
$3,450,000
-
-
-
$2,000,000
$1,065,000
$1,550,000
644 Broadway
N/A
Avg. Price / ft2
Past 12 months
Past 12 months
-
-
$1,188
$1,102
-
-
-
-
-
-
-
-
-
-
-
$1,171
-
$771
-
-
-
-
644 Broadway
N/A
Avg. Price
Past 12 months
Past 12 months
-
-
$3,450,000
$3,200,000
-
-
-
-
-
-
-
-
-
-
-
$3,400,000
-
$3,000,000
-
-
-
-
644 Broadway
N/A
Median Price
Past 12 months
Past 12 months
-
-
$3,450,000
$3,200,000
-
-
-
-
-
-
-
-
-
-
-
$3,400,000
-
$3,000,000
-
-
-
-
644 Broadway
N/A
Avg. Price / ft2
Past 12 months
Past 12 months
-
-
-
-
-
-
-
-
-
-
-
-
-
-
-
$859
-
-
-
-
-
-
644 Broadway
N/A
Avg. Price
Past 12 months
Past 12 months
-
-
-
-
-
-
-
-
-
-
-
-
-
-
-
$3,435,000
-
-
-
-
-
-
644 Broadway
N/A
Median Price
Past 12 months
Past 12 months
-
-
-
-
-
-
-
-
-
-
-
-
-
-
-
$3,435,000
-
-
-
-
-
-
644 Broadway
N/A
Avg. Price / ft2
Past 12 months
Past 12 months
-
-
-
-
-
-
-
-
-
-
-
-
-
-
-
-
-
-
-
-
-
-
644 Broadway
N/A
Avg. Price
Past 12 months
Past 12 months
-
-
-
-
-
-
-
-
-
-
-
-
-
-
-
-
-
-
-
-
-
-
644 Broadway
N/A
Median Price
Past 12 months
Past 12 months
-
-
-
-
-
-
-
-
-
-
-
-
-
-
-
-
-
-
-
-
-
-
25 Minetta Lane
N/A
Avg. Price / ft2
Past 12 months
Past 12 months
$1,528
-
$1,366
$930
-
$2,768
-
-
$1,201
-
-
$923
$910
$873
$1,059
$1,200
$952
$896
$1,047
$901
-
$578
25 Minetta Lane
$766,667
Avg. Price
Past 12 months
Past 12 months
$947,500
$817,500
$740,000
$465,000
-
$1,915,000
$1,215,000
$840,000
$721,333
$587,283
$551,823
$488,000
$633,795
$513,333
$900,000
$723,400
$593,133
$907,500
$607,500
$704,235
-
$359,833
25 Minetta Lane
$775,000
Median Price
Past 12 months
Past 12 months
$947,500
$817,500
$740,000
$465,000
-
$2,100,000
$1,215,000
$840,000
$630,000
$587,283
$551,823
$470,000
$529,781
$515,000
$900,000
$720,000
$504,400
$907,500
$607,500
$735,000
-
$377,500
25 Minetta Lane
N/A
Avg. Price / ft2
Past 12 months
Past 12 months
$1,590
-
$1,366
$930
-
-
-
-
$1,070
-
-
$923
$910
$879
-
-
$841
$733
-
$744
-
-
25 Minetta Lane
$725,000
Avg. Price
Past 12 months
Past 12 months
$795,000
$640,000
$740,000
$465,000
-
-
-
-
$535,000
$587,283
-
$488,000
$489,320
$457,500
-
-
$464,700
$440,000
-
$445,589
-
-
25 Minetta Lane
$725,000
Median Price
Past 12 months
Past 12 months
$795,000
$640,000
$740,000
$465,000
-
-
-
-
$535,000
$587,283
-
$470,000
$486,250
$457,500
-
-
$464,700
$440,000
-
$445,589
-
-
25 Minetta Lane
N/A
Avg. Price / ft2
Past 12 months
Past 12 months
$1,467
-
-
-
-
$1,588
-
-
$1,332
-
-
-
-
$862
$1,059
$1,200
$1,063
-
$1,047
$1,059
-
$578
25 Minetta Lane
$850,000
Avg. Price
Past 12 months
Past 12 months
$1,100,000
$995,000
-
-
-
$1,350,000
$1,215,000
$840,000
$814,500
-
-
-
$826,428
$625,000
$900,000
$723,400
$850,000
-
$607,500
$876,667
-
$359,833
25 Minetta Lane
$850,000
Median Price
Past 12 months
Past 12 months
$1,100,000
$995,000
-
-
-
$1,350,000
$1,215,000
$840,000
$814,500
-
-
-
$849,626
$625,000
$900,000
$720,000
$850,000
-
$607,500
$900,000
-
$377,500
25 Minetta Lane
N/A
Avg. Price / ft2
Past 12 months
Past 12 months
-
-
-
-
-
$3,358
-
-
-
-
-
-
-
-
-
-
-
$1,058
-
-
-
-
25 Minetta Lane
N/A
Avg. Price
Past 12 months
Past 12 months
-
-
-
-
-
$2,197,500
-
-
-
-
-
-
-
-
-
-
-
$1,375,000
-
-
-
-
25 Minetta Lane
N/A
Median Price
Past 12 months
Past 12 months
-
-
-
-
-
$2,197,500
-
-
-
-
-
-
-
-
-
-
-
$1,375,000
-
-
-
-
25 Minetta Lane
N/A
Avg. Price / ft2
Past 12 months
Past 12 months
-
-
-
-
-
-
-
-
-
-
-
-
-
-
-
-
-
-
-
-
-
-
25 Minetta Lane
N/A
Avg. Price
Past 12 months
Past 12 months
-
-
-
-
-
-
-
-
-
-
-
-
-
-
-
-
-
-
-
-
-
-
25 Minetta Lane
N/A
Median Price
Past 12 months
Past 12 months
-
-
-
-
-
-
-
-
-
-
-
-
-
-
-
-
-
-
-
-
-
-
25 Minetta Lane
N/A
Avg. Price / ft2
Past 12 months
Past 12 months
-
-
-
-
-
-
-
-
-
-
-
-
-
-
-
-
-
-
-
-
-
-
25 Minetta Lane
N/A
Avg. Price
Past 12 months
Past 12 months
-
-
-
-
-
-
-
-
-
-
-
-
-
-
-
-
-
-
-
-
-
-
25 Minetta Lane
N/A
Median Price
Past 12 months
Past 12 months
-
-
-
-
-
-
-
-
-
-
-
-
-
-
-
-
-
-
-
-
-
-
30 East 10th Street
N/A
Avg. Price / ft2
Past 12 months
Past 12 months
-
-
-
$1,267
-
$1,667
$1,544
-
$1,333
-
-
$1,167
-
-
-
-
-
-
-
-
$806
-
30 East 10th Street
$5,850,000
Avg. Price
Past 12 months
Past 12 months
-
-
-
$2,280,000
-
$2,750,000
$5,325,000
$2,200,000
$4,000,000
-
-
$2,100,000
-
-
-
-
-
-
-
-
$1,450,000
-
30 East 10th Street
$5,850,000
Median Price
Past 12 months
Past 12 months
-
-
-
$2,280,000
-
$2,750,000
$5,325,000
$2,200,000
$4,000,000
-
-
$2,100,000
-
-
-
-
-
-
-
-
$1,450,000
-
30 East 10th Street
N/A
Avg. Price / ft2
Past 12 months
Past 12 months
-
-
-
-
-
-
-
-
-
-
-
-
-
-
-
-
-
-
-
-
-
-
30 East 10th Street
N/A
Avg. Price
Past 12 months
Past 12 months
-
-
-
-
-
-
-
-
-
-
-
-
-
-
-
-
-
-
-
-
-
-
30 East 10th Street
N/A
Median Price
Past 12 months
Past 12 months
-
-
-
-
-
-
-
-
-
-
-
-
-
-
-
-
-
-
-
-
-
-
30 East 10th Street
N/A
Avg. Price / ft2
Past 12 months
Past 12 months
-
-
-
$1,267
-
-
-
-
-
-
-
$1,167
-
-
-
-
-
-
-
-
$806
-
30 East 10th Street
N/A
Avg. Price
Past 12 months
Past 12 months
-
-
-
$2,280,000
-
-
-
-
-
-
-
$2,100,000
-
-
-
-
-
-
-
-
$1,450,000
-
30 East 10th Street
N/A
Median Price
Past 12 months
Past 12 months
-
-
-
$2,280,000
-
-
-
-
-
-
-
$2,100,000
-
-
-
-
-
-
-
-
$1,450,000
-
30 East 10th Street
N/A
Avg. Price / ft2
Past 12 months
Past 12 months
-
-
-
-
-
-
$1,544
-
-
-
-
-
-
-
-
-
-
-
-
-
-
-
30 East 10th Street
N/A
Avg. Price
Past 12 months
Past 12 months
-
-
-
-
-
-
$2,625,000
-
-
-
-
-
-
-
-
-
-
-
-
-
-
-
30 East 10th Street
N/A
Median Price
Past 12 months
Past 12 months
-
-
-
-
-
-
$2,625,000
-
-
-
-
-
-
-
-
-
-
-
-
-
-
-
30 East 10th Street
N/A
Avg. Price / ft2
Past 12 months
Past 12 months
-
-
-
-
-
$1,667
-
-
$1,333
-
-
-
-
-
-
-
-
-
-
-
-
-
30 East 10th Street
$5,850,000
Avg. Price
Past 12 months
Past 12 months
-
-
-
-
-
$2,750,000
$8,025,000
$2,200,000
$4,000,000
-
-
-
-
-
-
-
-
-
-
-
-
-
30 East 10th Street
$5,850,000
Median Price
Past 12 months
Past 12 months
-
-
-
-
-
$2,750,000
$8,025,000
$2,200,000
$4,000,000
-
-
-
-
-
-
-
-
-
-
-
-
-
30 East 10th Street
N/A
Avg. Price / ft2
Past 12 months
Past 12 months
-
-
-
-
-
-
-
-
-
-
-
-
-
-
-
-
-
-
-
-
-
-
30 East 10th Street
N/A
Avg. Price
Past 12 months
Past 12 months
-
-
-
-
-
-
-
-
-
-
-
-
-
-
-
-
-
-
-
-
-
-
30 East 10th Street
N/A
Median Price
Past 12 months
Past 12 months
-
-
-
-
-
-
-
-
-
-
-
-
-
-
-
-
-
-
-
-
-
-
30 East 10th Street
N/A
Avg. Price / ft2
Past 12 months
Past 12 months
-
-
-
-
-
-
-
-
-
-
-
-
-
-
-
-
-
-
-
-
-
-
30 East 10th Street
N/A
Avg. Price
Past 12 months
Past 12 months
-
-
-
-
-
-
-
-
-
-
-
-
-
-
-
-
-
-
-
-
-
-
30 East 10th Street
N/A
Median Price
Past 12 months
Past 12 months
-
-
-
-
-
-
-
-
-
-
-
-
-
-
-
-
-
-
-
-
-
-
840 Broadway
N/A
Avg. Price / ft2
Past 12 months
Past 12 months
$1,008
-
-
-
$1,383
-
$1,400
-
-
-
-
-
-
-
-
-
-
-
-
-
-
-
840 Broadway
N/A
Avg. Price
Past 12 months
Past 12 months
$3,025,000
-
-
-
$4,150,000
-
$4,200,000
-
-
-
-
-
-
-
-
-
$3,850,000
$3,200,000
-
-
-
-
840 Broadway
N/A
Median Price
Past 12 months
Past 12 months
$3,025,000
-
-
-
$4,150,000
-
$4,200,000
-
-
-
-
-
-
-
-
-
$3,850,000
$3,200,000
-
-
-
-
840 Broadway
N/A
Avg. Price / ft2
Past 12 months
Past 12 months
-
-
-
-
-
-
-
-
-
-
-
-
-
-
-
-
-
-
-
-
-
-
840 Broadway
N/A
Avg. Price
Past 12 months
Past 12 months
-
-
-
-
-
-
-
-
-
-
-
-
-
-
-
-
-
-
-
-
-
-
840 Broadway
N/A
Median Price
Past 12 months
Past 12 months
-
-
-
-
-
-
-
-
-
-
-
-
-
-
-
-
-
-
-
-
-
-
840 Broadway
N/A
Avg. Price / ft2
Past 12 months
Past 12 months
$1,008
-
-
-
-
-
-
-
-
-
-
-
-
-
-
-
-
-
-
-
-
-
840 Broadway
N/A
Avg. Price
Past 12 months
Past 12 months
$3,025,000
-
-
-
-
-
-
-
-
-
-
-
-
-
-
-
-
-
-
-
-
-
840 Broadway
N/A
Median Price
Past 12 months
Past 12 months
$3,025,000
-
-
-
-
-
-
-
-
-
-
-
-
-
-
-
-
-
-
-
-
-
840 Broadway
N/A
Avg. Price / ft2
Past 12 months
Past 12 months
-
-
-
-
$1,383
-
$1,400
-
-
-
-
-
-
-
-
-
-
-
-
-
-
-
840 Broadway
N/A
Avg. Price
Past 12 months
Past 12 months
-
-
-
-
$4,150,000
-
$4,200,000
-
-
-
-
-
-
-
-
-
-
-
-
-
-
-
840 Broadway
N/A
Median Price
Past 12 months
Past 12 months
-
-
-
-
$4,150,000
-
$4,200,000
-
-
-
-
-
-
-
-
-
-
-
-
-
-
-
840 Broadway
N/A
Avg. Price / ft2
Past 12 months
Past 12 months
-
-
-
-
-
-
-
-
-
-
-
-
-
-
-
-
-
-
-
-
-
-
840 Broadway
N/A
Avg. Price
Past 12 months
Past 12 months
-
-
-
-
-
-
-
-
-
-
-
-
-
-
-
-
-
-
-
-
-
-
840 Broadway
N/A
Median Price
Past 12 months
Past 12 months
-
-
-
-
-
-
-
-
-
-
-
-
-
-
-
-
-
-
-
-
-
-
840 Broadway
N/A
Avg. Price / ft2
Past 12 months
Past 12 months
-
-
-
-
-
-
-
-
-
-
-
-
-
-
-
-
-
-
-
-
-
-
840 Broadway
N/A
Avg. Price
Past 12 months
Past 12 months
-
-
-
-
-
-
-
-
-
-
-
-
-
-
-
-
-
-
-
-
-
-
840 Broadway
N/A
Median Price
Past 12 months
Past 12 months
-
-
-
-
-
-
-
-
-
-
-
-
-
-
-
-
-
-
-
-
-
-
15 West 11th Street
N/A
Avg. Price / ft2
Past 12 months
Past 12 months
-
-
-
-
-
-
-
-
-
-
-
$2,200
$1,278
-
-
-
$2,256
$1,333
-
$1,259
-
-
15 West 11th Street
$1,895,000
Avg. Price
Past 12 months
Past 12 months
-
-
-
-
-
$1,950,000
$9,995,000
$2,000,000
-
$1,875,000
$1,463,333
$2,906,800
$1,285,000
-
-
-
$2,479,500
$1,097,500
-
$1,762,500
$3,600,000
-
15 West 11th Street
$1,895,000
Median Price
Past 12 months
Past 12 months
-
-
-
-
-
$1,950,000
$9,995,000
$2,000,000
-
$1,875,000
$1,250,000
$2,075,000
$1,200,000
-
-
-
$2,479,500
$1,097,500
-
$1,762,500
$3,600,000
-
15 West 11th Street
N/A
Avg. Price / ft2
Past 12 months
Past 12 months
-
-
-
-
-
-
-
-
-
-
-
-
-
-
-
-
-
-
-
-
-
-
15 West 11th Street
N/A
Avg. Price
Past 12 months
Past 12 months
-
-
-
-
-
-
-
-
-
-
-
-
-
-
-
-
-
-
-
-
-
-
15 West 11th Street
N/A
Median Price
Past 12 months
Past 12 months
-
-
-
-
-
-
-
-
-
-
-
-
-
-
-
-
-
-
-
-
-
-
15 West 11th Street
N/A
Avg. Price / ft2
Past 12 months
Past 12 months
-
-
-
-
-
-
-
-
-
-
-
-
$1,278
-
-
-
-
$1,333
-
$1,039
-
-
15 West 11th Street
$1,895,000
Avg. Price
Past 12 months
Past 12 months
-
-
-
-
-
-
-
-
-
$1,100,000
$1,250,000
$1,294,667
$1,146,667
-
-
-
-
$1,097,500
-
$935,000
-
-
15 West 11th Street
$1,895,000
Median Price
Past 12 months
Past 12 months
-
-
-
-
-
-
-
-
-
$1,100,000
$1,250,000
$949,000
$1,150,000
-
-
-
-
$1,097,500
-
$935,000
-
-
15 West 11th Street
N/A
Avg. Price / ft2
Past 12 months
Past 12 months
-
-
-
-
-
-
-
-
-
-
-
$2,200
-
-
-
-
$2,256
-
-
$1,480
-
-
15 West 11th Street
N/A
Avg. Price
Past 12 months
Past 12 months
-
-
-
-
-
$1,950,000
-
$2,000,000
-
$2,650,000
$1,950,000
$3,850,000
$1,700,000
-
-
-
$2,479,500
-
-
$2,590,000
-
-
15 West 11th Street
N/A
Median Price
Past 12 months
Past 12 months
-
-
-
-
-
$1,950,000
-
$2,000,000
-
$2,650,000
$1,950,000
$3,850,000
$1,700,000
-
-
-
$2,479,500
-
-
$2,590,000
-
-
15 West 11th Street
N/A
Avg. Price / ft2
Past 12 months
Past 12 months
-
-
-
-
-
-
-
-
-
-
-
-
-
-
-
-
-
-
-
-
-
-
15 West 11th Street
N/A
Avg. Price
Past 12 months
Past 12 months
-
-
-
-
-
-
-
-
-
-
-
-
-
-
-
-
-
-
-
-
-
-
15 West 11th Street
N/A
Median Price
Past 12 months
Past 12 months
-
-
-
-
-
-
-
-
-
-
-
-
-
-
-
-
-
-
-
-
-
-
15 West 11th Street
N/A
Avg. Price / ft2
Past 12 months
Past 12 months
-
-
-
-
-
-
-
-
-
-
-
-
-
-
-
-
-
-
-
-
-
-
15 West 11th Street
N/A
Avg. Price
Past 12 months
Past 12 months
-
-
-
-
-
-
$9,995,000
-
-
-
-
$6,800,000
-
-
-
-
-
-
-
-
$3,600,000
-
15 West 11th Street
N/A
Median Price
Past 12 months
Past 12 months
-
-
-
-
-
-
$9,995,000
-
-
-
-
$6,800,000
-
-
-
-
-
-
-
-
$3,600,000
-
15 West 11th Street
N/A
Avg. Price / ft2
Past 12 months
Past 12 months
-
-
-
-
-
-
-
-
-
-
-
-
-
-
-
-
-
-
-
-
-
-
15 West 11th Street
N/A
Avg. Price
Past 12 months
Past 12 months
-
-
-
-
-
-
-
-
-
-
-
-
-
-
-
-
-
-
-
-
-
-
15 West 11th Street
N/A
Median Price
Past 12 months
Past 12 months
-
-
-
-
-
-
-
-
-
-
-
-
-
-
-
-
-
-
-
-
-
-