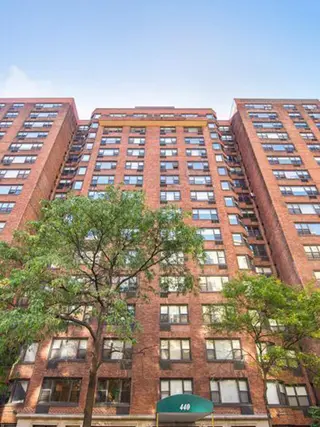
The Gregory House, 440 East 79th Street: Price Comparison
between First Avenue & York Avenue Building Profile
The Gregory House
$1,131,250
Avg. Price
Past 12 months
Past 12 months
2024
$1,373,000
2023
$634,555
2022
$649,490
2021
$1,020,534
2020
$1,193,500
2019
$942,500
2018
$724,285
2017
$707,143
2016
$876,177
2015
$807,192
2014
$646,444
2013
$739,050
2012
$523,597
2011
$609,006
2010
$631,000
2009
$563,690
2008
$611,738
2007
$519,857
2006
$797,496
2005
$530,471
2004
$539,486
2003
$398,310
The Gregory House
$1,138,750
Median Price
Past 12 months
Past 12 months
2024
$1,135,000
2023
$578,750
2022
$542,900
2021
$670,000
2020
$1,189,500
2019
$790,000
2018
$680,000
2017
$660,000
2016
$820,000
2015
$740,000
2014
$456,400
2013
$448,000
2012
$456,500
2011
$510,000
2010
$590,000
2009
$550,000
2008
$619,000
2007
$498,000
2006
$523,750
2005
$500,000
2004
$457,500
2003
$371,417
The Gregory House
N/A
Avg. Price
Past 12 months
Past 12 months
2024
-
2023
$411,000
2022
$423,536
2021
-
2020
$400,000
2019
$490,000
2018
$460,000
2017
$457,500
2016
$408,833
2015
$408,750
2014
$341,574
2013
$355,000
2012
-
2011
$342,250
2010
$320,000
2009
$395,312
2008
$421,007
2007
$484,000
2006
$358,750
2005
$324,850
2004
-
2003
$270,000
The Gregory House
N/A
Median Price
Past 12 months
Past 12 months
2024
-
2023
$411,000
2022
$423,536
2021
-
2020
$400,000
2019
$490,000
2018
$460,000
2017
$457,500
2016
$419,000
2015
$350,000
2014
$340,000
2013
$357,500
2012
-
2011
$339,500
2010
$320,000
2009
$387,500
2008
$446,160
2007
$484,000
2006
$358,750
2005
$325,000
2004
-
2003
$270,000
The Gregory House
$655,000
Avg. Price
Past 12 months
Past 12 months
2024
$565,000
2023
$606,221
2022
$540,724
2021
$648,375
2020
-
2019
$790,000
2018
$670,523
2017
$713,750
2016
$738,500
2015
$769,900
2014
$574,317
2013
$499,875
2012
$429,333
2011
$526,688
2010
$552,500
2009
$552,455
2008
$608,616
2007
$625,000
2006
$507,779
2005
$493,673
2004
$412,754
2003
$342,619
The Gregory House
$655,000
Median Price
Past 12 months
Past 12 months
2024
$565,000
2023
$600,000
2022
$507,950
2021
$656,250
2020
-
2019
$790,000
2018
$680,000
2017
$702,500
2016
$787,500
2015
$769,500
2014
$618,500
2013
$528,000
2012
$418,000
2011
$510,000
2010
$552,500
2009
$584,300
2008
$629,000
2007
$650,000
2006
$515,000
2005
$520,000
2004
$442,500
2003
$365,833
The Gregory House
$1,184,167
Avg. Price
Past 12 months
Past 12 months
2024
$1,177,500
2023
$1,280,000
2022
$1,180,000
2021
$1,025,120
2020
$1,189,500
2019
-
2018
$680,000
2017
$1,180,000
2016
$1,062,875
2015
$999,500
2014
$1,100,000
2013
-
2012
$999,000
2011
$836,667
2010
$865,000
2009
-
2008
$756,875
2007
$340,000
2006
$729,750
2005
$600,000
2004
$500,000
2003
$640,464
The Gregory House
$1,145,000
Median Price
Past 12 months
Past 12 months
2024
$1,177,500
2023
$1,280,000
2022
$1,180,000
2021
$1,025,120
2020
$1,189,500
2019
-
2018
$680,000
2017
$1,180,000
2016
$1,125,000
2015
$999,500
2014
$1,100,000
2013
-
2012
$999,000
2011
$860,000
2010
$865,000
2009
-
2008
$753,750
2007
$340,000
2006
$729,750
2005
$600,000
2004
$500,000
2003
$640,000
The Gregory House
$1,925,000
Avg. Price
Past 12 months
Past 12 months
2024
-
2023
-
2022
$780,000
2021
-
2020
$1,995,000
2019
$1,700,000
2018
$1,120,500
2017
-
2016
$1,572,500
2015
$1,505,000
2014
$2,150,000
2013
$1,401,000
2012
-
2011
$1,240,000
2010
-
2009
$1,125,000
2008
-
2007
-
2006
$1,183,500
2005
$1,225,000
2004
$1,065,902
2003
-
The Gregory House
$1,925,000
Median Price
Past 12 months
Past 12 months
2024
-
2023
-
2022
$780,000
2021
-
2020
$1,995,000
2019
$1,700,000
2018
$1,120,500
2017
-
2016
$1,572,500
2015
$1,505,000
2014
$2,150,000
2013
$1,401,000
2012
-
2011
$1,240,000
2010
-
2009
$1,125,000
2008
-
2007
-
2006
$1,183,500
2005
$1,225,000
2004
$1,065,902
2003
-
The Gregory House
N/A
Avg. Price
Past 12 months
Past 12 months
2024
-
2023
-
2022
-
2021
$2,500,000
2020
-
2019
-
2018
-
2017
-
2016
-
2015
-
2014
-
2013
$2,570,000
2012
-
2011
-
2010
-
2009
-
2008
-
2007
-
2006
-
2005
-
2004
-
2003
-
The Gregory House
N/A
Median Price
Past 12 months
Past 12 months
2024
-
2023
-
2022
-
2021
$2,500,000
2020
-
2019
-
2018
-
2017
-
2016
-
2015
-
2014
-
2013
$2,570,000
2012
-
2011
-
2010
-
2009
-
2008
-
2007
-
2006
-
2005
-
2004
-
2003
-
The Gregory House
N/A
Avg. Price
Past 12 months
Past 12 months
2024
$3,365,000
2023
-
2022
-
2021
-
2020
-
2019
-
2018
-
2017
-
2016
-
2015
-
2014
-
2013
-
2012
-
2011
-
2010
-
2009
-
2008
-
2007
-
2006
$2,800,000
2005
-
2004
-
2003
-
The Gregory House
N/A
Median Price
Past 12 months
Past 12 months
2024
$3,365,000
2023
-
2022
-
2021
-
2020
-
2019
-
2018
-
2017
-
2016
-
2015
-
2014
-
2013
-
2012
-
2011
-
2010
-
2009
-
2008
-
2007
-
2006
$2,800,000
2005
-
2004
-
2003
-
2 East End Avenue
N/A
Avg. Price / ft2
Past 12 months
Past 12 months
$875
-
-
-
-
-
$813
$1,200
-
$1,114
-
-
-
$772
$998
$795
-
-
-
$773
$690
$275
2 East End Avenue
N/A
Avg. Price
Past 12 months
Past 12 months
$1,925,000
-
-
-
-
-
$2,275,000
$2,400,000
-
$3,037,500
-
-
-
$1,775,000
$2,295,000
$1,750,000
-
-
$2,000,000
$1,700,000
$1,477,000
$1,154,000
2 East End Avenue
N/A
Median Price
Past 12 months
Past 12 months
$1,925,000
-
-
-
-
-
$2,275,000
$2,400,000
-
$3,037,500
-
-
-
$1,775,000
$2,295,000
$1,750,000
-
-
$2,000,000
$1,700,000
$1,477,000
$1,154,000
2 East End Avenue
N/A
Avg. Price / ft2
Past 12 months
Past 12 months
-
-
-
-
-
-
-
-
-
-
-
-
-
-
-
-
-
-
-
-
-
-
2 East End Avenue
N/A
Avg. Price
Past 12 months
Past 12 months
-
-
-
-
-
-
-
-
-
-
-
-
-
-
-
-
-
-
-
-
-
-
2 East End Avenue
N/A
Median Price
Past 12 months
Past 12 months
-
-
-
-
-
-
-
-
-
-
-
-
-
-
-
-
-
-
-
-
-
-
2 East End Avenue
N/A
Avg. Price / ft2
Past 12 months
Past 12 months
$875
-
-
-
-
-
-
$1,200
-
$1,114
-
-
-
$772
$998
$795
-
-
-
$773
$690
-
2 East End Avenue
N/A
Avg. Price
Past 12 months
Past 12 months
$1,925,000
-
-
-
-
-
-
$2,400,000
-
$2,450,000
-
-
-
$1,775,000
$2,295,000
$1,750,000
-
-
$2,000,000
$1,700,000
$1,477,000
-
2 East End Avenue
N/A
Median Price
Past 12 months
Past 12 months
$1,925,000
-
-
-
-
-
-
$2,400,000
-
$2,450,000
-
-
-
$1,775,000
$2,295,000
$1,750,000
-
-
$2,000,000
$1,700,000
$1,477,000
-
2 East End Avenue
N/A
Avg. Price / ft2
Past 12 months
Past 12 months
-
-
-
-
-
-
$813
-
-
-
-
-
-
-
-
-
-
-
-
-
-
-
2 East End Avenue
N/A
Avg. Price
Past 12 months
Past 12 months
-
-
-
-
-
-
$2,275,000
-
-
-
-
-
-
-
-
-
-
-
-
-
-
-
2 East End Avenue
N/A
Median Price
Past 12 months
Past 12 months
-
-
-
-
-
-
$2,275,000
-
-
-
-
-
-
-
-
-
-
-
-
-
-
-
2 East End Avenue
N/A
Avg. Price / ft2
Past 12 months
Past 12 months
-
-
-
-
-
-
-
-
-
-
-
-
-
-
-
-
-
-
-
-
-
-
2 East End Avenue
N/A
Avg. Price
Past 12 months
Past 12 months
-
-
-
-
-
-
-
-
-
-
-
-
-
-
-
-
-
-
-
-
-
-
2 East End Avenue
N/A
Median Price
Past 12 months
Past 12 months
-
-
-
-
-
-
-
-
-
-
-
-
-
-
-
-
-
-
-
-
-
-
Eastview House
N/A
Avg. Price / ft2
Past 12 months
Past 12 months
$827
$768
$1,033
$893
$880
$904
$920
$1,107
$877
$818
$955
$678
$782
$850
$723
$577
$757
$777
$695
$754
$619
-
Eastview House
$645,000
Avg. Price
Past 12 months
Past 12 months
$620,000
$393,750
$1,550,000
$1,510,000
$660,000
$950,000
$650,000
$1,205,575
$1,027,500
$938,533
$793,667
$509,222
$1,209,500
$791,875
$340,000
$559,600
$846,667
$711,250
$703,373
$479,500
$507,958
$247,500
Eastview House
$645,000
Median Price
Past 12 months
Past 12 months
$620,000
$393,750
$1,550,000
$1,510,000
$660,000
$950,000
$540,000
$1,235,000
$855,000
$875,600
$445,000
$485,000
$1,410,000
$461,250
$340,000
$540,000
$645,500
$652,500
$685,118
$397,000
$435,500
$247,500
Eastview House
N/A
Avg. Price / ft2
Past 12 months
Past 12 months
-
$768
-
-
-
-
$973
-
-
-
-
$759
$624
-
$723
$615
$764
-
$627
$754
-
-
Eastview House
$475,000
Avg. Price
Past 12 months
Past 12 months
-
$393,750
-
-
-
-
$530,000
-
-
-
-
$381,667
$306,000
-
$340,000
$356,500
$420,000
$360,000
$345,000
$381,667
-
$265,000
Eastview House
$475,000
Median Price
Past 12 months
Past 12 months
-
$393,750
-
-
-
-
$530,000
-
-
-
-
$380,000
$306,000
-
$340,000
$356,500
$420,000
$360,000
$345,000
$395,000
-
$265,000
Eastview House
N/A
Avg. Price / ft2
Past 12 months
Past 12 months
$827
-
-
-
$880
$900
$867
$964
$877
$625
$809
$638
-
$593
-
$540
$762
$735
$685
-
-
-
Eastview House
$815,000
Avg. Price
Past 12 months
Past 12 months
$620,000
-
-
-
$660,000
$630,000
$830,000
$675,000
$810,000
$750,300
$433,000
$573,000
-
$455,833
-
$595,000
$645,500
$600,000
$685,118
$403,500
$364,000
$230,000
Eastview House
$815,000
Median Price
Past 12 months
Past 12 months
$620,000
-
-
-
$660,000
$630,000
$830,000
$675,000
$805,000
$750,300
$433,000
$545,000
-
$450,000
-
$595,000
$645,500
$575,000
$685,118
$403,500
$374,250
$230,000
Eastview House
N/A
Avg. Price / ft2
Past 12 months
Past 12 months
-
-
-
$893
-
$907
-
$1,250
-
$1,012
$1,102
-
-
$1,106
-
-
$740
$862
$771
-
$619
-
Eastview House
N/A
Avg. Price
Past 12 months
Past 12 months
-
-
-
$875,000
-
$1,270,000
-
$1,736,150
$1,680,000
$1,315,000
$1,515,000
-
-
$1,800,000
-
$895,000
$999,000
$1,165,000
$1,080,000
$925,000
$795,875
-
Eastview House
N/A
Median Price
Past 12 months
Past 12 months
-
-
-
$875,000
-
$1,270,000
-
$1,736,150
$1,680,000
$1,315,000
$1,515,000
-
-
$1,800,000
-
$895,000
$999,000
$1,165,000
$1,080,000
$925,000
$795,875
-
Eastview House
N/A
Avg. Price / ft2
Past 12 months
Past 12 months
-
-
$1,033
-
-
-
-
-
-
-
-
-
$940
-
-
-
-
-
-
-
-
-
Eastview House
N/A
Avg. Price
Past 12 months
Past 12 months
-
-
$1,550,000
$2,145,000
-
-
-
-
-
-
-
-
$1,661,250
-
-
-
$1,950,000
-
-
-
-
-
Eastview House
N/A
Median Price
Past 12 months
Past 12 months
-
-
$1,550,000
$2,145,000
-
-
-
-
-
-
-
-
$1,661,250
-
-
-
$1,950,000
-
-
-
-
-
Eastview House
N/A
Avg. Price / ft2
Past 12 months
Past 12 months
-
-
-
-
-
-
-
-
-
-
-
-
-
-
-
-
-
-
-
-
-
-
Eastview House
N/A
Avg. Price
Past 12 months
Past 12 months
-
-
-
-
-
-
-
-
-
-
-
-
-
-
-
-
-
-
-
-
-
-
Eastview House
N/A
Median Price
Past 12 months
Past 12 months
-
-
-
-
-
-
-
-
-
-
-
-
-
-
-
-
-
-
-
-
-
-
Eastview House
N/A
Avg. Price / ft2
Past 12 months
Past 12 months
-
-
-
-
-
-
-
-
-
-
-
-
-
-
-
-
-
-
-
-
-
-
Eastview House
N/A
Avg. Price
Past 12 months
Past 12 months
-
-
-
-
-
-
-
-
-
-
-
-
-
-
-
-
-
-
-
-
-
-
Eastview House
N/A
Median Price
Past 12 months
Past 12 months
-
-
-
-
-
-
-
-
-
-
-
-
-
-
-
-
-
-
-
-
-
-
Emery Towers
$552
Avg. Price / ft2
Past 12 months
Past 12 months
$949
$850
$897
$911
$860
$811
$1,068
$712
$926
$971
$787
$688
$648
$639
$660
$658
$748
$729
$657
$642
$499
$435
Emery Towers
$599,489
Avg. Price
Past 12 months
Past 12 months
$969,750
$732,556
$772,906
$731,333
$793,000
$707,000
$868,429
$824,857
$722,101
$1,375,000
$698,087
$583,778
$595,454
$466,917
$616,000
$750,667
$625,143
$675,500
$551,606
$595,467
$478,655
$380,875
Emery Towers
$682,500
Median Price
Past 12 months
Past 12 months
$773,750
$705,000
$741,500
$732,500
$850,000
$675,000
$705,000
$660,000
$728,000
$1,212,500
$589,000
$554,000
$599,000
$505,000
$600,000
$882,000
$623,000
$649,000
$515,000
$599,000
$445,000
$352,500
Emery Towers
N/A
Avg. Price / ft2
Past 12 months
Past 12 months
-
-
-
$844
-
-
-
-
-
-
$816
-
-
$539
$704
-
-
-
$685
-
-
-
Emery Towers
N/A
Avg. Price
Past 12 months
Past 12 months
-
$465,000
$456,300
$540,000
-
-
-
$555,000
-
-
$436,250
-
-
$297,000
$285,000
-
-
-
$409,430
$324,500
-
-
Emery Towers
N/A
Median Price
Past 12 months
Past 12 months
-
$465,000
$456,300
$540,000
-
-
-
$555,000
-
-
$436,250
-
-
$297,000
$285,000
-
-
-
$409,430
$324,500
-
-
Emery Towers
$164
Avg. Price / ft2
Past 12 months
Past 12 months
$909
$852
$888
$955
$771
$811
$1,079
$712
$946
-
$750
$703
$650
$664
$620
$588
$733
$739
$641
$651
$504
$428
Emery Towers
$357,978
Avg. Price
Past 12 months
Past 12 months
$736,250
$703,600
$697,045
$760,750
$617,000
$707,000
$867,800
$623,333
$684,844
$625,000
$574,804
$557,500
$501,523
$551,875
$535,000
$485,000
$587,200
$575,500
$539,172
$531,429
$374,560
$346,000
Emery Towers
$357,978
Median Price
Past 12 months
Past 12 months
$730,000
$705,000
$730,000
$732,500
$617,000
$675,000
$705,000
$610,000
$610,000
$625,000
$579,000
$547,000
$478,045
$548,750
$535,000
$485,000
$568,000
$572,500
$520,000
$460,000
$392,870
$345,000
Emery Towers
$862
Avg. Price / ft2
Past 12 months
Past 12 months
$884
$842
$890
$847
$905
-
$1,035
-
$897
$775
$861
$657
$646
-
$677
$693
$779
$716
$738
$634
$492
$481
Emery Towers
$841,000
Avg. Price
Past 12 months
Past 12 months
$943,333
$1,072,500
$890,000
$805,000
$881,000
-
$1,345,000
$1,116,333
$852,500
$775,000
$1,044,750
$636,333
$670,600
-
$862,500
$883,500
$720,000
$800,500
$923,000
$760,500
$582,749
$625,000
Emery Towers
$841,000
Median Price
Past 12 months
Past 12 months
$880,000
$1,072,500
$890,000
$805,000
$881,000
-
$1,345,000
$1,224,500
$852,500
$775,000
$1,102,500
$660,000
$599,000
-
$862,500
$883,500
$720,000
$781,500
$923,000
$777,000
$507,999
$625,000
Emery Towers
N/A
Avg. Price / ft2
Past 12 months
Past 12 months
-
-
$923
-
-
-
-
-
-
$1,167
-
-
-
-
-
-
-
-
-
-
-
-
Emery Towers
N/A
Avg. Price
Past 12 months
Past 12 months
-
-
$1,200,000
-
-
-
-
-
-
$2,050,000
-
-
-
-
-
-
-
-
-
-
-
-
Emery Towers
N/A
Median Price
Past 12 months
Past 12 months
-
-
$1,200,000
-
-
-
-
-
-
$2,050,000
-
-
-
-
-
-
-
-
-
-
-
-
Emery Towers
N/A
Avg. Price / ft2
Past 12 months
Past 12 months
$1,225
-
-
-
-
-
-
-
-
-
-
-
-
-
-
-
-
-
-
-
-
-
Emery Towers
N/A
Avg. Price
Past 12 months
Past 12 months
$2,450,000
-
-
-
-
-
-
-
-
-
-
-
-
-
-
-
-
-
-
-
-
-
Emery Towers
N/A
Median Price
Past 12 months
Past 12 months
$2,450,000
-
-
-
-
-
-
-
-
-
-
-
-
-
-
-
-
-
-
-
-
-
Emery Towers
N/A
Avg. Price / ft2
Past 12 months
Past 12 months
-
-
-
-
-
-
-
-
-
-
-
-
-
-
-
-
-
-
-
-
-
-
Emery Towers
N/A
Avg. Price
Past 12 months
Past 12 months
-
-
-
-
-
-
-
-
-
-
-
-
-
-
-
-
-
-
-
-
-
-
Emery Towers
N/A
Median Price
Past 12 months
Past 12 months
-
-
-
-
-
-
-
-
-
-
-
-
-
-
-
-
-
-
-
-
-
-
Sherman Tower East
$1,252
Avg. Price / ft2
Past 12 months
Past 12 months
$918
$924
$1,059
$942
$889
$1,181
$943
$988
$1,013
$952
$917
$733
$784
$774
$781
$770
$815
$784
$730
$774
$514
$407
Sherman Tower East
$1,009,286
Avg. Price
Past 12 months
Past 12 months
$728,000
$637,375
$1,044,875
$666,000
$835,625
$1,131,786
$592,800
$986,179
$1,073,150
$931,250
$899,850
$617,923
$755,357
$881,500
$675,000
$693,917
$564,000
$622,596
$598,000
$471,778
$477,000
$323,278
Sherman Tower East
$935,000
Median Price
Past 12 months
Past 12 months
$635,000
$615,000
$787,500
$540,000
$712,500
$875,000
$440,000
$812,500
$867,500
$471,250
$712,500
$600,000
$585,000
$688,500
$555,000
$628,500
$550,000
$599,000
$571,500
$345,500
$449,000
$227,000
Sherman Tower East
N/A
Avg. Price / ft2
Past 12 months
Past 12 months
$1,009
$900
$1,002
$946
$858
-
$894
$911
$891
$888
$760
$667
$664
$598
$709
$734
$770
$792
$690
-
-
$415
Sherman Tower East
$390,000
Avg. Price
Past 12 months
Past 12 months
$555,000
$533,900
$499,500
$485,500
$567,500
$410,000
$428,333
$445,000
$505,000
$408,750
$398,000
$348,000
$387,500
$299,000
$390,000
$369,500
$390,833
$397,000
$345,000
$264,625
$280,000
$216,625
Sherman Tower East
$390,000
Median Price
Past 12 months
Past 12 months
$555,000
$475,000
$499,500
$493,500
$567,500
$410,000
$440,000
$435,000
$505,000
$408,750
$398,000
$315,500
$387,500
$299,000
$390,000
$369,500
$405,000
$397,000
$345,000
$256,500
$280,000
$219,750
Sherman Tower East
N/A
Avg. Price / ft2
Past 12 months
Past 12 months
$977
$943
$906
$928
$841
$1,019
$1,041
$896
$860
$853
$865
$779
$717
$735
$744
$719
$849
$732
$755
$729
$514
$398
Sherman Tower East
$817,500
Avg. Price
Past 12 months
Past 12 months
$667,500
$711,286
$770,000
$835,000
$745,000
$874,167
$989,000
$703,300
$685,500
$647,500
$732,900
$648,750
$578,333
$688,500
$670,000
$628,500
$745,700
$590,250
$565,750
$484,167
$435,091
$288,875
Sherman Tower East
$817,500
Median Price
Past 12 months
Past 12 months
$667,500
$670,000
$750,000
$835,000
$700,000
$875,000
$989,000
$755,000
$703,500
$647,500
$775,000
$647,500
$585,000
$688,500
$670,000
$628,500
$730,000
$599,000
$576,000
$492,500
$449,000
$286,250
Sherman Tower East
$1,252
Avg. Price / ft2
Past 12 months
Past 12 months
$767
-
$1,347
$955
$1,141
$1,256
-
$1,038
$1,099
$1,033
$1,074
$808
$1,106
-
$962
$858
-
$930
$687
$865
-
-
Sherman Tower East
$1,260,000
Avg. Price
Past 12 months
Past 12 months
$875,000
-
$1,683,333
$1,050,000
$1,825,000
$1,695,000
-
$1,502,500
$1,333,333
$1,395,000
$1,450,000
$975,000
$1,327,500
-
$1,250,000
$1,083,750
-
$993,750
$768,333
$867,500
-
$887,500
Sherman Tower East
$1,365,000
Median Price
Past 12 months
Past 12 months
$875,000
-
$1,400,000
$1,050,000
$1,825,000
$1,695,000
-
$1,582,500
$1,460,000
$1,395,000
$1,450,000
$975,000
$1,327,500
-
$1,250,000
$1,083,750
-
$993,750
$615,000
$867,500
-
$887,500
Sherman Tower East
N/A
Avg. Price / ft2
Past 12 months
Past 12 months
-
-
-
-
-
$1,591
-
$1,389
$1,419
-
$1,286
-
-
$1,028
-
-
-
-
-
-
-
-
Sherman Tower East
N/A
Avg. Price
Past 12 months
Past 12 months
-
-
-
-
-
$2,785,000
-
$2,500,000
$2,979,500
-
$2,700,000
$1,400,000
$1,450,000
$1,850,000
-
-
-
-
-
-
$1,135,000
-
Sherman Tower East
N/A
Median Price
Past 12 months
Past 12 months
-
-
-
-
-
$2,785,000
-
$2,500,000
$2,979,500
-
$2,700,000
$1,400,000
$1,450,000
$1,850,000
-
-
-
-
-
-
$1,135,000
-
Sherman Tower East
N/A
Avg. Price / ft2
Past 12 months
Past 12 months
-
-
-
-
-
-
-
-
-
-
-
-
-
-
-
-
-
-
-
-
-
-
Sherman Tower East
N/A
Avg. Price
Past 12 months
Past 12 months
-
-
-
-
-
-
-
-
-
-
-
-
-
-
-
-
-
-
-
-
-
-
Sherman Tower East
N/A
Median Price
Past 12 months
Past 12 months
-
-
-
-
-
-
-
-
-
-
-
-
-
-
-
-
-
-
-
-
-
-
Sherman Tower East
N/A
Avg. Price / ft2
Past 12 months
Past 12 months
-
-
-
-
-
-
-
-
-
$1,193
-
-
-
-
-
-
-
-
-
-
-
-
Sherman Tower East
N/A
Avg. Price
Past 12 months
Past 12 months
-
-
-
-
-
-
-
-
-
$3,125,000
-
-
-
-
-
-
-
-
-
-
-
-
Sherman Tower East
N/A
Median Price
Past 12 months
Past 12 months
-
-
-
-
-
-
-
-
-
$3,125,000
-
-
-
-
-
-
-
-
-
-
-
-
Newport East
$1,085
Avg. Price / ft2
Past 12 months
Past 12 months
$994
$864
$1,094
$1,027
$966
$1,031
$1,054
$947
$1,051
$875
$865
$834
$660
$683
$633
$778
$850
$766
$717
$696
$720
$464
Newport East
$1,173,167
Avg. Price
Past 12 months
Past 12 months
$1,183,558
$850,500
$1,065,840
$912,371
$1,040,000
$842,475
$1,053,465
$983,239
$1,028,282
$786,523
$789,343
$917,915
$633,411
$615,169
$610,000
$1,096,622
$652,778
$593,449
$662,979
$645,600
$737,972
$489,223
Newport East
$1,050,000
Median Price
Past 12 months
Past 12 months
$725,000
$885,000
$890,000
$857,500
$860,000
$754,352
$790,000
$897,500
$809,509
$599,000
$485,000
$857,000
$626,250
$470,000
$610,000
$1,009,124
$650,000
$557,500
$670,931
$586,250
$787,500
$460,000
Newport East
N/A
Avg. Price / ft2
Past 12 months
Past 12 months
$676
-
-
$975
$908
$1,001
$902
-
$1,019
$775
$721
$645
$630
$647
-
-
$898
$726
$764
$700
$536
$400
Newport East
$532,000
Avg. Price
Past 12 months
Past 12 months
$442,342
$565,000
-
$507,000
$445,000
$555,200
$556,106
$515,000
$511,500
$465,000
$382,950
$354,900
$364,630
$402,246
-
-
$452,500
$426,227
$566,334
$438,667
$352,032
$331,682
Newport East
$532,000
Median Price
Past 12 months
Past 12 months
$427,025
$565,000
-
$507,000
$445,000
$505,000
$585,000
$515,000
$513,500
$480,000
$420,000
$354,900
$367,950
$400,000
-
-
$452,500
$420,000
$563,103
$385,000
$342,500
$255,803
Newport East
N/A
Avg. Price / ft2
Past 12 months
Past 12 months
-
$864
$865
$960
$971
$1,003
$1,042
$878
$1,014
$853
$1,063
$766
$699
$631
$728
-
$780
$894
$703
-
-
$485
Newport East
$840,000
Avg. Price
Past 12 months
Past 12 months
$560,000
$812,500
$782,500
$746,725
$767,500
$815,926
$808,504
$712,803
$789,565
$644,246
$542,500
$604,652
$527,300
$492,228
$655,000
$559,000
$651,667
$645,000
$571,227
$570,833
$327,000
$456,000
Newport East
$840,000
Median Price
Past 12 months
Past 12 months
$560,000
$885,000
$782,500
$773,888
$767,500
$792,500
$790,000
$650,000
$809,509
$599,000
$455,000
$610,202
$600,000
$485,000
$655,000
$559,000
$652,500
$617,500
$599,000
$572,500
$327,000
$475,000
Newport East
N/A
Avg. Price / ft2
Past 12 months
Past 12 months
$939
-
$1,481
$1,188
$1,014
$1,108
$1,302
$1,060
$1,276
$1,012
$577
$1,099
$639
$800
$538
$835
$1,010
$719
$711
$692
$697
-
Newport East
$1,292,500
Avg. Price
Past 12 months
Past 12 months
$1,166,667
$1,250,000
$1,555,000
$1,446,350
$1,420,000
$1,356,667
$1,620,000
$1,100,181
$1,363,333
$1,345,173
$1,033,529
$1,080,750
$845,758
$1,014,375
$565,000
$981,618
$1,060,000
$870,975
$827,419
$969,000
$828,067
$653,702
Newport East
$1,292,500
Median Price
Past 12 months
Past 12 months
$1,325,000
$1,250,000
$1,555,000
$1,542,500
$1,420,000
$1,300,000
$1,620,000
$1,103,500
$1,340,000
$1,280,000
$1,195,000
$1,087,000
$861,800
$1,102,500
$565,000
$937,500
$1,060,000
$907,500
$848,000
$969,000
$850,000
$690,000
Newport East
N/A
Avg. Price / ft2
Past 12 months
Past 12 months
-
-
$1,164
-
-
-
-
-
-
-
$1,389
$1,029
-
-
-
$687
-
-
-
-
-
-
Newport East
N/A
Avg. Price
Past 12 months
Past 12 months
-
-
$1,629,200
-
$1,800,000
-
$1,749,667
$1,930,000
-
-
$2,263,333
$1,515,000
$965,000
$1,180,000
-
$1,153,041
-
-
-
$999,500
$874,500
-
Newport East
N/A
Median Price
Past 12 months
Past 12 months
-
-
$1,629,200
-
$1,800,000
-
$1,750,000
$1,930,000
-
-
$2,263,333
$1,565,000
$965,000
$1,180,000
-
$1,150,000
-
-
-
$999,500
$874,500
-
Newport East
N/A
Avg. Price / ft2
Past 12 months
Past 12 months
$1,208
-
-
-
-
-
-
-
$1,000
-
-
-
-
-
-
$939
-
-
-
-
$927
-
Newport East
N/A
Avg. Price
Past 12 months
Past 12 months
$2,632,500
-
-
-
-
-
-
-
$4,000,000
-
-
-
-
-
-
$1,925,000
-
-
-
-
$1,900,000
-
Newport East
N/A
Median Price
Past 12 months
Past 12 months
$2,632,500
-
-
-
-
-
-
-
$4,000,000
-
-
-
-
-
-
$1,925,000
-
-
-
-
$1,900,000
-
Newport East
$1,085
Avg. Price / ft2
Past 12 months
Past 12 months
-
-
-
-
-
-
-
-
-
-
-
-
-
-
-
-
-
-
-
-
-
-
Newport East
$2,550,000
Avg. Price
Past 12 months
Past 12 months
-
-
-
-
-
-
-
-
-
-
-
-
-
-
-
-
-
-
-
-
-
-
Newport East
$2,550,000
Median Price
Past 12 months
Past 12 months
-
-
-
-
-
-
-
-
-
-
-
-
-
-
-
-
-
-
-
-
-
-
East River House
$864
Avg. Price / ft2
Past 12 months
Past 12 months
$804
$768
$861
$833
$770
$860
$896
$1,020
$972
$815
$769
$821
$632
$668
$685
$584
$650
$800
$737
$661
$564
-
East River House
$949,423
Avg. Price
Past 12 months
Past 12 months
$903,750
$623,250
$683,333
$868,875
$617,500
$645,000
$701,000
$1,488,563
$1,172,300
$861,250
$662,778
$924,000
$684,250
$734,500
$650,875
$753,571
$1,251,700
$1,075,075
$977,429
$541,269
$641,250
$720,000
East River House
$880,000
Median Price
Past 12 months
Past 12 months
$860,000
$560,000
$620,000
$701,250
$617,500
$645,000
$635,000
$865,000
$1,212,500
$567,500
$487,500
$825,000
$449,500
$564,000
$697,500
$610,000
$1,700,000
$914,950
$999,000
$510,000
$675,000
$590,000
East River House
N/A
Avg. Price / ft2
Past 12 months
Past 12 months
-
$746
-
-
$714
-
$984
-
-
$920
$708
$603
-
$591
$570
-
-
$683
-
$578
-
-
East River House
N/A
Avg. Price
Past 12 months
Past 12 months
-
$435,000
-
-
$450,000
-
$615,000
-
-
$567,500
$425,000
$380,000
-
$372,500
$359,000
-
-
$418,750
-
$348,000
-
-
East River House
N/A
Median Price
Past 12 months
Past 12 months
-
$437,500
-
-
$450,000
-
$615,000
-
-
$567,500
$425,000
$380,000
-
$372,500
$359,000
-
-
$418,750
-
$345,000
-
-
East River House
$797
Avg. Price / ft2
Past 12 months
Past 12 months
$705
$747
$856
$731
$826
$860
$930
$837
$840
$763
$682
$732
$571
$579
$592
$555
$650
$876
-
$714
$513
-
East River House
$658,000
Avg. Price
Past 12 months
Past 12 months
$670,000
$560,000
$597,500
$570,000
$785,000
$645,000
$705,000
$593,333
$525,000
$522,500
$484,000
$695,000
$412,250
$477,750
$444,000
$380,000
$479,250
$875,000
-
$667,875
$385,000
-
East River House
$550,000
Median Price
Past 12 months
Past 12 months
$670,000
$560,000
$597,500
$567,500
$785,000
$645,000
$635,000
$585,000
$525,000
$522,500
$487,500
$695,000
$419,500
$477,750
$444,000
$380,000
$479,250
$875,000
-
$614,500
$385,000
-
East River House
$879
Avg. Price / ft2
Past 12 months
Past 12 months
$838
$796
$867
$855
-
-
$705
$984
$946
-
$906
$845
$717
$683
$745
$642
-
$760
$737
$705
$615
-
East River House
$968,750
Avg. Price
Past 12 months
Past 12 months
$981,667
$843,125
$855,000
$1,001,917
-
-
$775,000
$1,026,167
$1,195,500
$757,500
$1,040,000
$835,000
$808,333
$804,500
$792,000
$741,250
-
$820,600
$865,333
$656,250
$726,667
$525,000
East River House
$923,750
Median Price
Past 12 months
Past 12 months
$1,050,000
$747,500
$855,000
$1,029,500
-
-
$775,000
$890,000
$1,212,500
$757,500
$1,165,000
$835,000
$950,000
$804,500
$715,000
$715,000
-
$789,200
$937,000
$670,000
$790,000
$522,500
East River House
$929
Avg. Price / ft2
Past 12 months
Past 12 months
-
-
-
$1,113
-
-
-
$1,460
$1,129
-
-
-
$560
-
-
-
-
$960
-
-
-
-
East River House
$1,620,000
Avg. Price
Past 12 months
Past 12 months
-
-
-
$1,725,000
-
-
-
$3,650,000
$1,750,000
$2,230,000
-
-
$1,400,000
-
-
$1,550,000
$1,766,667
$1,757,750
$1,650,000
-
-
$1,500,000
East River House
$1,620,000
Median Price
Past 12 months
Past 12 months
-
-
-
$1,725,000
-
-
-
$3,650,000
$1,750,000
$2,230,000
-
-
$1,400,000
-
-
$1,550,000
$1,750,000
$1,575,500
$1,650,000
-
-
$1,500,000
East River House
N/A
Avg. Price / ft2
Past 12 months
Past 12 months
-
-
-
-
-
-
-
-
-
-
-
$1,103
-
$891
-
-
-
-
-
-
-
-
East River House
N/A
Avg. Price
Past 12 months
Past 12 months
-
-
-
-
-
-
-
$3,400,000
-
-
-
$1,875,000
-
$1,470,000
-
-
-
-
-
-
-
-
East River House
N/A
Median Price
Past 12 months
Past 12 months
-
-
-
-
-
-
-
$3,400,000
-
-
-
$1,875,000
-
$1,470,000
-
-
-
-
-
-
-
-
East River House
N/A
Avg. Price / ft2
Past 12 months
Past 12 months
-
-
-
-
-
-
-
-
-
-
-
-
-
-
-
-
-
-
-
-
-
-
East River House
N/A
Avg. Price
Past 12 months
Past 12 months
-
-
-
-
-
-
-
-
-
-
-
-
-
-
-
-
-
-
-
-
-
-
East River House
N/A
Median Price
Past 12 months
Past 12 months
-
-
-
-
-
-
-
-
-
-
-
-
-
-
-
-
-
-
-
-
-
-
The Amherst
$1,032
Avg. Price / ft2
Past 12 months
Past 12 months
$947
$871
$1,015
$968
$939
$1,012
$1,035
$947
$889
$883
$932
$839
$726
$733
$731
$746
$834
$766
$666
$879
$690
$598
The Amherst
$1,033,619
Avg. Price
Past 12 months
Past 12 months
$1,115,255
$1,102,286
$860,250
$907,364
$859,250
$859,750
$1,195,545
$954,244
$958,500
$1,015,242
$819,769
$896,775
$983,750
$780,200
$926,625
$691,778
$906,700
$773,143
$533,000
$854,682
$594,411
$582,846
The Amherst
$934,250
Median Price
Past 12 months
Past 12 months
$910,000
$1,217,000
$899,000
$915,000
$794,500
$734,500
$945,000
$904,500
$937,500
$919,500
$840,000
$840,000
$715,000
$716,000
$829,874
$700,000
$810,000
$765,000
$545,000
$940,000
$557,500
$535,000
The Amherst
$890
Avg. Price / ft2
Past 12 months
Past 12 months
-
-
$965
$745
-
-
$920
-
-
$786
-
-
$729
-
-
-
-
$691
$660
$661
-
$500
The Amherst
$445,000
Avg. Price
Past 12 months
Past 12 months
-
-
$547,500
$483,000
-
-
$460,000
$439,000
$460,000
$470,333
-
-
$437,500
-
-
-
-
$380,000
$362,000
$358,000
-
$275,000
The Amherst
$445,000
Median Price
Past 12 months
Past 12 months
-
-
$547,500
$458,000
-
-
$460,000
$439,000
$460,000
$465,000
-
-
$437,500
-
-
-
-
$380,000
$362,000
$358,000
-
$275,000
The Amherst
N/A
Avg. Price / ft2
Past 12 months
Past 12 months
$942
$871
$1,005
$972
$942
$916
$1,118
$987
-
$901
$933
$832
$726
$700
-
$696
$807
$794
$678
-
$720
$536
The Amherst
N/A
Avg. Price
Past 12 months
Past 12 months
$693,750
$788,000
$859,750
$921,333
$849,000
$664,667
$913,667
$937,950
$922,375
$694,300
$789,000
$808,450
$690,000
$581,500
-
$410,333
$776,250
$715,000
$551,500
$425,000
$494,585
$374,000
The Amherst
N/A
Median Price
Past 12 months
Past 12 months
$655,000
$850,000
$917,500
$939,000
$699,000
$559,000
$899,000
$937,950
$918,750
$620,000
$832,500
$803,000
$690,000
$581,500
-
$400,000
$782,500
$715,000
$551,500
$425,000
$499,000
$347,000
The Amherst
$1,021
Avg. Price / ft2
Past 12 months
Past 12 months
$948
-
$1,060
$989
$937
$1,204
$962
$906
$889
$936
$930
$850
$724
$749
$731
$766
$860
$781
-
$914
$678
$638
The Amherst
$1,029,269
Avg. Price
Past 12 months
Past 12 months
$1,069,633
-
$1,174,000
$1,021,250
$890,000
$1,445,000
$1,102,000
$874,250
$1,280,000
$1,157,250
$1,050,750
$1,014,542
$697,500
$723,000
$926,625
$832,500
$952,400
$888,000
$706,000
$1,002,300
$765,643
$687,500
The Amherst
$935,000
Median Price
Past 12 months
Past 12 months
$1,061,500
-
$1,174,000
$930,000
$890,000
$1,445,000
$945,000
$873,500
$1,280,000
$1,212,500
$1,070,000
$843,500
$697,500
$723,000
$829,874
$839,500
$840,000
$899,000
$706,000
$995,000
$777,000
$741,250
The Amherst
$1,191
Avg. Price / ft2
Past 12 months
Past 12 months
-
-
-
$1,122
-
-
-
-
-
-
-
-
-
-
-
-
-
-
-
$924
-
-
The Amherst
$1,995,000
Avg. Price
Past 12 months
Past 12 months
-
$1,378,333
-
$1,683,000
-
-
$1,947,500
$1,380,000
-
$2,030,000
-
-
$1,690,000
$1,292,000
-
-
-
-
-
$1,525,000
$850,000
$680,000
The Amherst
$1,995,000
Median Price
Past 12 months
Past 12 months
-
$1,395,000
-
$1,683,000
-
-
$1,947,500
$1,380,000
-
$2,030,000
-
-
$1,690,000
$1,292,000
-
-
-
-
-
$1,525,000
$850,000
$680,000
The Amherst
N/A
Avg. Price / ft2
Past 12 months
Past 12 months
-
-
-
-
-
-
$1,133
-
-
-
-
-
-
-
-
-
-
-
-
-
-
-
The Amherst
N/A
Avg. Price
Past 12 months
Past 12 months
$3,075,000
-
-
-
-
-
$2,492,500
-
-
-
-
-
-
-
-
-
-
-
-
-
-
-
The Amherst
N/A
Median Price
Past 12 months
Past 12 months
$3,075,000
-
-
-
-
-
$2,492,500
-
-
-
-
-
-
-
-
-
-
-
-
-
-
-
The Amherst
N/A
Avg. Price / ft2
Past 12 months
Past 12 months
-
-
-
-
-
-
-
-
-
-
-
-
-
-
-
-
-
-
-
-
-
-
The Amherst
N/A
Avg. Price
Past 12 months
Past 12 months
-
-
-
-
-
-
-
-
-
-
-
-
-
-
-
-
-
-
-
-
-
-
The Amherst
N/A
Median Price
Past 12 months
Past 12 months
-
-
-
-
-
-
-
-
-
-
-
-
-
-
-
-
-
-
-
-
-
-
Morad Diplomat
$1,028
Avg. Price / ft2
Past 12 months
Past 12 months
$885
$1,019
$941
$895
$929
$934
$981
$1,034
$953
$910
$664
$758
$651
$745
$743
$640
$802
$783
$754
$645
$559
$451
Morad Diplomat
$1,017,500
Avg. Price
Past 12 months
Past 12 months
$873,500
$739,714
$824,828
$798,500
$1,007,667
$955,303
$1,037,500
$1,085,479
$994,889
$673,817
$576,850
$834,500
$578,333
$795,000
$785,000
$658,111
$696,250
$702,143
$614,833
$622,467
$538,089
$397,871
Morad Diplomat
$855,000
Median Price
Past 12 months
Past 12 months
$799,500
$750,000
$842,500
$707,000
$750,000
$810,000
$1,037,500
$894,000
$728,923
$674,500
$575,700
$691,500
$520,000
$795,500
$785,000
$563,000
$663,500
$642,500
$625,000
$563,750
$417,500
$401,435
Morad Diplomat
N/A
Avg. Price / ft2
Past 12 months
Past 12 months
-
-
-
-
-
-
-
-
-
$882
-
-
-
-
-
-
$782
$773
$915
$564
-
-
Morad Diplomat
$515,000
Avg. Price
Past 12 months
Past 12 months
$515,000
-
-
-
-
-
-
-
$320,000
$458,333
-
-
-
-
-
-
$430,000
$425,000
$549,000
$310,000
$353,886
-
Morad Diplomat
$515,000
Median Price
Past 12 months
Past 12 months
$515,000
-
-
-
-
-
-
-
$320,000
$485,000
-
-
-
-
-
-
$430,000
$425,000
$549,000
$310,000
$353,886
-
Morad Diplomat
$894
Avg. Price / ft2
Past 12 months
Past 12 months
$850
$1,019
$941
$852
$833
$866
$928
$993
$960
$920
$679
$704
$631
-
$718
$614
$809
$765
$726
$614
$534
$451
Morad Diplomat
$785,000
Avg. Price
Past 12 months
Past 12 months
$665,000
$739,714
$824,828
$623,000
$692,500
$720,745
$835,000
$859,800
$759,598
$724,750
$575,700
$589,800
$499,000
$520,000
$610,000
$470,600
$675,600
$608,571
$635,000
$548,825
$369,600
$401,853
Morad Diplomat
$835,000
Median Price
Past 12 months
Past 12 months
$675,000
$750,000
$842,500
$669,000
$692,500
$760,000
$835,000
$845,000
$703,173
$707,000
$575,700
$599,000
$510,000
$520,000
$610,000
$455,000
$675,000
$625,000
$635,000
$539,750
$355,000
$412,870
Morad Diplomat
$1,142
Avg. Price / ft2
Past 12 months
Past 12 months
$954
-
-
$981
-
$1,025
$1,033
$1,117
$949
-
$648
$806
$750
$745
$768
$661
$806
$799
$649
$763
$584
-
Morad Diplomat
$1,485,000
Avg. Price
Past 12 months
Past 12 months
$1,119,500
-
-
$1,325,000
-
$1,248,500
$1,240,000
$1,316,009
$1,073,875
$1,116,535
$578,000
$920,000
$975,000
$886,667
$960,000
$848,333
$881,000
$857,500
$600,000
$923,000
$794,750
$370,000
Morad Diplomat
$1,485,000
Median Price
Past 12 months
Past 12 months
$1,064,500
-
-
$1,325,000
-
$1,360,000
$1,240,000
$1,319,652
$983,250
$1,116,535
$578,000
$880,000
$975,000
$950,000
$960,000
$815,000
$881,000
$897,500
$600,000
$840,000
$792,500
$370,000
Morad Diplomat
$1,094
Avg. Price / ft2
Past 12 months
Past 12 months
-
-
-
-
$1,024
-
-
-
-
-
-
$796
-
-
-
$683
-
-
-
-
-
-
Morad Diplomat
$1,750,000
Avg. Price
Past 12 months
Past 12 months
-
-
-
-
$1,638,000
-
-
$1,522,284
$2,295,000
-
-
$1,232,500
-
-
-
$1,025,000
-
-
-
-
-
-
Morad Diplomat
$1,750,000
Median Price
Past 12 months
Past 12 months
-
-
-
-
$1,638,000
-
-
$1,522,284
$2,295,000
-
-
$1,232,500
-
-
-
$1,025,000
-
-
-
-
-
-
Morad Diplomat
N/A
Avg. Price / ft2
Past 12 months
Past 12 months
-
-
-
-
-
-
-
-
-
-
-
-
-
-
-
-
-
-
-
-
-
-
Morad Diplomat
N/A
Avg. Price
Past 12 months
Past 12 months
-
-
-
-
-
-
-
-
-
-
-
-
-
-
-
-
-
-
-
-
-
-
Morad Diplomat
N/A
Median Price
Past 12 months
Past 12 months
-
-
-
-
-
-
-
-
-
-
-
-
-
-
-
-
-
-
-
-
-
-
Morad Diplomat
N/A
Avg. Price / ft2
Past 12 months
Past 12 months
-
-
-
-
-
-
-
-
-
-
-
-
-
-
-
-
-
-
-
-
-
-
Morad Diplomat
N/A
Avg. Price
Past 12 months
Past 12 months
-
-
-
-
-
-
-
-
-
-
-
-
-
-
-
-
-
-
-
-
-
-
Morad Diplomat
N/A
Median Price
Past 12 months
Past 12 months
-
-
-
-
-
-
-
-
-
-
-
-
-
-
-
-
-
-
-
-
-
-
Asten House
$1,016
Avg. Price / ft2
Past 12 months
Past 12 months
$1,085
$888
-
$1,073
-
-
$1,203
$1,173
$1,142
$1,132
-
$906
$815
$815
$760
$660
-
$806
$815
$687
$660
-
Asten House
$1,279,167
Avg. Price
Past 12 months
Past 12 months
$1,626,000
$963,000
$1,450,000
$1,412,250
-
-
$1,387,083
$1,369,000
$2,059,500
$1,344,286
$1,912,500
$1,418,333
$975,167
$1,026,250
$782,500
$760,000
$980,000
$926,086
$815,000
$791,500
$720,417
$736,250
Asten House
$1,300,000
Median Price
Past 12 months
Past 12 months
$1,360,000
$911,000
$1,450,000
$1,237,500
-
-
$1,325,000
$1,395,000
$1,355,000
$1,275,000
$1,912,500
$1,075,000
$1,050,000
$1,026,250
$775,000
$805,000
$980,000
$940,000
$815,000
$790,500
$725,000
$736,250
Asten House
N/A
Avg. Price / ft2
Past 12 months
Past 12 months
-
-
-
-
-
-
-
-
-
-
-
-
-
-
-
-
-
-
-
-
-
-
Asten House
N/A
Avg. Price
Past 12 months
Past 12 months
-
-
-
-
-
-
-
-
-
-
-
-
-
-
-
-
-
-
-
-
-
-
Asten House
N/A
Median Price
Past 12 months
Past 12 months
-
-
-
-
-
-
-
-
-
-
-
-
-
-
-
-
-
-
-
-
-
-
Asten House
N/A
Avg. Price / ft2
Past 12 months
Past 12 months
-
-
-
-
-
-
-
-
-
-
-
-
-
$815
-
-
-
$875
-
-
$725
-
Asten House
N/A
Avg. Price
Past 12 months
Past 12 months
-
$745,000
-
$760,000
-
-
-
-
-
-
-
-
-
$815,000
-
$650,000
-
$875,000
-
$830,000
$725,000
-
Asten House
N/A
Median Price
Past 12 months
Past 12 months
-
$745,000
-
$760,000
-
-
-
-
-
-
-
-
-
$815,000
-
$650,000
-
$875,000
-
$830,000
$725,000
-
Asten House
$1,016
Avg. Price / ft2
Past 12 months
Past 12 months
$1,094
$888
-
$1,063
-
-
$1,203
$1,173
$1,093
$1,132
-
$873
$815
-
$760
$660
-
$795
$815
$687
$639
-
Asten House
$1,279,167
Avg. Price
Past 12 months
Past 12 months
$1,261,667
$1,035,667
$1,450,000
$1,251,333
-
-
$1,387,083
$1,369,000
$1,130,000
$1,235,000
$1,075,000
$1,002,000
$975,167
-
$782,500
$815,000
$980,000
$934,600
$815,000
$778,667
$719,500
$736,250
Asten House
$1,300,000
Median Price
Past 12 months
Past 12 months
$1,325,000
$957,000
$1,450,000
$1,237,500
-
-
$1,325,000
$1,395,000
$1,095,000
$1,262,500
$1,075,000
$1,075,000
$1,050,000
-
$775,000
$815,000
$980,000
$957,500
$815,000
$751,000
$725,000
$736,250
Asten House
N/A
Avg. Price / ft2
Past 12 months
Past 12 months
$1,068
-
-
$1,122
-
-
-
-
-
-
-
-
-
-
-
-
-
-
-
-
-
-
Asten House
N/A
Avg. Price
Past 12 months
Past 12 months
$2,172,500
-
-
$3,029,998
-
-
-
-
$3,807,500
$2,000,000
-
-
-
$1,237,500
-
-
-
-
-
-
-
-
Asten House
N/A
Median Price
Past 12 months
Past 12 months
$2,172,500
-
-
$3,029,998
-
-
-
-
$3,807,500
$2,000,000
-
-
-
$1,237,500
-
-
-
-
-
-
-
-
Asten House
N/A
Avg. Price / ft2
Past 12 months
Past 12 months
-
-
-
-
-
-
-
-
$1,240
-
-
-
-
-
-
-
-
-
-
-
-
-
Asten House
N/A
Avg. Price
Past 12 months
Past 12 months
-
-
-
-
-
-
-
-
$3,100,000
-
$2,750,000
-
-
-
-
-
-
-
-
-
-
-
Asten House
N/A
Median Price
Past 12 months
Past 12 months
-
-
-
-
-
-
-
-
$3,100,000
-
$2,750,000
-
-
-
-
-
-
-
-
-
-
-
Asten House
N/A
Avg. Price / ft2
Past 12 months
Past 12 months
-
-
-
-
-
-
-
-
-
-
-
$972
-
-
-
-
-
-
-
-
-
-
Asten House
N/A
Avg. Price
Past 12 months
Past 12 months
-
-
-
-
-
-
-
-
-
-
-
$3,500,000
-
-
-
-
-
-
-
-
-
-
Asten House
N/A
Median Price
Past 12 months
Past 12 months
-
-
-
-
-
-
-
-
-
-
-
$3,500,000
-
-
-
-
-
-
-
-
-
-
308 East 79th Street
$913
Avg. Price / ft2
Past 12 months
Past 12 months
$815
$958
$995
$1,032
$815
$851
$768
$1,021
$993
$886
$807
$795
$631
$664
$758
$764
$848
$687
$813
$646
$551
$494
308 East 79th Street
$791,667
Avg. Price
Past 12 months
Past 12 months
$724,167
$1,001,716
$1,253,125
$1,301,875
$696,667
$711,250
$1,017,833
$1,165,311
$1,012,917
$908,448
$714,080
$873,920
$517,000
$711,056
$685,000
$998,000
$874,443
$576,015
$864,192
$488,478
$482,600
$394,629
308 East 79th Street
$775,000
Median Price
Past 12 months
Past 12 months
$687,500
$915,000
$1,117,500
$730,000
$700,000
$710,000
$742,500
$747,500
$791,250
$654,713
$610,400
$669,600
$510,000
$525,000
$582,500
$741,000
$775,000
$575,000
$538,324
$469,500
$478,000
$400,000
308 East 79th Street
N/A
Avg. Price / ft2
Past 12 months
Past 12 months
-
-
-
-
-
-
-
-
-
-
-
-
-
-
-
-
-
-
-
-
-
-
308 East 79th Street
N/A
Avg. Price
Past 12 months
Past 12 months
-
-
-
-
-
-
-
-
-
-
-
-
-
-
-
-
-
-
-
-
-
-
308 East 79th Street
N/A
Median Price
Past 12 months
Past 12 months
-
-
-
-
-
-
-
-
-
-
-
-
-
-
-
-
-
-
-
-
-
-
308 East 79th Street
$913
Avg. Price / ft2
Past 12 months
Past 12 months
$764
$986
$932
$863
$815
$851
$768
$881
$993
$815
$807
$698
$631
$641
$716
-
$856
$687
$712
$646
$544
$494
308 East 79th Street
$791,667
Avg. Price
Past 12 months
Past 12 months
$649,000
$798,000
$782,500
$712,000
$696,667
$711,250
$732,000
$737,081
$722,143
$651,138
$610,089
$610,700
$517,000
$520,000
$530,000
$602,500
$713,125
$576,015
$533,662
$488,478
$454,333
$394,629
308 East 79th Street
$775,000
Median Price
Past 12 months
Past 12 months
$625,000
$735,000
$772,500
$720,000
$700,000
$710,000
$735,000
$732,500
$732,500
$650,000
$600,000
$600,000
$510,000
$525,000
$475,000
$602,500
$751,250
$575,000
$533,662
$469,500
$478,000
$400,000
308 East 79th Street
N/A
Avg. Price / ft2
Past 12 months
Past 12 months
$917
-
$1,125
$1,289
-
-
-
-
-
-
-
$892
-
$800
$885
$650
$834
-
$1,017
-
$571
-
308 East 79th Street
N/A
Avg. Price
Past 12 months
Past 12 months
$1,100,000
$1,300,000
$1,397,500
$1,805,000
-
-
-
$1,350,000
$1,275,000
-
$1,650,000
$1,175,000
-
$959,500
$1,150,000
$812,000
$1,089,533
-
$1,525,252
-
$525,000
-
308 East 79th Street
N/A
Median Price
Past 12 months
Past 12 months
$1,100,000
$1,300,000
$1,397,500
$1,805,000
-
-
-
$1,350,000
$1,275,000
-
$1,650,000
$995,000
-
$959,500
$1,150,000
$812,000
$1,167,500
-
$1,525,252
-
$525,000
-
308 East 79th Street
N/A
Avg. Price / ft2
Past 12 months
Past 12 months
-
$875
$929
$1,326
-
-
-
$1,578
-
$1,101
-
-
-
-
-
$878
-
-
-
-
-
-
308 East 79th Street
N/A
Avg. Price
Past 12 months
Past 12 months
-
$1,400,000
$2,050,000
$2,525,000
-
-
$2,447,000
$3,550,000
$1,637,500
$2,195,000
-
$1,550,000
-
$1,800,000
-
$1,975,000
-
-
-
-
-
-
308 East 79th Street
N/A
Median Price
Past 12 months
Past 12 months
-
$1,400,000
$2,050,000
$2,525,000
-
-
$2,447,000
$3,550,000
$1,637,500
$2,195,000
-
$1,550,000
-
$1,800,000
-
$1,975,000
-
-
-
-
-
-
308 East 79th Street
N/A
Avg. Price / ft2
Past 12 months
Past 12 months
-
-
-
-
-
-
-
-
-
-
-
-
-
-
-
-
-
-
-
-
-
-
308 East 79th Street
N/A
Avg. Price
Past 12 months
Past 12 months
-
-
-
-
-
-
-
-
-
-
-
-
-
-
-
-
-
-
-
-
-
-
308 East 79th Street
N/A
Median Price
Past 12 months
Past 12 months
-
-
-
-
-
-
-
-
-
-
-
-
-
-
-
-
-
-
-
-
-
-
308 East 79th Street
N/A
Avg. Price / ft2
Past 12 months
Past 12 months
-
-
-
-
-
-
-
-
-
-
-
-
-
-
-
-
-
-
-
-
-
-
308 East 79th Street
N/A
Avg. Price
Past 12 months
Past 12 months
-
-
-
-
-
-
-
-
-
-
-
-
-
-
-
-
-
-
-
-
-
-
308 East 79th Street
N/A
Median Price
Past 12 months
Past 12 months
-
-
-
-
-
-
-
-
-
-
-
-
-
-
-
-
-
-
-
-
-
-