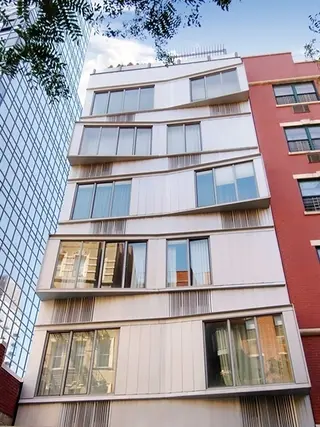
The Switch Building, 109 Norfolk Street: Price Comparison
between Delancey Street & Rivington Street Building Profile
The Switch Building
N/A
Avg. Price / ft2
Past 12 months
Past 12 months
2024
-
2023
-
2022
-
2021
-
2020
-
2019
$1,245
2018
-
2017
$1,414
2016
-
2015
-
2014
$1,452
2013
$1,349
2012
$1,013
2011
$968
2010
-
2009
-
2008
-
2007
$1,025
2006
-
2005
-
2004
-
2003
-
The Switch Building
N/A
Avg. Price
Past 12 months
Past 12 months
2024
-
2023
-
2022
-
2021
$2,160,000
2020
-
2019
$1,800,000
2018
-
2017
$2,045,000
2016
-
2015
-
2014
$2,100,000
2013
$1,950,000
2012
$1,465,000
2011
$1,400,000
2010
-
2009
-
2008
-
2007
$1,482,826
2006
-
2005
-
2004
-
2003
-
The Switch Building
N/A
Median Price / ft2
Past 12 months
Past 12 months
2024
-
2023
-
2022
-
2021
-
2020
-
2019
$1,245
2018
-
2017
$1,414
2016
-
2015
-
2014
$1,452
2013
$1,349
2012
$1,013
2011
$968
2010
-
2009
-
2008
-
2007
$1,021
2006
-
2005
-
2004
-
2003
-
The Switch Building
N/A
Median Price
Past 12 months
Past 12 months
2024
-
2023
-
2022
-
2021
$2,160,000
2020
-
2019
$1,800,000
2018
-
2017
$2,045,000
2016
-
2015
-
2014
$2,100,000
2013
$1,950,000
2012
$1,465,000
2011
$1,400,000
2010
-
2009
-
2008
-
2007
$1,476,462
2006
-
2005
-
2004
-
2003
-
The Switch Building
N/A
Avg. Price / ft2
Past 12 months
Past 12 months
2024
-
2023
-
2022
-
2021
-
2020
-
2019
-
2018
-
2017
-
2016
-
2015
-
2014
-
2013
-
2012
-
2011
-
2010
-
2009
-
2008
-
2007
-
2006
-
2005
-
2004
-
2003
-
The Switch Building
N/A
Avg. Price
Past 12 months
Past 12 months
2024
-
2023
-
2022
-
2021
-
2020
-
2019
-
2018
-
2017
-
2016
-
2015
-
2014
-
2013
-
2012
-
2011
-
2010
-
2009
-
2008
-
2007
-
2006
-
2005
-
2004
-
2003
-
The Switch Building
N/A
Median Price / ft2
Past 12 months
Past 12 months
2024
-
2023
-
2022
-
2021
-
2020
-
2019
-
2018
-
2017
-
2016
-
2015
-
2014
-
2013
-
2012
-
2011
-
2010
-
2009
-
2008
-
2007
-
2006
-
2005
-
2004
-
2003
-
The Switch Building
N/A
Median Price
Past 12 months
Past 12 months
2024
-
2023
-
2022
-
2021
-
2020
-
2019
-
2018
-
2017
-
2016
-
2015
-
2014
-
2013
-
2012
-
2011
-
2010
-
2009
-
2008
-
2007
-
2006
-
2005
-
2004
-
2003
-
The Switch Building
N/A
Avg. Price / ft2
Past 12 months
Past 12 months
2024
-
2023
-
2022
-
2021
-
2020
-
2019
$1,245
2018
-
2017
$1,414
2016
-
2015
-
2014
$1,452
2013
$1,349
2012
$1,013
2011
$968
2010
-
2009
-
2008
-
2007
$1,025
2006
-
2005
-
2004
-
2003
-
The Switch Building
N/A
Avg. Price
Past 12 months
Past 12 months
2024
-
2023
-
2022
-
2021
$2,160,000
2020
-
2019
$1,800,000
2018
-
2017
$2,045,000
2016
-
2015
-
2014
$2,100,000
2013
$1,950,000
2012
$1,465,000
2011
$1,400,000
2010
-
2009
-
2008
-
2007
$1,482,826
2006
-
2005
-
2004
-
2003
-
The Switch Building
N/A
Median Price / ft2
Past 12 months
Past 12 months
2024
-
2023
-
2022
-
2021
-
2020
-
2019
$1,245
2018
-
2017
$1,414
2016
-
2015
-
2014
$1,452
2013
$1,349
2012
$1,013
2011
$968
2010
-
2009
-
2008
-
2007
$1,021
2006
-
2005
-
2004
-
2003
-
The Switch Building
N/A
Median Price
Past 12 months
Past 12 months
2024
-
2023
-
2022
-
2021
$2,160,000
2020
-
2019
$1,800,000
2018
-
2017
$2,045,000
2016
-
2015
-
2014
$2,100,000
2013
$1,950,000
2012
$1,465,000
2011
$1,400,000
2010
-
2009
-
2008
-
2007
$1,476,462
2006
-
2005
-
2004
-
2003
-
The Switch Building
N/A
Avg. Price / ft2
Past 12 months
Past 12 months
2024
-
2023
-
2022
-
2021
-
2020
-
2019
-
2018
-
2017
-
2016
-
2015
-
2014
-
2013
-
2012
-
2011
-
2010
-
2009
-
2008
-
2007
-
2006
-
2005
-
2004
-
2003
-
The Switch Building
N/A
Avg. Price
Past 12 months
Past 12 months
2024
-
2023
-
2022
-
2021
-
2020
-
2019
-
2018
-
2017
-
2016
-
2015
-
2014
-
2013
-
2012
-
2011
-
2010
-
2009
-
2008
-
2007
-
2006
-
2005
-
2004
-
2003
-
The Switch Building
N/A
Median Price / ft2
Past 12 months
Past 12 months
2024
-
2023
-
2022
-
2021
-
2020
-
2019
-
2018
-
2017
-
2016
-
2015
-
2014
-
2013
-
2012
-
2011
-
2010
-
2009
-
2008
-
2007
-
2006
-
2005
-
2004
-
2003
-
The Switch Building
N/A
Median Price
Past 12 months
Past 12 months
2024
-
2023
-
2022
-
2021
-
2020
-
2019
-
2018
-
2017
-
2016
-
2015
-
2014
-
2013
-
2012
-
2011
-
2010
-
2009
-
2008
-
2007
-
2006
-
2005
-
2004
-
2003
-
The Switch Building
N/A
Avg. Price / ft2
Past 12 months
Past 12 months
2024
-
2023
-
2022
-
2021
-
2020
-
2019
-
2018
-
2017
-
2016
-
2015
-
2014
-
2013
-
2012
-
2011
-
2010
-
2009
-
2008
-
2007
-
2006
-
2005
-
2004
-
2003
-
The Switch Building
N/A
Avg. Price
Past 12 months
Past 12 months
2024
-
2023
-
2022
-
2021
-
2020
-
2019
-
2018
-
2017
-
2016
-
2015
-
2014
-
2013
-
2012
-
2011
-
2010
-
2009
-
2008
-
2007
-
2006
-
2005
-
2004
-
2003
-
The Switch Building
N/A
Median Price / ft2
Past 12 months
Past 12 months
2024
-
2023
-
2022
-
2021
-
2020
-
2019
-
2018
-
2017
-
2016
-
2015
-
2014
-
2013
-
2012
-
2011
-
2010
-
2009
-
2008
-
2007
-
2006
-
2005
-
2004
-
2003
-
The Switch Building
N/A
Median Price
Past 12 months
Past 12 months
2024
-
2023
-
2022
-
2021
-
2020
-
2019
-
2018
-
2017
-
2016
-
2015
-
2014
-
2013
-
2012
-
2011
-
2010
-
2009
-
2008
-
2007
-
2006
-
2005
-
2004
-
2003
-
The Switch Building
N/A
Avg. Price / ft2
Past 12 months
Past 12 months
2024
-
2023
-
2022
-
2021
-
2020
-
2019
-
2018
-
2017
-
2016
-
2015
-
2014
-
2013
-
2012
-
2011
-
2010
-
2009
-
2008
-
2007
-
2006
-
2005
-
2004
-
2003
-
The Switch Building
N/A
Avg. Price
Past 12 months
Past 12 months
2024
-
2023
-
2022
-
2021
-
2020
-
2019
-
2018
-
2017
-
2016
-
2015
-
2014
-
2013
-
2012
-
2011
-
2010
-
2009
-
2008
-
2007
-
2006
-
2005
-
2004
-
2003
-
The Switch Building
N/A
Median Price / ft2
Past 12 months
Past 12 months
2024
-
2023
-
2022
-
2021
-
2020
-
2019
-
2018
-
2017
-
2016
-
2015
-
2014
-
2013
-
2012
-
2011
-
2010
-
2009
-
2008
-
2007
-
2006
-
2005
-
2004
-
2003
-
The Switch Building
N/A
Median Price
Past 12 months
Past 12 months
2024
-
2023
-
2022
-
2021
-
2020
-
2019
-
2018
-
2017
-
2016
-
2015
-
2014
-
2013
-
2012
-
2011
-
2010
-
2009
-
2008
-
2007
-
2006
-
2005
-
2004
-
2003
-
215 Chrystie Street
$3,695
Avg. Price / ft2
Past 12 months
Past 12 months
-
-
$2,627
$3,484
-
-
$3,784
$3,536
-
-
-
-
-
-
-
-
-
-
-
-
-
-
215 Chrystie Street
$15,650,000
Avg. Price
Past 12 months
Past 12 months
-
-
$3,575,000
$11,750,000
-
-
$12,552,447
$8,598,595
-
-
-
-
-
-
-
-
-
-
-
-
-
-
215 Chrystie Street
$3,695
Median Price / ft2
Past 12 months
Past 12 months
-
-
$2,627
$3,484
-
-
$3,843
$3,605
-
-
-
-
-
-
-
-
-
-
-
-
-
-
215 Chrystie Street
$15,650,000
Median Price
Past 12 months
Past 12 months
-
-
$3,575,000
$11,750,000
-
-
$13,125,000
$7,280,488
-
-
-
-
-
-
-
-
-
-
-
-
-
-
215 Chrystie Street
N/A
Avg. Price / ft2
Past 12 months
Past 12 months
-
-
-
-
-
-
-
-
-
-
-
-
-
-
-
-
-
-
-
-
-
-
215 Chrystie Street
N/A
Avg. Price
Past 12 months
Past 12 months
-
-
-
-
-
-
-
-
-
-
-
-
-
-
-
-
-
-
-
-
-
-
215 Chrystie Street
N/A
Median Price / ft2
Past 12 months
Past 12 months
-
-
-
-
-
-
-
-
-
-
-
-
-
-
-
-
-
-
-
-
-
-
215 Chrystie Street
N/A
Median Price
Past 12 months
Past 12 months
-
-
-
-
-
-
-
-
-
-
-
-
-
-
-
-
-
-
-
-
-
-
215 Chrystie Street
N/A
Avg. Price / ft2
Past 12 months
Past 12 months
-
-
$2,627
-
-
-
$2,641
-
-
-
-
-
-
-
-
-
-
-
-
-
-
-
215 Chrystie Street
N/A
Avg. Price
Past 12 months
Past 12 months
-
-
$3,575,000
-
-
-
$3,594,788
-
-
-
-
-
-
-
-
-
-
-
-
-
-
-
215 Chrystie Street
N/A
Median Price / ft2
Past 12 months
Past 12 months
-
-
$2,627
-
-
-
$2,641
-
-
-
-
-
-
-
-
-
-
-
-
-
-
-
215 Chrystie Street
N/A
Median Price
Past 12 months
Past 12 months
-
-
$3,575,000
-
-
-
$3,594,788
-
-
-
-
-
-
-
-
-
-
-
-
-
-
-
215 Chrystie Street
N/A
Avg. Price / ft2
Past 12 months
Past 12 months
-
-
-
$2,782
-
-
-
$3,586
-
-
-
-
-
-
-
-
-
-
-
-
-
-
215 Chrystie Street
N/A
Avg. Price
Past 12 months
Past 12 months
-
-
-
$5,500,000
-
-
-
$7,089,413
-
-
-
-
-
-
-
-
-
-
-
-
-
-
215 Chrystie Street
N/A
Median Price / ft2
Past 12 months
Past 12 months
-
-
-
$2,782
-
-
-
$3,605
-
-
-
-
-
-
-
-
-
-
-
-
-
-
215 Chrystie Street
N/A
Median Price
Past 12 months
Past 12 months
-
-
-
$5,500,000
-
-
-
$7,127,750
-
-
-
-
-
-
-
-
-
-
-
-
-
-
215 Chrystie Street
N/A
Avg. Price / ft2
Past 12 months
Past 12 months
-
-
-
$4,186
-
-
$3,843
$3,406
-
-
-
-
-
-
-
-
-
-
-
-
-
-
215 Chrystie Street
N/A
Avg. Price
Past 12 months
Past 12 months
-
-
-
$18,000,000
-
-
$13,125,000
$7,640,642
-
-
-
-
-
-
-
-
-
-
-
-
-
-
215 Chrystie Street
N/A
Median Price / ft2
Past 12 months
Past 12 months
-
-
-
$4,186
-
-
$3,843
$3,455
-
-
-
-
-
-
-
-
-
-
-
-
-
-
215 Chrystie Street
N/A
Median Price
Past 12 months
Past 12 months
-
-
-
$18,000,000
-
-
$13,125,000
$7,750,000
-
-
-
-
-
-
-
-
-
-
-
-
-
-
215 Chrystie Street
$3,695
Avg. Price / ft2
Past 12 months
Past 12 months
-
-
-
-
-
-
$4,808
$3,777
-
-
-
-
-
-
-
-
-
-
-
-
-
-
215 Chrystie Street
$15,650,000
Avg. Price
Past 12 months
Past 12 months
-
-
-
-
-
-
$20,365,000
$16,000,000
-
-
-
-
-
-
-
-
-
-
-
-
-
-
215 Chrystie Street
$3,695
Median Price / ft2
Past 12 months
Past 12 months
-
-
-
-
-
-
$4,808
$3,777
-
-
-
-
-
-
-
-
-
-
-
-
-
-
215 Chrystie Street
$15,650,000
Median Price
Past 12 months
Past 12 months
-
-
-
-
-
-
$20,365,000
$16,000,000
-
-
-
-
-
-
-
-
-
-
-
-
-
-
215 Chrystie Street
N/A
Avg. Price / ft2
Past 12 months
Past 12 months
-
-
-
-
-
-
-
-
-
-
-
-
-
-
-
-
-
-
-
-
-
-
215 Chrystie Street
N/A
Avg. Price
Past 12 months
Past 12 months
-
-
-
-
-
-
-
-
-
-
-
-
-
-
-
-
-
-
-
-
-
-
215 Chrystie Street
N/A
Median Price / ft2
Past 12 months
Past 12 months
-
-
-
-
-
-
-
-
-
-
-
-
-
-
-
-
-
-
-
-
-
-
215 Chrystie Street
N/A
Median Price
Past 12 months
Past 12 months
-
-
-
-
-
-
-
-
-
-
-
-
-
-
-
-
-
-
-
-
-
-
Forward Building
$2,099
Avg. Price / ft2
Past 12 months
Past 12 months
$2,004
$1,866
$944
$2,040
-
$1,955
$1,668
$1,481
-
-
$1,439
$1,195
-
-
$750
-
$1,116
$1,133
$934
-
-
-
Forward Building
$4,023,750
Avg. Price
Past 12 months
Past 12 months
$1,661,750
$2,362,500
$1,713,688
$1,275,000
-
$2,375,000
$2,533,333
$1,570,000
-
-
$2,125,000
$1,715,000
-
-
$1,200,000
-
$2,175,833
$1,030,000
$1,255,161
-
-
-
Forward Building
$1,843
Median Price / ft2
Past 12 months
Past 12 months
$2,024
$1,866
$944
$2,040
-
$1,955
$1,707
$1,481
-
-
$1,439
$1,195
-
-
$750
-
$1,254
$1,133
$974
-
-
-
Forward Building
$3,750,000
Median Price
Past 12 months
Past 12 months
$1,448,500
$2,362,500
$1,713,688
$1,275,000
-
$2,375,000
$2,500,000
$1,570,000
-
-
$2,125,000
$1,715,000
-
-
$1,200,000
-
$1,900,000
$1,030,000
$1,145,532
-
-
-
Forward Building
N/A
Avg. Price / ft2
Past 12 months
Past 12 months
$2,128
-
$944
$2,040
-
-
$1,377
-
-
-
-
-
-
-
-
-
$1,255
-
$884
-
-
-
Forward Building
N/A
Avg. Price
Past 12 months
Past 12 months
$1,330,000
-
$1,713,688
$1,275,000
-
-
$2,500,000
-
-
-
-
-
-
-
-
-
$3,250,000
-
$1,188,453
-
-
-
Forward Building
N/A
Median Price / ft2
Past 12 months
Past 12 months
$2,128
-
$944
$2,040
-
-
$1,377
-
-
-
-
-
-
-
-
-
$1,255
-
$937
-
-
-
Forward Building
N/A
Median Price
Past 12 months
Past 12 months
$1,330,000
-
$1,713,688
$1,275,000
-
-
$2,500,000
-
-
-
-
-
-
-
-
-
$3,250,000
-
$763,687
-
-
-
Forward Building
$1,827
Avg. Price / ft2
Past 12 months
Past 12 months
$1,984
-
-
-
-
$1,955
-
$1,458
-
-
-
-
-
-
-
-
$1,254
$1,200
$951
-
-
-
Forward Building
$1,700,000
Avg. Price
Past 12 months
Past 12 months
$1,333,500
-
-
-
-
$2,375,000
-
$1,545,000
-
-
-
-
-
-
-
-
$1,900,000
$750,000
$1,035,056
-
-
-
Forward Building
$1,827
Median Price / ft2
Past 12 months
Past 12 months
$1,984
-
-
-
-
$1,955
-
$1,458
-
-
-
-
-
-
-
-
$1,254
$1,200
$964
-
-
-
Forward Building
$1,700,000
Median Price
Past 12 months
Past 12 months
$1,333,500
-
-
-
-
$2,375,000
-
$1,545,000
-
-
-
-
-
-
-
-
$1,900,000
$750,000
$1,017,231
-
-
-
Forward Building
$2,730
Avg. Price / ft2
Past 12 months
Past 12 months
$1,920
$2,199
-
-
-
-
$1,814
-
-
-
$1,812
$1,195
-
-
-
-
-
$1,065
$1,040
-
-
-
Forward Building
$7,495,000
Avg. Price
Past 12 months
Past 12 months
$2,650,000
$3,100,000
-
-
-
-
$2,550,000
-
-
-
$2,500,000
$1,715,000
-
-
-
-
-
$1,310,000
$1,858,306
-
-
-
Forward Building
$2,730
Median Price / ft2
Past 12 months
Past 12 months
$1,920
$2,199
-
-
-
-
$1,814
-
-
-
$1,812
$1,195
-
-
-
-
-
$1,065
$1,008
-
-
-
Forward Building
$7,495,000
Median Price
Past 12 months
Past 12 months
$2,650,000
$3,100,000
-
-
-
-
$2,550,000
-
-
-
$2,500,000
$1,715,000
-
-
-
-
-
$1,310,000
$1,591,015
-
-
-
Forward Building
$1,793
Avg. Price / ft2
Past 12 months
Past 12 months
-
$1,533
-
-
-
-
-
$1,505
-
-
$1,067
-
-
-
$750
-
$840
-
$685
-
-
-
Forward Building
$5,200,000
Avg. Price
Past 12 months
Past 12 months
-
$1,625,000
-
-
-
-
-
$1,595,000
-
-
$1,750,000
-
-
-
$1,200,000
-
$1,377,500
-
$1,109,893
-
-
-
Forward Building
$1,793
Median Price / ft2
Past 12 months
Past 12 months
-
$1,533
-
-
-
-
-
$1,505
-
-
$1,067
-
-
-
$750
-
$840
-
$685
-
-
-
Forward Building
$5,200,000
Median Price
Past 12 months
Past 12 months
-
$1,625,000
-
-
-
-
-
$1,595,000
-
-
$1,750,000
-
-
-
$1,200,000
-
$1,377,500
-
$1,109,893
-
-
-
Forward Building
N/A
Avg. Price / ft2
Past 12 months
Past 12 months
-
-
-
-
-
-
-
-
-
-
-
-
-
-
-
-
-
-
-
-
-
-
Forward Building
N/A
Avg. Price
Past 12 months
Past 12 months
-
-
-
-
-
-
-
-
-
-
-
-
-
-
-
-
-
-
-
-
-
-
Forward Building
N/A
Median Price / ft2
Past 12 months
Past 12 months
-
-
-
-
-
-
-
-
-
-
-
-
-
-
-
-
-
-
-
-
-
-
Forward Building
N/A
Median Price
Past 12 months
Past 12 months
-
-
-
-
-
-
-
-
-
-
-
-
-
-
-
-
-
-
-
-
-
-
Forward Building
N/A
Avg. Price / ft2
Past 12 months
Past 12 months
-
-
-
-
-
-
-
-
-
-
-
-
-
-
-
-
-
-
-
-
-
-
Forward Building
N/A
Avg. Price
Past 12 months
Past 12 months
-
-
-
-
-
-
-
-
-
-
-
-
-
-
-
-
-
-
-
-
-
-
Forward Building
N/A
Median Price / ft2
Past 12 months
Past 12 months
-
-
-
-
-
-
-
-
-
-
-
-
-
-
-
-
-
-
-
-
-
-
Forward Building
N/A
Median Price
Past 12 months
Past 12 months
-
-
-
-
-
-
-
-
-
-
-
-
-
-
-
-
-
-
-
-
-
-
179 Ludlow Street
$2,029
Avg. Price / ft2
Past 12 months
Past 12 months
-
-
$1,731
-
-
-
-
-
-
$1,870
-
-
-
-
-
-
-
-
-
-
-
-
179 Ludlow Street
$2,168,775
Avg. Price
Past 12 months
Past 12 months
-
-
$1,850,000
-
-
-
-
-
-
$2,054,829
-
-
-
-
-
-
-
-
-
-
-
-
179 Ludlow Street
$2,029
Median Price / ft2
Past 12 months
Past 12 months
-
-
$1,731
-
-
-
-
-
-
$1,708
-
-
-
-
-
-
-
-
-
-
-
-
179 Ludlow Street
$2,168,775
Median Price
Past 12 months
Past 12 months
-
-
$1,850,000
-
-
-
-
-
-
$1,832,850
-
-
-
-
-
-
-
-
-
-
-
-
179 Ludlow Street
N/A
Avg. Price / ft2
Past 12 months
Past 12 months
-
-
-
-
-
-
-
-
-
-
-
-
-
-
-
-
-
-
-
-
-
-
179 Ludlow Street
N/A
Avg. Price
Past 12 months
Past 12 months
-
-
-
-
-
-
-
-
-
-
-
-
-
-
-
-
-
-
-
-
-
-
179 Ludlow Street
N/A
Median Price / ft2
Past 12 months
Past 12 months
-
-
-
-
-
-
-
-
-
-
-
-
-
-
-
-
-
-
-
-
-
-
179 Ludlow Street
N/A
Median Price
Past 12 months
Past 12 months
-
-
-
-
-
-
-
-
-
-
-
-
-
-
-
-
-
-
-
-
-
-
179 Ludlow Street
N/A
Avg. Price / ft2
Past 12 months
Past 12 months
-
-
$1,731
-
-
-
-
-
-
$1,707
-
-
-
-
-
-
-
-
-
-
-
-
179 Ludlow Street
N/A
Avg. Price
Past 12 months
Past 12 months
-
-
$1,850,000
-
-
-
-
-
-
$1,889,739
-
-
-
-
-
-
-
-
-
-
-
-
179 Ludlow Street
N/A
Median Price / ft2
Past 12 months
Past 12 months
-
-
$1,731
-
-
-
-
-
-
$1,668
-
-
-
-
-
-
-
-
-
-
-
-
179 Ludlow Street
N/A
Median Price
Past 12 months
Past 12 months
-
-
$1,850,000
-
-
-
-
-
-
$1,787,029
-
-
-
-
-
-
-
-
-
-
-
-
179 Ludlow Street
N/A
Avg. Price / ft2
Past 12 months
Past 12 months
-
-
-
-
-
-
-
-
-
-
-
-
-
-
-
-
-
-
-
-
-
-
179 Ludlow Street
N/A
Avg. Price
Past 12 months
Past 12 months
-
-
-
-
-
-
-
-
-
-
-
-
-
-
-
-
-
-
-
-
-
-
179 Ludlow Street
N/A
Median Price / ft2
Past 12 months
Past 12 months
-
-
-
-
-
-
-
-
-
-
-
-
-
-
-
-
-
-
-
-
-
-
179 Ludlow Street
N/A
Median Price
Past 12 months
Past 12 months
-
-
-
-
-
-
-
-
-
-
-
-
-
-
-
-
-
-
-
-
-
-
179 Ludlow Street
$2,029
Avg. Price / ft2
Past 12 months
Past 12 months
-
-
-
-
-
-
-
-
-
$2,849
-
-
-
-
-
-
-
-
-
-
-
-
179 Ludlow Street
$2,168,775
Avg. Price
Past 12 months
Past 12 months
-
-
-
-
-
-
-
-
-
$3,045,375
-
-
-
-
-
-
-
-
-
-
-
-
179 Ludlow Street
$2,029
Median Price / ft2
Past 12 months
Past 12 months
-
-
-
-
-
-
-
-
-
$2,849
-
-
-
-
-
-
-
-
-
-
-
-
179 Ludlow Street
$2,168,775
Median Price
Past 12 months
Past 12 months
-
-
-
-
-
-
-
-
-
$3,045,375
-
-
-
-
-
-
-
-
-
-
-
-
179 Ludlow Street
N/A
Avg. Price / ft2
Past 12 months
Past 12 months
-
-
-
-
-
-
-
-
-
-
-
-
-
-
-
-
-
-
-
-
-
-
179 Ludlow Street
N/A
Avg. Price
Past 12 months
Past 12 months
-
-
-
-
-
-
-
-
-
-
-
-
-
-
-
-
-
-
-
-
-
-
179 Ludlow Street
N/A
Median Price / ft2
Past 12 months
Past 12 months
-
-
-
-
-
-
-
-
-
-
-
-
-
-
-
-
-
-
-
-
-
-
179 Ludlow Street
N/A
Median Price
Past 12 months
Past 12 months
-
-
-
-
-
-
-
-
-
-
-
-
-
-
-
-
-
-
-
-
-
-
196 Orchard Street
$1,935
Avg. Price / ft2
Past 12 months
Past 12 months
$1,942
$2,016
$2,009
$2,164
$1,783
$2,061
$2,048
-
-
-
-
-
-
-
-
-
-
-
-
-
-
-
196 Orchard Street
$1,370,000
Avg. Price
Past 12 months
Past 12 months
$2,916,250
$2,436,307
$2,264,062
$2,930,490
$1,724,681
$1,917,247
$1,653,848
-
-
-
-
-
-
-
-
-
-
-
-
-
-
-
196 Orchard Street
$1,935
Median Price / ft2
Past 12 months
Past 12 months
$1,948
$2,076
$2,082
$2,122
$1,674
$2,004
$2,088
-
-
-
-
-
-
-
-
-
-
-
-
-
-
-
196 Orchard Street
$1,370,000
Median Price
Past 12 months
Past 12 months
$2,922,500
$1,641,403
$2,360,000
$2,885,000
$1,425,000
$1,560,000
$1,463,707
-
-
-
-
-
-
-
-
-
-
-
-
-
-
-
196 Orchard Street
N/A
Avg. Price / ft2
Past 12 months
Past 12 months
-
$1,819
$1,384
-
-
$1,931
$1,578
-
-
-
-
-
-
-
-
-
-
-
-
-
-
-
196 Orchard Street
N/A
Avg. Price
Past 12 months
Past 12 months
-
$1,107,801
$832,000
-
-
$1,112,907
$956,940
-
-
-
-
-
-
-
-
-
-
-
-
-
-
-
196 Orchard Street
N/A
Median Price / ft2
Past 12 months
Past 12 months
-
$1,819
$1,384
-
-
$1,931
$1,606
-
-
-
-
-
-
-
-
-
-
-
-
-
-
-
196 Orchard Street
N/A
Median Price
Past 12 months
Past 12 months
-
$1,107,801
$832,000
-
-
$1,112,907
$965,000
-
-
-
-
-
-
-
-
-
-
-
-
-
-
-
196 Orchard Street
$1,935
Avg. Price / ft2
Past 12 months
Past 12 months
$1,946
$1,954
$1,892
$1,992
$1,680
$1,931
$2,106
-
-
-
-
-
-
-
-
-
-
-
-
-
-
-
196 Orchard Street
$1,370,000
Avg. Price
Past 12 months
Past 12 months
$1,325,000
$1,479,452
$1,317,738
$1,500,000
$1,384,590
$1,473,511
$1,445,530
-
-
-
-
-
-
-
-
-
-
-
-
-
-
-
196 Orchard Street
$1,935
Median Price / ft2
Past 12 months
Past 12 months
$1,946
$2,008
$1,914
$1,992
$1,631
$1,940
$2,068
-
-
-
-
-
-
-
-
-
-
-
-
-
-
-
196 Orchard Street
$1,370,000
Median Price
Past 12 months
Past 12 months
$1,325,000
$1,435,153
$1,403,094
$1,500,000
$1,380,000
$1,473,000
$1,463,225
-
-
-
-
-
-
-
-
-
-
-
-
-
-
-
196 Orchard Street
N/A
Avg. Price / ft2
Past 12 months
Past 12 months
$1,950
-
$2,093
$2,189
$2,144
$2,296
$2,289
-
-
-
-
-
-
-
-
-
-
-
-
-
-
-
196 Orchard Street
N/A
Avg. Price
Past 12 months
Past 12 months
$2,350,000
-
$2,512,648
$2,734,419
$2,915,000
$2,754,853
$2,674,568
-
-
-
-
-
-
-
-
-
-
-
-
-
-
-
196 Orchard Street
N/A
Median Price / ft2
Past 12 months
Past 12 months
$1,950
-
$2,117
$2,162
$2,144
$2,406
$2,302
-
-
-
-
-
-
-
-
-
-
-
-
-
-
-
196 Orchard Street
N/A
Median Price
Past 12 months
Past 12 months
$2,350,000
-
$2,475,000
$2,840,000
$2,915,000
$2,899,189
$2,672,906
-
-
-
-
-
-
-
-
-
-
-
-
-
-
-
196 Orchard Street
N/A
Avg. Price / ft2
Past 12 months
Past 12 months
$1,937
$2,165
-
$2,174
-
$2,492
$2,323
-
-
-
-
-
-
-
-
-
-
-
-
-
-
-
196 Orchard Street
N/A
Avg. Price
Past 12 months
Past 12 months
$3,995,000
$4,154,950
-
$4,233,948
-
$3,875,000
$3,159,575
-
-
-
-
-
-
-
-
-
-
-
-
-
-
-
196 Orchard Street
N/A
Median Price / ft2
Past 12 months
Past 12 months
$1,937
$2,086
-
$2,174
-
$2,492
$2,323
-
-
-
-
-
-
-
-
-
-
-
-
-
-
-
196 Orchard Street
N/A
Median Price
Past 12 months
Past 12 months
$3,995,000
$3,977,500
-
$4,233,948
-
$3,875,000
$3,159,575
-
-
-
-
-
-
-
-
-
-
-
-
-
-
-
196 Orchard Street
N/A
Avg. Price / ft2
Past 12 months
Past 12 months
-
-
$2,401
-
-
-
-
-
-
-
-
-
-
-
-
-
-
-
-
-
-
-
196 Orchard Street
N/A
Avg. Price
Past 12 months
Past 12 months
-
-
$4,795,000
-
-
-
-
-
-
-
-
-
-
-
-
-
-
-
-
-
-
-
196 Orchard Street
N/A
Median Price / ft2
Past 12 months
Past 12 months
-
-
$2,401
-
-
-
-
-
-
-
-
-
-
-
-
-
-
-
-
-
-
-
196 Orchard Street
N/A
Median Price
Past 12 months
Past 12 months
-
-
$4,795,000
-
-
-
-
-
-
-
-
-
-
-
-
-
-
-
-
-
-
-
196 Orchard Street
N/A
Avg. Price / ft2
Past 12 months
Past 12 months
-
-
-
-
-
-
-
-
-
-
-
-
-
-
-
-
-
-
-
-
-
-
196 Orchard Street
N/A
Avg. Price
Past 12 months
Past 12 months
-
-
-
-
-
-
-
-
-
-
-
-
-
-
-
-
-
-
-
-
-
-
196 Orchard Street
N/A
Median Price / ft2
Past 12 months
Past 12 months
-
-
-
-
-
-
-
-
-
-
-
-
-
-
-
-
-
-
-
-
-
-
196 Orchard Street
N/A
Median Price
Past 12 months
Past 12 months
-
-
-
-
-
-
-
-
-
-
-
-
-
-
-
-
-
-
-
-
-
-
242 Broome Street
$1,862
Avg. Price / ft2
Past 12 months
Past 12 months
-
$1,874
$1,915
$982
$1,867
$2,217
$1,942
-
-
-
-
-
-
-
-
-
-
-
-
-
-
-
242 Broome Street
$2,110,833
Avg. Price
Past 12 months
Past 12 months
-
$2,852,500
$1,480,000
$933,500
$3,465,000
$3,304,722
$2,301,896
-
-
-
-
-
-
-
-
-
-
-
-
-
-
-
242 Broome Street
$1,970
Median Price / ft2
Past 12 months
Past 12 months
-
$1,874
$1,915
$982
$1,867
$2,198
$1,974
-
-
-
-
-
-
-
-
-
-
-
-
-
-
-
242 Broome Street
$2,250,000
Median Price
Past 12 months
Past 12 months
-
$2,852,500
$1,480,000
$933,500
$3,465,000
$2,817,500
$2,410,000
-
-
-
-
-
-
-
-
-
-
-
-
-
-
-
242 Broome Street
N/A
Avg. Price / ft2
Past 12 months
Past 12 months
-
-
-
-
-
-
-
-
-
-
-
-
-
-
-
-
-
-
-
-
-
-
242 Broome Street
N/A
Avg. Price
Past 12 months
Past 12 months
-
-
-
-
-
-
-
-
-
-
-
-
-
-
-
-
-
-
-
-
-
-
242 Broome Street
N/A
Median Price / ft2
Past 12 months
Past 12 months
-
-
-
-
-
-
-
-
-
-
-
-
-
-
-
-
-
-
-
-
-
-
242 Broome Street
N/A
Median Price
Past 12 months
Past 12 months
-
-
-
-
-
-
-
-
-
-
-
-
-
-
-
-
-
-
-
-
-
-
242 Broome Street
$1,776
Avg. Price / ft2
Past 12 months
Past 12 months
-
-
$1,915
$982
-
$2,088
$1,850
-
-
-
-
-
-
-
-
-
-
-
-
-
-
-
242 Broome Street
$1,898,750
Avg. Price
Past 12 months
Past 12 months
-
-
$1,480,000
$933,500
-
$1,595,000
$1,673,098
-
-
-
-
-
-
-
-
-
-
-
-
-
-
-
242 Broome Street
$1,776
Median Price / ft2
Past 12 months
Past 12 months
-
-
$1,915
$982
-
$2,088
$1,813
-
-
-
-
-
-
-
-
-
-
-
-
-
-
-
242 Broome Street
$1,898,750
Median Price
Past 12 months
Past 12 months
-
-
$1,480,000
$933,500
-
$1,595,000
$1,596,312
-
-
-
-
-
-
-
-
-
-
-
-
-
-
-
242 Broome Street
$1,970
Avg. Price / ft2
Past 12 months
Past 12 months
-
$1,874
-
-
-
$2,177
$2,037
-
-
-
-
-
-
-
-
-
-
-
-
-
-
-
242 Broome Street
$2,535,000
Avg. Price
Past 12 months
Past 12 months
-
$2,852,500
-
-
-
$2,796,875
$2,871,157
-
-
-
-
-
-
-
-
-
-
-
-
-
-
-
242 Broome Street
$1,970
Median Price / ft2
Past 12 months
Past 12 months
-
$1,874
-
-
-
$2,204
$2,068
-
-
-
-
-
-
-
-
-
-
-
-
-
-
-
242 Broome Street
$2,535,000
Median Price
Past 12 months
Past 12 months
-
$2,852,500
-
-
-
$2,783,750
$2,750,000
-
-
-
-
-
-
-
-
-
-
-
-
-
-
-
242 Broome Street
N/A
Avg. Price / ft2
Past 12 months
Past 12 months
-
-
-
-
$1,867
$2,355
$1,998
-
-
-
-
-
-
-
-
-
-
-
-
-
-
-
242 Broome Street
N/A
Avg. Price
Past 12 months
Past 12 months
-
-
-
-
$3,465,000
$5,121,667
$3,823,733
-
-
-
-
-
-
-
-
-
-
-
-
-
-
-
242 Broome Street
N/A
Median Price / ft2
Past 12 months
Past 12 months
-
-
-
-
$1,867
$2,591
$1,998
-
-
-
-
-
-
-
-
-
-
-
-
-
-
-
242 Broome Street
N/A
Median Price
Past 12 months
Past 12 months
-
-
-
-
$3,465,000
$5,650,000
$3,823,733
-
-
-
-
-
-
-
-
-
-
-
-
-
-
-
242 Broome Street
N/A
Avg. Price / ft2
Past 12 months
Past 12 months
-
-
-
-
-
-
-
-
-
-
-
-
-
-
-
-
-
-
-
-
-
-
242 Broome Street
N/A
Avg. Price
Past 12 months
Past 12 months
-
-
-
-
-
-
-
-
-
-
-
-
-
-
-
-
-
-
-
-
-
-
242 Broome Street
N/A
Median Price / ft2
Past 12 months
Past 12 months
-
-
-
-
-
-
-
-
-
-
-
-
-
-
-
-
-
-
-
-
-
-
242 Broome Street
N/A
Median Price
Past 12 months
Past 12 months
-
-
-
-
-
-
-
-
-
-
-
-
-
-
-
-
-
-
-
-
-
-
242 Broome Street
N/A
Avg. Price / ft2
Past 12 months
Past 12 months
-
-
-
-
-
-
-
-
-
-
-
-
-
-
-
-
-
-
-
-
-
-
242 Broome Street
N/A
Avg. Price
Past 12 months
Past 12 months
-
-
-
-
-
-
-
-
-
-
-
-
-
-
-
-
-
-
-
-
-
-
242 Broome Street
N/A
Median Price / ft2
Past 12 months
Past 12 months
-
-
-
-
-
-
-
-
-
-
-
-
-
-
-
-
-
-
-
-
-
-
242 Broome Street
N/A
Median Price
Past 12 months
Past 12 months
-
-
-
-
-
-
-
-
-
-
-
-
-
-
-
-
-
-
-
-
-
-
One Kenmare Square
$1,822
Avg. Price / ft2
Past 12 months
Past 12 months
$1,670
$1,636
$2,306
$2,000
$1,939
$1,899
$1,961
$2,395
$2,195
$2,482
$2,315
$1,957
$1,626
$2,193
$1,389
$1,569
$1,675
$1,640
$1,477
$1,401
-
-
One Kenmare Square
$2,036,000
Avg. Price
Past 12 months
Past 12 months
$2,675,000
$1,838,750
$2,949,000
$1,678,571
$1,766,500
$2,116,875
$2,209,000
$2,800,000
$1,687,040
$2,456,667
$3,307,500
$3,444,000
$1,738,571
$4,433,330
$1,405,556
$2,450,000
$1,662,500
$1,690,069
$1,936,086
$1,158,722
-
-
One Kenmare Square
$1,861
Median Price / ft2
Past 12 months
Past 12 months
$1,670
$1,770
$2,136
$1,962
$1,939
$1,935
$2,101
$2,395
$2,205
$2,344
$2,308
$1,789
$1,664
$2,538
$1,451
$1,569
$1,669
$1,646
$1,416
$1,349
-
-
One Kenmare Square
$2,485,000
Median Price
Past 12 months
Past 12 months
$2,675,000
$2,015,000
$2,100,500
$1,210,000
$1,766,500
$2,133,750
$2,450,000
$2,800,000
$1,565,000
$1,800,000
$3,175,000
$2,630,000
$1,300,000
$5,220,000
$1,575,000
$2,450,000
$1,675,000
$1,850,000
$1,781,937
$1,170,987
-
-
One Kenmare Square
$1,826
Avg. Price / ft2
Past 12 months
Past 12 months
-
-
-
$1,962
-
-
-
-
$2,205
-
-
-
-
-
-
-
-
-
$1,273
$1,370
-
-
One Kenmare Square
$814,500
Avg. Price
Past 12 months
Past 12 months
-
-
-
$875,000
-
-
-
-
$983,619
-
-
-
-
-
-
-
-
-
$567,674
$610,950
-
-
One Kenmare Square
$1,826
Median Price / ft2
Past 12 months
Past 12 months
-
-
-
$1,962
-
-
-
-
$2,205
-
-
-
-
-
-
-
-
-
$1,273
$1,370
-
-
One Kenmare Square
$814,500
Median Price
Past 12 months
Past 12 months
-
-
-
$875,000
-
-
-
-
$983,619
-
-
-
-
-
-
-
-
-
$567,674
$610,950
-
-
One Kenmare Square
N/A
Avg. Price / ft2
Past 12 months
Past 12 months
-
$1,501
$2,087
$1,763
$2,055
$1,920
$2,124
-
$2,175
$2,261
$2,044
-
$1,694
-
$1,425
-
$1,806
$1,717
$1,296
$1,424
-
-
One Kenmare Square
N/A
Avg. Price
Past 12 months
Past 12 months
-
$1,152,500
$1,603,000
$1,223,333
$1,383,000
$1,400,000
$1,535,000
-
$1,565,000
$1,735,000
$1,570,000
-
$1,173,750
-
$1,057,500
-
$1,300,000
$1,315,000
$922,951
$1,040,797
-
-
One Kenmare Square
N/A
Median Price / ft2
Past 12 months
Past 12 months
-
$1,501
$2,087
$1,814
$2,055
$1,920
$2,124
-
$2,175
$2,261
$2,044
-
$1,729
-
$1,426
-
$1,806
$1,706
$1,277
$1,378
-
-
One Kenmare Square
N/A
Median Price
Past 12 months
Past 12 months
-
$1,152,500
$1,603,000
$1,210,000
$1,383,000
$1,400,000
$1,535,000
-
$1,565,000
$1,735,000
$1,570,000
-
$1,235,000
-
$1,072,500
-
$1,300,000
$1,300,000
$912,000
$1,030,978
-
-
One Kenmare Square
$2,141
Avg. Price / ft2
Past 12 months
Past 12 months
$2,072
$1,770
$2,525
$2,393
$1,822
$1,892
$1,853
$2,395
$2,205
$2,924
$2,369
$1,816
$1,680
$1,968
$1,361
$1,569
$1,544
$1,601
$1,502
$1,356
-
-
One Kenmare Square
$2,490,000
Avg. Price
Past 12 months
Past 12 months
$2,250,000
$2,525,000
$4,295,000
$3,165,000
$2,150,000
$2,355,833
$2,658,333
$2,800,000
$2,512,500
$3,900,000
$3,655,000
$2,235,000
$2,212,500
$3,459,995
$1,684,000
$2,450,000
$2,025,000
$1,877,604
$2,094,421
$1,616,472
-
-
One Kenmare Square
$2,141
Median Price / ft2
Past 12 months
Past 12 months
$2,072
$1,770
$2,525
$2,393
$1,822
$1,949
$1,991
$2,395
$2,205
$2,924
$2,365
$1,789
$1,680
$1,968
$1,482
$1,569
$1,544
$1,616
$1,467
$1,332
-
-
One Kenmare Square
$2,490,000
Median Price
Past 12 months
Past 12 months
$2,250,000
$2,525,000
$4,295,000
$3,165,000
$2,150,000
$2,200,000
$2,650,000
$2,800,000
$2,512,500
$3,900,000
$3,250,000
$2,075,000
$2,212,500
$3,459,995
$1,650,000
$2,450,000
$2,025,000
$1,877,750
$1,858,306
$1,578,287
-
-
One Kenmare Square
N/A
Avg. Price / ft2
Past 12 months
Past 12 months
$1,268
-
-
-
-
-
-
-
-
-
-
$2,168
$1,247
$2,642
-
-
-
-
$2,279
-
-
-
One Kenmare Square
N/A
Avg. Price
Past 12 months
Past 12 months
$3,100,000
-
-
-
-
-
-
-
-
-
-
$5,257,500
$3,050,000
$6,380,000
-
-
-
-
$5,504,625
-
-
-
One Kenmare Square
N/A
Median Price / ft2
Past 12 months
Past 12 months
$1,268
-
-
-
-
-
-
-
-
-
-
$2,168
$1,247
$2,642
-
-
-
-
$2,279
-
-
-
One Kenmare Square
N/A
Median Price
Past 12 months
Past 12 months
$3,100,000
-
-
-
-
-
-
-
-
-
-
$5,257,500
$3,050,000
$6,380,000
-
-
-
-
$5,504,625
-
-
-
One Kenmare Square
$1,446
Avg. Price / ft2
Past 12 months
Past 12 months
-
-
-
-
-
-
-
-
-
-
-
-
-
-
-
-
-
-
$1,690
-
-
-
One Kenmare Square
$3,571,000
Avg. Price
Past 12 months
Past 12 months
-
-
-
-
-
-
-
-
-
-
-
-
-
-
-
-
-
-
$4,174,825
-
-
-
One Kenmare Square
$1,446
Median Price / ft2
Past 12 months
Past 12 months
-
-
-
-
-
-
-
-
-
-
-
-
-
-
-
-
-
-
$1,690
-
-
-
One Kenmare Square
$3,571,000
Median Price
Past 12 months
Past 12 months
-
-
-
-
-
-
-
-
-
-
-
-
-
-
-
-
-
-
$4,174,825
-
-
-
One Kenmare Square
N/A
Avg. Price / ft2
Past 12 months
Past 12 months
-
-
-
-
-
-
-
-
-
-
-
-
-
-
-
-
-
-
-
-
-
-
One Kenmare Square
N/A
Avg. Price
Past 12 months
Past 12 months
-
-
-
-
-
-
-
-
-
-
-
-
-
-
-
-
-
-
-
-
-
-
One Kenmare Square
N/A
Median Price / ft2
Past 12 months
Past 12 months
-
-
-
-
-
-
-
-
-
-
-
-
-
-
-
-
-
-
-
-
-
-
One Kenmare Square
N/A
Median Price
Past 12 months
Past 12 months
-
-
-
-
-
-
-
-
-
-
-
-
-
-
-
-
-
-
-
-
-
-
Ice House Condominiums
$1,792
Avg. Price / ft2
Past 12 months
Past 12 months
$1,949
$1,328
$1,368
$1,265
-
-
$1,145
-
-
$1,293
$1,526
$1,017
$1,210
$908
$943
-
$1,164
$945
-
$955
$801
$543
Ice House Condominiums
$2,950,000
Avg. Price
Past 12 months
Past 12 months
$3,575,000
$1,342,123
$1,432,500
$2,150,000
-
-
$2,100,000
-
-
$1,996,250
$2,210,000
$1,525,000
$1,250,000
$1,532,500
$1,287,500
-
$1,850,000
$1,432,500
-
$1,387,500
$1,295,000
$943,330
Ice House Condominiums
$1,792
Median Price / ft2
Past 12 months
Past 12 months
$1,949
$1,380
$1,368
$1,265
-
-
$1,145
-
-
$1,293
$1,246
$1,017
$1,210
$908
$943
-
$1,164
$927
-
$1,014
$801
$545
Ice House Condominiums
$2,950,000
Median Price
Past 12 months
Past 12 months
$3,575,000
$952,500
$1,432,500
$2,150,000
-
-
$2,100,000
-
-
$1,996,250
$2,075,000
$1,525,000
$1,250,000
$1,532,500
$1,287,500
-
$1,850,000
$1,450,000
-
$1,400,000
$1,295,000
$930,000
Ice House Condominiums
N/A
Avg. Price / ft2
Past 12 months
Past 12 months
-
$1,380
-
-
-
-
-
-
-
-
-
-
-
-
-
-
-
-
-
-
-
-
Ice House Condominiums
N/A
Avg. Price
Past 12 months
Past 12 months
-
$952,500
-
-
-
-
-
-
-
-
-
-
-
-
-
-
-
-
-
-
-
-
Ice House Condominiums
N/A
Median Price / ft2
Past 12 months
Past 12 months
-
$1,380
-
-
-
-
-
-
-
-
-
-
-
-
-
-
-
-
-
-
-
-
Ice House Condominiums
N/A
Median Price
Past 12 months
Past 12 months
-
$952,500
-
-
-
-
-
-
-
-
-
-
-
-
-
-
-
-
-
-
-
-
Ice House Condominiums
N/A
Avg. Price / ft2
Past 12 months
Past 12 months
-
-
$1,368
$1,390
-
-
-
-
-
-
$1,261
$1,017
$1,210
-
$992
-
-
$1,230
-
$928
-
-
Ice House Condominiums
N/A
Avg. Price
Past 12 months
Past 12 months
-
-
$1,432,500
$2,425,000
-
-
-
-
-
-
$2,200,000
$1,525,000
$1,250,000
-
$1,025,000
-
-
$1,260,000
-
$950,000
-
-
Ice House Condominiums
N/A
Median Price / ft2
Past 12 months
Past 12 months
-
-
$1,368
$1,390
-
-
-
-
-
-
$1,261
$1,017
$1,210
-
$992
-
-
$1,230
-
$928
-
-
Ice House Condominiums
N/A
Median Price
Past 12 months
Past 12 months
-
-
$1,432,500
$2,425,000
-
-
-
-
-
-
$2,200,000
$1,525,000
$1,250,000
-
$1,025,000
-
-
$1,260,000
-
$950,000
-
-
Ice House Condominiums
$1,792
Avg. Price / ft2
Past 12 months
Past 12 months
$1,949
-
-
$1,139
-
-
$1,145
-
-
$1,293
$1,229
-
-
$908
$893
-
$1,164
$888
-
$964
$801
$543
Ice House Condominiums
$2,950,000
Avg. Price
Past 12 months
Past 12 months
$3,575,000
-
-
$1,875,000
-
-
$2,100,000
-
-
$1,996,250
$1,925,000
-
-
$1,532,500
$1,550,000
-
$1,850,000
$1,467,000
-
$1,533,333
$1,295,000
$943,330
Ice House Condominiums
$1,792
Median Price / ft2
Past 12 months
Past 12 months
$1,949
-
-
$1,139
-
-
$1,145
-
-
$1,293
$1,229
-
-
$908
$893
-
$1,164
$882
-
$1,101
$801
$545
Ice House Condominiums
$2,950,000
Median Price
Past 12 months
Past 12 months
$3,575,000
-
-
$1,875,000
-
-
$2,100,000
-
-
$1,996,250
$1,925,000
-
-
$1,532,500
$1,550,000
-
$1,850,000
$1,500,000
-
$1,700,000
$1,295,000
$930,000
Ice House Condominiums
N/A
Avg. Price / ft2
Past 12 months
Past 12 months
-
$1,967
-
-
-
-
-
-
-
-
$2,387
-
-
-
-
-
-
-
-
-
-
-
Ice House Condominiums
N/A
Avg. Price
Past 12 months
Past 12 months
-
$2,300,000
-
-
-
-
-
-
-
-
$2,790,000
-
-
-
-
-
-
-
-
-
-
-
Ice House Condominiums
N/A
Median Price / ft2
Past 12 months
Past 12 months
-
$1,967
-
-
-
-
-
-
-
-
$2,387
-
-
-
-
-
-
-
-
-
-
-
Ice House Condominiums
N/A
Median Price
Past 12 months
Past 12 months
-
$2,300,000
-
-
-
-
-
-
-
-
$2,790,000
-
-
-
-
-
-
-
-
-
-
-
Ice House Condominiums
N/A
Avg. Price / ft2
Past 12 months
Past 12 months
-
-
-
-
-
-
-
-
-
-
-
-
-
-
-
-
-
-
-
-
-
-
Ice House Condominiums
N/A
Avg. Price
Past 12 months
Past 12 months
-
-
-
-
-
-
-
-
-
-
-
-
-
-
-
-
-
-
-
-
-
-
Ice House Condominiums
N/A
Median Price / ft2
Past 12 months
Past 12 months
-
-
-
-
-
-
-
-
-
-
-
-
-
-
-
-
-
-
-
-
-
-
Ice House Condominiums
N/A
Median Price
Past 12 months
Past 12 months
-
-
-
-
-
-
-
-
-
-
-
-
-
-
-
-
-
-
-
-
-
-
Ice House Condominiums
N/A
Avg. Price / ft2
Past 12 months
Past 12 months
-
-
-
-
-
-
-
-
-
-
-
-
-
-
-
-
-
-
-
-
-
-
Ice House Condominiums
N/A
Avg. Price
Past 12 months
Past 12 months
-
-
-
-
-
-
-
-
-
-
-
-
-
-
-
-
-
-
-
-
-
-
Ice House Condominiums
N/A
Median Price / ft2
Past 12 months
Past 12 months
-
-
-
-
-
-
-
-
-
-
-
-
-
-
-
-
-
-
-
-
-
-
Ice House Condominiums
N/A
Median Price
Past 12 months
Past 12 months
-
-
-
-
-
-
-
-
-
-
-
-
-
-
-
-
-
-
-
-
-
-
Christadora House
$1,711
Avg. Price / ft2
Past 12 months
Past 12 months
$1,675
$1,567
$2,042
$1,470
$1,701
$1,553
$1,798
$1,529
$1,890
$1,862
$1,394
$1,609
$938
$1,244
$1,188
$1,147
-
$1,369
$1,321
$1,392
$925
$760
Christadora House
$865,800
Avg. Price
Past 12 months
Past 12 months
$1,143,500
$768,800
$1,138,748
$1,311,667
$1,500,000
$967,500
$935,000
$874,500
$1,750,000
$931,000
$1,150,000
$1,255,000
$725,000
$1,038,250
$845,000
$585,000
-
$1,733,667
$733,000
$705,000
$630,655
$820,417
Christadora House
$1,793
Median Price / ft2
Past 12 months
Past 12 months
$1,695
$1,781
$1,856
$1,194
$1,701
$1,553
$1,825
$1,529
$1,890
$1,862
$1,394
$1,609
$924
$1,210
$1,188
$1,147
-
$1,271
$1,390
$1,362
$960
$715
Christadora House
$900,000
Median Price
Past 12 months
Past 12 months
$1,062,500
$702,500
$932,500
$1,100,000
$1,500,000
$967,500
$975,000
$874,500
$1,750,000
$931,000
$1,150,000
$1,255,000
$700,000
$861,500
$845,000
$585,000
-
$1,800,000
$695,000
$657,000
$652,500
$656,250
Christadora House
$1,585
Avg. Price / ft2
Past 12 months
Past 12 months
$1,623
$1,781
$1,601
-
-
-
$1,619
$1,516
-
-
-
-
$1,095
-
$1,225
-
-
-
$1,178
$1,500
-
$499
Christadora House
$634,000
Avg. Price
Past 12 months
Past 12 months
$649,000
$702,500
$727,500
-
-
-
$680,000
$749,000
-
-
-
-
$425,000
-
$490,000
-
-
-
$522,500
$600,000
-
$200,000
Christadora House
$1,585
Median Price / ft2
Past 12 months
Past 12 months
$1,623
$1,781
$1,601
-
-
-
$1,619
$1,516
-
-
-
-
$1,095
-
$1,225
-
-
-
$1,178
$1,500
-
$499
Christadora House
$634,000
Median Price
Past 12 months
Past 12 months
$649,000
$702,500
$727,500
-
-
-
$680,000
$749,000
-
-
-
-
$425,000
-
$490,000
-
-
-
$522,500
$600,000
-
$200,000
Christadora House
$1,801
Avg. Price / ft2
Past 12 months
Past 12 months
$1,702
$1,353
$1,890
$1,624
$1,701
$1,932
$1,888
$1,541
-
$1,862
$1,394
$1,609
$859
$1,254
$1,152
$1,147
-
$1,428
$1,420
$1,338
$937
$719
Christadora House
$923,750
Avg. Price
Past 12 months
Past 12 months
$1,062,500
$813,000
$1,100,000
$1,417,500
$1,500,000
$935,000
$1,062,500
$999,999
-
$931,000
$1,150,000
$1,255,000
$875,000
$1,040,000
$1,200,000
$585,000
-
$1,300,500
$710,000
$757,500
$607,177
$563,750
Christadora House
$2,000
Median Price / ft2
Past 12 months
Past 12 months
$1,702
$1,353
$1,890
$1,624
$1,701
$1,932
$1,888
$1,541
-
$1,862
$1,394
$1,609
$859
$1,207
$1,152
$1,147
-
$1,428
$1,420
$1,338
$961
$719
Christadora House
$912,500
Median Price
Past 12 months
Past 12 months
$1,062,500
$1,020,000
$1,100,000
$1,417,500
$1,500,000
$935,000
$1,062,500
$999,999
-
$931,000
$1,150,000
$1,255,000
$875,000
$690,000
$1,200,000
$585,000
-
$1,300,500
$710,000
$757,500
$575,000
$563,750
Christadora House
N/A
Avg. Price / ft2
Past 12 months
Past 12 months
-
-
-
$1,163
-
$1,174
-
-
$1,890
-
-
-
-
$1,212
-
-
-
-
$1,408
-
$840
$874
Christadora House
N/A
Avg. Price
Past 12 months
Past 12 months
-
-
-
$1,100,000
-
$999,999
-
-
$1,750,000
-
-
-
-
$1,033,000
-
-
-
-
$1,200,000
-
$795,000
$1,198,333
Christadora House
N/A
Median Price / ft2
Past 12 months
Past 12 months
-
-
-
$1,163
-
$1,174
-
-
$1,890
-
-
-
-
$1,212
-
-
-
-
$1,408
-
$840
$804
Christadora House
N/A
Median Price
Past 12 months
Past 12 months
-
-
-
$1,100,000
-
$999,999
-
-
$1,750,000
-
-
-
-
$1,033,000
-
-
-
-
$1,200,000
-
$795,000
$685,000
Christadora House
N/A
Avg. Price / ft2
Past 12 months
Past 12 months
-
-
-
-
-
-
-
-
-
-
-
-
-
-
-
-
-
$1,252
-
-
-
-
Christadora House
N/A
Avg. Price
Past 12 months
Past 12 months
-
-
-
-
-
-
-
-
-
-
-
-
-
-
-
-
-
$2,600,000
-
-
-
-
Christadora House
N/A
Median Price / ft2
Past 12 months
Past 12 months
-
-
-
-
-
-
-
-
-
-
-
-
-
-
-
-
-
$1,252
-
-
-
-
Christadora House
N/A
Median Price
Past 12 months
Past 12 months
-
-
-
-
-
-
-
-
-
-
-
-
-
-
-
-
-
$2,600,000
-
-
-
-
Christadora House
N/A
Avg. Price / ft2
Past 12 months
Past 12 months
-
-
-
-
-
-
-
-
-
-
-
-
-
-
-
-
-
-
-
-
-
-
Christadora House
N/A
Avg. Price
Past 12 months
Past 12 months
-
-
-
-
-
-
-
-
-
-
-
-
-
-
-
-
-
-
-
-
-
-
Christadora House
N/A
Median Price / ft2
Past 12 months
Past 12 months
-
-
-
-
-
-
-
-
-
-
-
-
-
-
-
-
-
-
-
-
-
-
Christadora House
N/A
Median Price
Past 12 months
Past 12 months
-
-
-
-
-
-
-
-
-
-
-
-
-
-
-
-
-
-
-
-
-
-
Christadora House
N/A
Avg. Price / ft2
Past 12 months
Past 12 months
-
-
-
-
-
-
-
-
-
-
-
-
-
-
-
-
-
-
-
-
-
-
Christadora House
N/A
Avg. Price
Past 12 months
Past 12 months
-
-
-
-
-
-
-
-
-
-
-
-
-
-
-
-
-
-
-
-
-
-
Christadora House
N/A
Median Price / ft2
Past 12 months
Past 12 months
-
-
-
-
-
-
-
-
-
-
-
-
-
-
-
-
-
-
-
-
-
-
Christadora House
N/A
Median Price
Past 12 months
Past 12 months
-
-
-
-
-
-
-
-
-
-
-
-
-
-
-
-
-
-
-
-
-
-
38 Delancey Street
$1,613
Avg. Price / ft2
Past 12 months
Past 12 months
$1,752
$1,616
$1,754
$1,534
$1,649
$1,687
-
$1,781
$1,682
$1,605
$1,562
$1,203
$861
$991
$1,010
-
-
-
-
-
-
-
38 Delancey Street
$1,427,500
Avg. Price
Past 12 months
Past 12 months
$1,755,000
$1,281,250
$1,170,000
$1,290,000
$1,100,000
$1,690,000
-
$1,498,000
$1,543,333
$1,491,950
$1,317,500
$925,461
$747,102
$948,707
$847,858
-
-
-
-
-
-
-
38 Delancey Street
$1,613
Median Price / ft2
Past 12 months
Past 12 months
$1,752
$1,631
$1,754
$1,534
$1,649
$1,687
-
$1,781
$1,725
$1,605
$1,562
$1,349
$808
$972
$1,021
-
-
-
-
-
-
-
38 Delancey Street
$1,427,500
Median Price
Past 12 months
Past 12 months
$1,755,000
$1,185,000
$1,170,000
$1,290,000
$1,100,000
$1,690,000
-
$1,498,000
$1,557,500
$1,491,950
$1,317,500
$921,494
$790,000
$840,056
$814,754
-
-
-
-
-
-
-
38 Delancey Street
N/A
Avg. Price / ft2
Past 12 months
Past 12 months
-
-
-
-
-
-
-
-
-
-
-
-
-
-
-
-
-
-
-
-
-
-
38 Delancey Street
N/A
Avg. Price
Past 12 months
Past 12 months
-
-
-
-
-
-
-
-
-
-
-
-
-
-
-
-
-
-
-
-
-
-
38 Delancey Street
N/A
Median Price / ft2
Past 12 months
Past 12 months
-
-
-
-
-
-
-
-
-
-
-
-
-
-
-
-
-
-
-
-
-
-
38 Delancey Street
N/A
Median Price
Past 12 months
Past 12 months
-
-
-
-
-
-
-
-
-
-
-
-
-
-
-
-
-
-
-
-
-
-
38 Delancey Street
$1,619
Avg. Price / ft2
Past 12 months
Past 12 months
-
$1,634
$1,754
-
$1,649
-
-
-
$1,624
-
$1,477
$1,201
$813
$895
$1,038
-
-
-
-
-
-
-
38 Delancey Street
$1,080,000
Avg. Price
Past 12 months
Past 12 months
-
$1,092,500
$1,170,000
-
$1,100,000
-
-
-
$1,210,000
-
$985,000
$800,817
$544,136
$742,304
$743,090
-
-
-
-
-
-
-
38 Delancey Street
$1,619
Median Price / ft2
Past 12 months
Past 12 months
-
$1,634
$1,754
-
$1,649
-
-
-
$1,624
-
$1,477
$1,349
$813
$895
$1,032
-
-
-
-
-
-
-
38 Delancey Street
$1,080,000
Median Price
Past 12 months
Past 12 months
-
$1,092,500
$1,170,000
-
$1,100,000
-
-
-
$1,210,000
-
$985,000
$900,000
$544,136
$742,304
$738,231
-
-
-
-
-
-
-
38 Delancey Street
$1,608
Avg. Price / ft2
Past 12 months
Past 12 months
$1,752
$1,598
-
$1,534
-
$1,687
-
$1,781
$1,711
$1,605
$1,647
$1,207
$886
$1,023
$988
-
-
-
-
-
-
-
38 Delancey Street
$1,775,000
Avg. Price
Past 12 months
Past 12 months
$1,755,000
$1,470,000
-
$1,290,000
-
$1,690,000
-
$1,498,000
$1,710,000
$1,491,950
$1,650,000
$1,112,427
$848,585
$1,017,507
$933,578
-
-
-
-
-
-
-
38 Delancey Street
$1,608
Median Price / ft2
Past 12 months
Past 12 months
$1,752
$1,598
-
$1,534
-
$1,687
-
$1,781
$1,746
$1,605
$1,647
$1,207
$808
$1,049
$996
-
-
-
-
-
-
-
38 Delancey Street
$1,775,000
Median Price
Past 12 months
Past 12 months
$1,755,000
$1,470,000
-
$1,290,000
-
$1,690,000
-
$1,498,000
$1,842,500
$1,491,950
$1,650,000
$1,112,427
$819,670
$865,512
$880,786
-
-
-
-
-
-
-
38 Delancey Street
N/A
Avg. Price / ft2
Past 12 months
Past 12 months
-
-
-
-
-
-
-
-
-
-
-
-
-
-
-
-
-
-
-
-
-
-
38 Delancey Street
N/A
Avg. Price
Past 12 months
Past 12 months
-
-
-
-
-
-
-
-
-
-
-
-
-
-
-
-
-
-
-
-
-
-
38 Delancey Street
N/A
Median Price / ft2
Past 12 months
Past 12 months
-
-
-
-
-
-
-
-
-
-
-
-
-
-
-
-
-
-
-
-
-
-
38 Delancey Street
N/A
Median Price
Past 12 months
Past 12 months
-
-
-
-
-
-
-
-
-
-
-
-
-
-
-
-
-
-
-
-
-
-
38 Delancey Street
N/A
Avg. Price / ft2
Past 12 months
Past 12 months
-
-
-
-
-
-
-
-
-
-
-
-
-
-
-
-
-
-
-
-
-
-
38 Delancey Street
N/A
Avg. Price
Past 12 months
Past 12 months
-
-
-
-
-
-
-
-
-
-
-
-
-
-
-
-
-
-
-
-
-
-
38 Delancey Street
N/A
Median Price / ft2
Past 12 months
Past 12 months
-
-
-
-
-
-
-
-
-
-
-
-
-
-
-
-
-
-
-
-
-
-
38 Delancey Street
N/A
Median Price
Past 12 months
Past 12 months
-
-
-
-
-
-
-
-
-
-
-
-
-
-
-
-
-
-
-
-
-
-
The Julliard Building
$1,586
Avg. Price / ft2
Past 12 months
Past 12 months
$1,719
$1,701
$1,919
-
$1,517
-
-
$1,624
-
$1,819
-
-
$1,318
$1,292
$1,124
-
-
$1,100
$1,108
$1,156
$964
$725
The Julliard Building
$4,737,500
Avg. Price
Past 12 months
Past 12 months
$4,575,000
$3,800,000
$3,850,000
-
$4,000,500
-
-
$4,112,500
-
$5,603,333
-
-
$2,809,167
$3,071,750
$2,300,000
-
-
$2,818,125
$2,907,500
$2,515,000
$2,583,333
$1,558,333
The Julliard Building
$1,586
Median Price / ft2
Past 12 months
Past 12 months
$1,705
$1,701
$1,919
-
$1,517
-
-
$1,624
-
$1,813
-
-
$1,360
$1,292
$1,124
-
-
$1,110
$1,108
$1,156
$1,009
$692
The Julliard Building
$4,737,500
Median Price
Past 12 months
Past 12 months
$4,412,500
$3,800,000
$3,850,000
-
$4,000,500
-
-
$4,112,500
-
$6,435,000
-
-
$2,832,500
$3,071,750
$2,300,000
-
-
$2,823,750
$2,907,500
$2,515,000
$2,395,000
$1,330,000
The Julliard Building
N/A
Avg. Price / ft2
Past 12 months
Past 12 months
-
-
-
-
-
-
-
-
-
-
-
-
-
-
-
-
-
-
-
-
-
-
The Julliard Building
N/A
Avg. Price
Past 12 months
Past 12 months
-
-
-
-
-
-
-
-
-
-
-
-
-
-
-
-
-
-
-
-
-
-
The Julliard Building
N/A
Median Price / ft2
Past 12 months
Past 12 months
-
-
-
-
-
-
-
-
-
-
-
-
-
-
-
-
-
-
-
-
-
-
The Julliard Building
N/A
Median Price
Past 12 months
Past 12 months
-
-
-
-
-
-
-
-
-
-
-
-
-
-
-
-
-
-
-
-
-
-
The Julliard Building
N/A
Avg. Price / ft2
Past 12 months
Past 12 months
-
-
-
-
-
-
-
-
-
-
-
-
-
-
-
-
-
-
-
-
-
-
The Julliard Building
N/A
Avg. Price
Past 12 months
Past 12 months
-
-
-
-
-
-
-
-
-
-
-
-
-
-
-
-
-
-
-
-
-
-
The Julliard Building
N/A
Median Price / ft2
Past 12 months
Past 12 months
-
-
-
-
-
-
-
-
-
-
-
-
-
-
-
-
-
-
-
-
-
-
The Julliard Building
N/A
Median Price
Past 12 months
Past 12 months
-
-
-
-
-
-
-
-
-
-
-
-
-
-
-
-
-
-
-
-
-
-
The Julliard Building
$1,669
Avg. Price / ft2
Past 12 months
Past 12 months
$1,674
-
-
-
-
-
-
$1,621
-
-
-
-
$1,318
-
$1,124
-
-
$1,253
-
-
$1,038
$742
The Julliard Building
$3,475,000
Avg. Price
Past 12 months
Past 12 months
$3,425,000
-
-
-
-
-
-
$3,375,000
-
-
-
-
$2,809,167
-
$2,300,000
-
-
$2,586,250
-
-
$2,247,500
$1,312,500
The Julliard Building
$1,669
Median Price / ft2
Past 12 months
Past 12 months
$1,674
-
-
-
-
-
-
$1,621
-
-
-
-
$1,360
-
$1,124
-
-
$1,253
-
-
$1,038
$742
The Julliard Building
$3,475,000
Median Price
Past 12 months
Past 12 months
$3,425,000
-
-
-
-
-
-
$3,375,000
-
-
-
-
$2,832,500
-
$2,300,000
-
-
$2,586,250
-
-
$2,247,500
$1,312,500
The Julliard Building
N/A
Avg. Price / ft2
Past 12 months
Past 12 months
$1,733
$1,701
$1,919
-
$1,517
-
-
$1,628
-
$1,819
-
-
-
$1,292
-
-
-
$948
$1,108
$1,156
-
$692
The Julliard Building
N/A
Avg. Price
Past 12 months
Past 12 months
$4,958,333
$3,800,000
$3,850,000
-
$4,000,500
-
-
$4,850,000
-
$5,603,333
-
-
-
$3,071,750
-
-
-
$3,050,000
$2,907,500
$2,515,000
-
$2,050,000
The Julliard Building
N/A
Median Price / ft2
Past 12 months
Past 12 months
$1,737
$1,701
$1,919
-
$1,517
-
-
$1,628
-
$1,813
-
-
-
$1,292
-
-
-
$948
$1,108
$1,156
-
$692
The Julliard Building
N/A
Median Price
Past 12 months
Past 12 months
$4,775,000
$3,800,000
$3,850,000
-
$4,000,500
-
-
$4,850,000
-
$6,435,000
-
-
-
$3,071,750
-
-
-
$3,050,000
$2,907,500
$2,515,000
-
$2,050,000
The Julliard Building
$1,503
Avg. Price / ft2
Past 12 months
Past 12 months
-
-
-
-
-
-
-
-
-
-
-
-
-
-
-
-
-
-
-
-
$815
-
The Julliard Building
$6,000,000
Avg. Price
Past 12 months
Past 12 months
-
-
-
-
-
-
-
-
-
-
-
-
-
-
-
-
-
-
-
-
$3,255,000
-
The Julliard Building
$1,503
Median Price / ft2
Past 12 months
Past 12 months
-
-
-
-
-
-
-
-
-
-
-
-
-
-
-
-
-
-
-
-
$815
-
The Julliard Building
$6,000,000
Median Price
Past 12 months
Past 12 months
-
-
-
-
-
-
-
-
-
-
-
-
-
-
-
-
-
-
-
-
$3,255,000
-
The Julliard Building
N/A
Avg. Price / ft2
Past 12 months
Past 12 months
-
-
-
-
-
-
-
-
-
-
-
-
-
-
-
-
-
-
-
-
-
-
The Julliard Building
N/A
Avg. Price
Past 12 months
Past 12 months
-
-
-
-
-
-
-
-
-
-
-
-
-
-
-
-
-
-
-
-
-
-
The Julliard Building
N/A
Median Price / ft2
Past 12 months
Past 12 months
-
-
-
-
-
-
-
-
-
-
-
-
-
-
-
-
-
-
-
-
-
-
The Julliard Building
N/A
Median Price
Past 12 months
Past 12 months
-
-
-
-
-
-
-
-
-
-
-
-
-
-
-
-
-
-
-
-
-
-