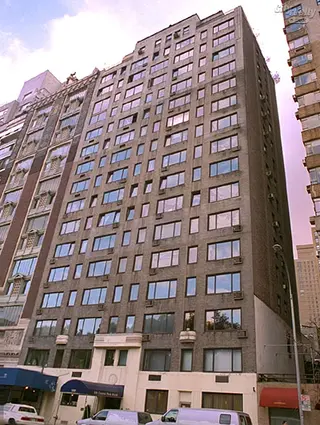
Southmoor House, 230 Central Park South: Price Comparison
between Seventh Avenue & Broadway Building Profile
Southmoor House
N/A
Avg. Price / ft2
Past 12 months
Past 12 months
2024
$2,759
2023
$1,824
2022
$2,402
2021
$1,834
2020
-
2019
-
2018
-
2017
$1,098
2016
$2,598
2015
$1,782
2014
$1,629
2013
-
2012
$1,500
2011
-
2010
$1,218
2009
$847
2008
$1,390
2007
$1,011
2006
$961
2005
$500
2004
$492
2003
$631
Southmoor House
N/A
Avg. Price
Past 12 months
Past 12 months
2024
$2,887,500
2023
$4,199,800
2022
$9,100,000
2021
$4,832,500
2020
-
2019
-
2018
$650,000
2017
$3,532,738
2016
$12,600,000
2015
$4,114,386
2014
$2,662,031
2013
$2,928,659
2012
$750,000
2011
$1,901,000
2010
$1,196,000
2009
$1,122,000
2008
$1,391,563
2007
$1,013,545
2006
$884,833
2005
$250,000
2004
$270,480
2003
$915,000
Southmoor House
N/A
Median Price / ft2
Past 12 months
Past 12 months
2024
$2,759
2023
$1,824
2022
$2,402
2021
$1,834
2020
-
2019
-
2018
-
2017
$1,098
2016
$2,598
2015
$1,452
2014
$1,629
2013
-
2012
$1,500
2011
-
2010
$1,146
2009
$787
2008
$1,370
2007
$980
2006
$857
2005
$500
2004
$492
2003
$631
Southmoor House
N/A
Median Price
Past 12 months
Past 12 months
2024
$2,887,500
2023
$2,875,000
2022
$9,100,000
2021
$4,832,500
2020
-
2019
-
2018
$650,000
2017
$1,700,000
2016
$12,600,000
2015
$3,200,000
2014
$1,189,910
2013
$1,500,000
2012
$750,000
2011
$1,901,000
2010
$974,500
2009
$706,500
2008
$1,033,750
2007
$735,000
2006
$695,000
2005
$250,000
2004
$270,480
2003
$915,000
Southmoor House
N/A
Avg. Price / ft2
Past 12 months
Past 12 months
2024
-
2023
-
2022
-
2021
-
2020
-
2019
-
2018
-
2017
$862
2016
-
2015
-
2014
-
2013
-
2012
$1,500
2011
-
2010
$780
2009
$694
2008
$1,130
2007
$927
2006
$1,364
2005
$500
2004
$492
2003
-
Southmoor House
N/A
Avg. Price
Past 12 months
Past 12 months
2024
-
2023
-
2022
-
2021
-
2020
-
2019
-
2018
-
2017
$430,950
2016
-
2015
-
2014
-
2013
$1,500,000
2012
$750,000
2011
-
2010
$585,000
2009
$366,500
2008
$555,000
2007
$512,167
2006
$670,000
2005
$250,000
2004
$270,480
2003
-
Southmoor House
N/A
Median Price / ft2
Past 12 months
Past 12 months
2024
-
2023
-
2022
-
2021
-
2020
-
2019
-
2018
-
2017
$862
2016
-
2015
-
2014
-
2013
-
2012
$1,500
2011
-
2010
$780
2009
$694
2008
$1,130
2007
$947
2006
$1,364
2005
$500
2004
$492
2003
-
Southmoor House
N/A
Median Price
Past 12 months
Past 12 months
2024
-
2023
-
2022
-
2021
-
2020
-
2019
-
2018
-
2017
$430,950
2016
-
2015
-
2014
-
2013
$1,500,000
2012
$750,000
2011
-
2010
$585,000
2009
$366,500
2008
$490,000
2007
$501,500
2006
$670,000
2005
$250,000
2004
$270,480
2003
-
Southmoor House
N/A
Avg. Price / ft2
Past 12 months
Past 12 months
2024
-
2023
$1,471
2022
-
2021
$1,371
2020
-
2019
-
2018
-
2017
$1,333
2016
-
2015
$1,281
2014
$1,629
2013
-
2012
-
2011
-
2010
$1,146
2009
$1,153
2008
$815
2007
-
2006
$896
2005
-
2004
-
2003
-
Southmoor House
N/A
Avg. Price
Past 12 months
Past 12 months
2024
-
2023
$1,250,000
2022
-
2021
$1,165,000
2020
-
2019
-
2018
-
2017
$1,200,000
2016
-
2015
$1,116,600
2014
$1,642,410
2013
-
2012
-
2011
-
2010
$974,500
2009
$980,000
2008
$692,500
2007
-
2006
$719,125
2005
-
2004
-
2003
-
Southmoor House
N/A
Median Price / ft2
Past 12 months
Past 12 months
2024
-
2023
$1,471
2022
-
2021
$1,371
2020
-
2019
-
2018
-
2017
$1,333
2016
-
2015
$1,281
2014
$1,629
2013
-
2012
-
2011
-
2010
$1,146
2009
$1,153
2008
$815
2007
-
2006
$829
2005
-
2004
-
2003
-
Southmoor House
N/A
Median Price
Past 12 months
Past 12 months
2024
-
2023
$1,250,000
2022
-
2021
$1,165,000
2020
-
2019
-
2018
-
2017
$1,200,000
2016
-
2015
$1,116,600
2014
$1,642,410
2013
-
2012
-
2011
-
2010
$974,500
2009
$980,000
2008
$692,500
2007
-
2006
$678,750
2005
-
2004
-
2003
-
Southmoor House
N/A
Avg. Price / ft2
Past 12 months
Past 12 months
2024
$2,759
2023
-
2022
-
2021
-
2020
-
2019
-
2018
-
2017
-
2016
-
2015
$2,785
2014
-
2013
-
2012
-
2011
-
2010
$1,800
2009
-
2008
$1,937
2007
$1,110
2006
$1,083
2005
-
2004
-
2003
$631
Southmoor House
N/A
Avg. Price
Past 12 months
Past 12 months
2024
$2,887,500
2023
-
2022
-
2021
-
2020
-
2019
-
2018
-
2017
$10,300,000
2016
-
2015
$3,200,000
2014
-
2013
-
2012
-
2011
-
2010
$2,250,000
2009
$2,775,000
2008
$2,458,333
2007
$1,615,200
2006
$1,825,000
2005
-
2004
-
2003
$915,000
Southmoor House
N/A
Median Price / ft2
Past 12 months
Past 12 months
2024
$2,759
2023
-
2022
-
2021
-
2020
-
2019
-
2018
-
2017
-
2016
-
2015
$2,785
2014
-
2013
-
2012
-
2011
-
2010
$1,800
2009
-
2008
$1,937
2007
$1,000
2006
$1,083
2005
-
2004
-
2003
$631
Southmoor House
N/A
Median Price
Past 12 months
Past 12 months
2024
$2,887,500
2023
-
2022
-
2021
-
2020
-
2019
-
2018
-
2017
$10,300,000
2016
-
2015
$3,200,000
2014
-
2013
-
2012
-
2011
-
2010
$2,250,000
2009
$2,775,000
2008
$1,700,000
2007
$1,230,000
2006
$1,825,000
2005
-
2004
-
2003
$915,000
Southmoor House
N/A
Avg. Price / ft2
Past 12 months
Past 12 months
2024
-
2023
-
2022
$2,138
2021
-
2020
-
2019
-
2018
-
2017
-
2016
-
2015
-
2014
-
2013
-
2012
-
2011
-
2010
-
2009
-
2008
-
2007
-
2006
-
2005
-
2004
-
2003
-
Southmoor House
N/A
Avg. Price
Past 12 months
Past 12 months
2024
-
2023
-
2022
$6,200,000
2021
-
2020
-
2019
-
2018
-
2017
$2,200,000
2016
-
2015
$8,350,000
2014
$11,900,000
2013
-
2012
-
2011
$1,901,000
2010
-
2009
-
2008
-
2007
-
2006
-
2005
-
2004
-
2003
-
Southmoor House
N/A
Median Price / ft2
Past 12 months
Past 12 months
2024
-
2023
-
2022
$2,138
2021
-
2020
-
2019
-
2018
-
2017
-
2016
-
2015
-
2014
-
2013
-
2012
-
2011
-
2010
-
2009
-
2008
-
2007
-
2006
-
2005
-
2004
-
2003
-
Southmoor House
N/A
Median Price
Past 12 months
Past 12 months
2024
-
2023
-
2022
$6,200,000
2021
-
2020
-
2019
-
2018
-
2017
$2,200,000
2016
-
2015
$8,350,000
2014
$11,900,000
2013
-
2012
-
2011
$1,901,000
2010
-
2009
-
2008
-
2007
-
2006
-
2005
-
2004
-
2003
-
Southmoor House
N/A
Avg. Price / ft2
Past 12 months
Past 12 months
2024
-
2023
$2,178
2022
$2,667
2021
$2,297
2020
-
2019
-
2018
-
2017
-
2016
-
2015
-
2014
-
2013
-
2012
-
2011
-
2010
-
2009
-
2008
-
2007
-
2006
-
2005
-
2004
-
2003
-
Southmoor House
N/A
Avg. Price
Past 12 months
Past 12 months
2024
-
2023
$9,799,200
2022
$12,000,000
2021
$8,500,000
2020
-
2019
-
2018
-
2017
-
2016
-
2015
-
2014
-
2013
-
2012
-
2011
-
2010
-
2009
-
2008
-
2007
-
2006
-
2005
-
2004
-
2003
-
Southmoor House
N/A
Median Price / ft2
Past 12 months
Past 12 months
2024
-
2023
$2,178
2022
$2,667
2021
$2,297
2020
-
2019
-
2018
-
2017
-
2016
-
2015
-
2014
-
2013
-
2012
-
2011
-
2010
-
2009
-
2008
-
2007
-
2006
-
2005
-
2004
-
2003
-
Southmoor House
N/A
Median Price
Past 12 months
Past 12 months
2024
-
2023
$9,799,200
2022
$12,000,000
2021
$8,500,000
2020
-
2019
-
2018
-
2017
-
2016
-
2015
-
2014
-
2013
-
2012
-
2011
-
2010
-
2009
-
2008
-
2007
-
2006
-
2005
-
2004
-
2003
-
Southmoor House
N/A
Avg. Price / ft2
Past 12 months
Past 12 months
2024
-
2023
-
2022
-
2021
-
2020
-
2019
-
2018
-
2017
-
2016
$2,598
2015
-
2014
-
2013
-
2012
-
2011
-
2010
-
2009
-
2008
-
2007
-
2006
-
2005
-
2004
-
2003
-
Southmoor House
N/A
Avg. Price
Past 12 months
Past 12 months
2024
-
2023
-
2022
-
2021
-
2020
-
2019
-
2018
-
2017
-
2016
$12,600,000
2015
-
2014
-
2013
-
2012
-
2011
-
2010
-
2009
-
2008
-
2007
-
2006
-
2005
-
2004
-
2003
-
Southmoor House
N/A
Median Price / ft2
Past 12 months
Past 12 months
2024
-
2023
-
2022
-
2021
-
2020
-
2019
-
2018
-
2017
-
2016
$2,598
2015
-
2014
-
2013
-
2012
-
2011
-
2010
-
2009
-
2008
-
2007
-
2006
-
2005
-
2004
-
2003
-
Southmoor House
N/A
Median Price
Past 12 months
Past 12 months
2024
-
2023
-
2022
-
2021
-
2020
-
2019
-
2018
-
2017
-
2016
$12,600,000
2015
-
2014
-
2013
-
2012
-
2011
-
2010
-
2009
-
2008
-
2007
-
2006
-
2005
-
2004
-
2003
-