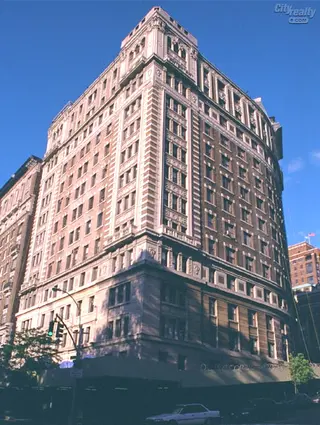
The Paterno, 440 Riverside Drive: Price Comparison
between West 116th Street & West 117th Street Building Profile
The Paterno
N/A
Avg. Price
Past 12 months
Past 12 months
2024
$806,333
2023
$655,000
2022
$475,000
2021
$1,232,500
2020
$3,850,000
2019
$1,283,333
2018
$623,750
2017
$1,396,333
2016
$1,844,810
2015
$1,139,465
2014
$790,000
2013
$862,500
2012
$1,094,523
2011
$1,489,444
2010
-
2009
$577,150
2008
$2,150,000
2007
$781,339
2006
$744,078
2005
$515,000
2004
$716,667
2003
$140,000
The Paterno
N/A
Median Price
Past 12 months
Past 12 months
2024
$939,000
2023
$655,000
2022
$475,000
2021
$1,232,500
2020
$3,850,000
2019
$1,100,000
2018
$623,750
2017
$1,650,000
2016
$1,600,000
2015
$1,200,000
2014
$525,000
2013
$785,000
2012
$1,045,297
2011
$1,550,000
2010
-
2009
$577,150
2008
$2,150,000
2007
$837,500
2006
$780,000
2005
$515,000
2004
$700,000
2003
$140,000
The Paterno
N/A
Avg. Price
Past 12 months
Past 12 months
2024
$380,000
2023
-
2022
-
2021
$1,180,000
2020
-
2019
-
2018
-
2017
-
2016
-
2015
-
2014
-
2013
$230,000
2012
-
2011
-
2010
-
2009
-
2008
-
2007
-
2006
-
2005
-
2004
-
2003
$140,000
The Paterno
N/A
Median Price
Past 12 months
Past 12 months
2024
$380,000
2023
-
2022
-
2021
$1,180,000
2020
-
2019
-
2018
-
2017
-
2016
-
2015
-
2014
-
2013
$230,000
2012
-
2011
-
2010
-
2009
-
2008
-
2007
-
2006
-
2005
-
2004
-
2003
$140,000
The Paterno
N/A
Avg. Price
Past 12 months
Past 12 months
2024
-
2023
$655,000
2022
$475,000
2021
-
2020
-
2019
$525,000
2018
$623,750
2017
$690,000
2016
$600,000
2015
$523,345
2014
$525,000
2013
$520,000
2012
-
2011
-
2010
-
2009
$577,150
2008
-
2007
$636,000
2006
$535,000
2005
$515,000
2004
-
2003
-
The Paterno
N/A
Median Price
Past 12 months
Past 12 months
2024
-
2023
$655,000
2022
$475,000
2021
-
2020
-
2019
$525,000
2018
$623,750
2017
$690,000
2016
$600,000
2015
$523,345
2014
$525,000
2013
$520,000
2012
-
2011
-
2010
-
2009
$577,150
2008
-
2007
$636,000
2006
$535,000
2005
$515,000
2004
-
2003
-
The Paterno
N/A
Avg. Price
Past 12 months
Past 12 months
2024
$1,019,500
2023
-
2022
-
2021
$1,285,000
2020
-
2019
-
2018
-
2017
$1,650,000
2016
$1,600,000
2015
$1,200,000
2014
$1,320,000
2013
$1,350,000
2012
$1,094,523
2011
$733,333
2010
-
2009
-
2008
-
2007
$926,677
2006
$848,618
2005
-
2004
$716,667
2003
-
The Paterno
N/A
Median Price
Past 12 months
Past 12 months
2024
$1,019,500
2023
-
2022
-
2021
$1,285,000
2020
-
2019
-
2018
-
2017
$1,650,000
2016
$1,600,000
2015
$1,200,000
2014
$1,320,000
2013
$1,350,000
2012
$1,045,297
2011
$733,333
2010
-
2009
-
2008
-
2007
$926,677
2006
$848,618
2005
-
2004
$700,000
2003
-
The Paterno
N/A
Avg. Price
Past 12 months
Past 12 months
2024
-
2023
-
2022
-
2021
-
2020
-
2019
$1,662,500
2018
-
2017
$1,849,000
2016
-
2015
$1,695,050
2014
-
2013
-
2012
-
2011
$1,867,500
2010
-
2009
-
2008
$2,150,000
2007
-
2006
-
2005
-
2004
-
2003
-
The Paterno
N/A
Median Price
Past 12 months
Past 12 months
2024
-
2023
-
2022
-
2021
-
2020
-
2019
$1,662,500
2018
-
2017
$1,849,000
2016
-
2015
$1,695,050
2014
-
2013
-
2012
-
2011
$1,867,500
2010
-
2009
-
2008
$2,150,000
2007
-
2006
-
2005
-
2004
-
2003
-
The Paterno
N/A
Avg. Price
Past 12 months
Past 12 months
2024
-
2023
-
2022
-
2021
-
2020
$3,850,000
2019
-
2018
-
2017
-
2016
-
2015
-
2014
-
2013
-
2012
-
2011
-
2010
-
2009
-
2008
-
2007
-
2006
-
2005
-
2004
-
2003
-
The Paterno
N/A
Median Price
Past 12 months
Past 12 months
2024
-
2023
-
2022
-
2021
-
2020
$3,850,000
2019
-
2018
-
2017
-
2016
-
2015
-
2014
-
2013
-
2012
-
2011
-
2010
-
2009
-
2008
-
2007
-
2006
-
2005
-
2004
-
2003
-
The Paterno
N/A
Avg. Price
Past 12 months
Past 12 months
2024
-
2023
-
2022
-
2021
-
2020
-
2019
-
2018
-
2017
-
2016
$3,334,431
2015
-
2014
-
2013
-
2012
-
2011
-
2010
-
2009
-
2008
-
2007
-
2006
-
2005
-
2004
-
2003
-
The Paterno
N/A
Median Price
Past 12 months
Past 12 months
2024
-
2023
-
2022
-
2021
-
2020
-
2019
-
2018
-
2017
-
2016
$3,334,431
2015
-
2014
-
2013
-
2012
-
2011
-
2010
-
2009
-
2008
-
2007
-
2006
-
2005
-
2004
-
2003
-
390 Riverside Drive
$1,150
Avg. Price / ft2
Past 12 months
Past 12 months
$1,150
$867
$1,851
-
-
-
-
-
$931
-
-
$775
$774
-
$617
$705
-
-
$679
$705
$531
$400
390 Riverside Drive
$1,900,000
Avg. Price
Past 12 months
Past 12 months
$1,619,625
$989,000
$1,400,000
-
-
$955,000
-
$3,000,000
$947,500
-
$1,412,500
$863,745
$875,000
$612,250
$485,000
$934,338
$737,800
-
$729,563
$1,153,852
$425,000
$309,620
390 Riverside Drive
$1,900,000
Median Price
Past 12 months
Past 12 months
$1,424,250
$800,000
$1,400,000
-
-
$955,000
-
$3,000,000
$947,500
-
$1,412,500
$740,000
$560,000
$612,250
$485,000
$934,338
$737,800
-
$534,500
$1,095,000
$425,000
$309,620
390 Riverside Drive
N/A
Avg. Price / ft2
Past 12 months
Past 12 months
-
-
-
-
-
-
-
-
-
-
-
-
-
-
-
-
-
-
-
-
-
-
390 Riverside Drive
N/A
Avg. Price
Past 12 months
Past 12 months
-
-
-
-
-
-
-
-
-
-
-
-
-
-
-
-
-
-
-
-
-
-
390 Riverside Drive
N/A
Median Price
Past 12 months
Past 12 months
-
-
-
-
-
-
-
-
-
-
-
-
-
-
-
-
-
-
-
-
-
-
390 Riverside Drive
N/A
Avg. Price / ft2
Past 12 months
Past 12 months
-
$867
$1,851
-
-
-
-
-
$931
-
-
$775
$687
-
$617
$705
-
-
$679
$705
$531
$400
390 Riverside Drive
N/A
Avg. Price
Past 12 months
Past 12 months
-
$725,000
$1,400,000
-
-
$735,000
-
-
$745,000
-
$625,000
$654,053
$537,500
$612,250
$485,000
$528,675
$737,800
-
$516,283
$599,000
$425,000
$309,620
390 Riverside Drive
N/A
Median Price
Past 12 months
Past 12 months
-
$725,000
$1,400,000
-
-
$735,000
-
-
$745,000
-
$625,000
$649,506
$537,500
$612,250
$485,000
$528,675
$737,800
-
$525,000
$599,000
$425,000
$309,620
390 Riverside Drive
N/A
Avg. Price / ft2
Past 12 months
Past 12 months
-
-
-
-
-
-
-
-
-
-
-
-
-
-
-
-
-
-
-
-
-
-
390 Riverside Drive
$1,100,000
Avg. Price
Past 12 months
Past 12 months
$964,250
$1,165,000
-
-
-
$1,175,000
-
-
$1,150,000
-
$2,200,000
$902,500
-
-
-
-
-
-
-
$1,370,704
-
-
390 Riverside Drive
$1,100,000
Median Price
Past 12 months
Past 12 months
$964,250
$900,000
-
-
-
$1,175,000
-
-
$1,150,000
-
$2,200,000
$902,500
-
-
-
-
-
-
-
$1,370,704
-
-
390 Riverside Drive
$1,150
Avg. Price / ft2
Past 12 months
Past 12 months
$1,150
-
-
-
-
-
-
-
-
-
-
-
$861
-
-
-
-
-
-
-
-
-
390 Riverside Drive
$2,700,000
Avg. Price
Past 12 months
Past 12 months
$2,275,000
-
-
-
-
-
-
$3,000,000
-
-
-
$1,625,000
$1,550,000
-
-
$1,340,000
-
-
$1,369,403
$1,275,000
-
-
390 Riverside Drive
$2,700,000
Median Price
Past 12 months
Past 12 months
$2,275,000
-
-
-
-
-
-
$3,000,000
-
-
-
$1,625,000
$1,550,000
-
-
$1,340,000
-
-
$1,369,403
$1,275,000
-
-
390 Riverside Drive
N/A
Avg. Price / ft2
Past 12 months
Past 12 months
-
-
-
-
-
-
-
-
-
-
-
-
-
-
-
-
-
-
-
-
-
-
390 Riverside Drive
N/A
Avg. Price
Past 12 months
Past 12 months
-
-
-
-
-
-
-
-
-
-
-
-
-
-
-
-
-
-
-
-
-
-
390 Riverside Drive
N/A
Median Price
Past 12 months
Past 12 months
-
-
-
-
-
-
-
-
-
-
-
-
-
-
-
-
-
-
-
-
-
-
390 Riverside Drive
N/A
Avg. Price / ft2
Past 12 months
Past 12 months
-
-
-
-
-
-
-
-
-
-
-
-
-
-
-
-
-
-
-
-
-
-
390 Riverside Drive
N/A
Avg. Price
Past 12 months
Past 12 months
-
-
-
-
-
-
-
-
-
-
-
-
-
-
-
-
-
-
-
-
-
-
390 Riverside Drive
N/A
Median Price
Past 12 months
Past 12 months
-
-
-
-
-
-
-
-
-
-
-
-
-
-
-
-
-
-
-
-
-
-
The Schuyler Arms
$1,098
Avg. Price / ft2
Past 12 months
Past 12 months
$1,078
-
$1,009
$1,000
-
$1,069
-
-
$940
$1,104
$760
-
-
-
-
$714
$967
$884
$813
$833
-
-
The Schuyler Arms
$1,122,500
Avg. Price
Past 12 months
Past 12 months
$1,209,000
-
$1,238,333
$1,200,000
-
$1,461,667
$1,022,250
$1,185,800
$958,500
$1,087,500
$1,200,000
$1,220,000
$891,250
$1,238,750
-
$663,333
$946,500
$1,175,600
$767,500
$985,600
$903,667
$295,000
The Schuyler Arms
$1,220,000
Median Price
Past 12 months
Past 12 months
$1,209,000
-
$1,150,000
$1,200,000
-
$1,475,000
$1,022,250
$1,075,000
$958,500
$1,068,750
$1,025,000
$1,220,000
$891,250
$965,000
-
$670,000
$900,000
$1,140,000
$767,500
$999,000
$800,000
$295,000
The Schuyler Arms
N/A
Avg. Price / ft2
Past 12 months
Past 12 months
-
-
-
-
-
-
-
-
-
-
-
-
-
-
-
-
-
-
-
-
-
-
The Schuyler Arms
N/A
Avg. Price
Past 12 months
Past 12 months
-
-
-
-
-
-
-
-
-
-
-
-
-
-
-
-
-
-
-
-
-
-
The Schuyler Arms
N/A
Median Price
Past 12 months
Past 12 months
-
-
-
-
-
-
-
-
-
-
-
-
-
-
-
-
-
-
-
-
-
-
The Schuyler Arms
N/A
Avg. Price / ft2
Past 12 months
Past 12 months
$878
-
$840
-
-
$1,013
-
-
$940
-
$760
-
-
-
-
$714
-
-
$813
-
-
-
The Schuyler Arms
$615,000
Avg. Price
Past 12 months
Past 12 months
$768,000
-
$840,000
-
-
$810,000
$929,500
$968,000
$958,500
$762,500
$760,000
-
$783,500
-
-
$625,000
$675,000
-
$650,000
$699,000
-
-
The Schuyler Arms
$615,000
Median Price
Past 12 months
Past 12 months
$768,000
-
$840,000
-
-
$810,000
$929,500
$968,000
$958,500
$762,500
$760,000
-
$783,500
-
-
$625,000
$675,000
-
$650,000
$699,000
-
-
The Schuyler Arms
$1,098
Avg. Price / ft2
Past 12 months
Past 12 months
-
-
$958
$1,000
-
-
-
-
-
$1,104
-
-
-
-
-
-
$967
$902
-
$833
-
-
The Schuyler Arms
$1,249,375
Avg. Price
Past 12 months
Past 12 months
-
-
$1,150,000
$1,200,000
-
-
$1,115,000
$1,240,250
-
$1,387,500
$1,025,000
$1,220,000
$999,000
$951,667
-
$682,500
$1,052,500
$1,044,750
$885,000
$1,057,250
$903,667
$295,000
The Schuyler Arms
$1,235,000
Median Price
Past 12 months
Past 12 months
-
-
$1,150,000
$1,200,000
-
-
$1,115,000
$1,200,000
-
$1,387,500
$1,025,000
$1,220,000
$999,000
$935,000
-
$682,500
$1,130,000
$1,072,000
$885,000
$1,134,500
$800,000
$295,000
The Schuyler Arms
N/A
Avg. Price / ft2
Past 12 months
Past 12 months
$1,279
-
$1,229
-
-
$1,097
-
-
-
-
-
-
-
-
-
-
-
$850
-
-
-
-
The Schuyler Arms
N/A
Avg. Price
Past 12 months
Past 12 months
$1,650,000
-
$1,725,000
-
-
$1,787,500
-
-
-
-
-
-
-
-
-
-
-
$1,699,000
-
-
-
-
The Schuyler Arms
N/A
Median Price
Past 12 months
Past 12 months
$1,650,000
-
$1,725,000
-
-
$1,787,500
-
-
-
-
-
-
-
-
-
-
-
$1,699,000
-
-
-
-
The Schuyler Arms
N/A
Avg. Price / ft2
Past 12 months
Past 12 months
-
-
-
-
-
-
-
-
-
-
-
-
-
-
-
-
-
-
-
-
-
-
The Schuyler Arms
N/A
Avg. Price
Past 12 months
Past 12 months
-
-
-
-
-
-
-
-
-
-
$1,990,000
-
-
$2,100,000
-
-
$900,000
-
-
-
-
-
The Schuyler Arms
N/A
Median Price
Past 12 months
Past 12 months
-
-
-
-
-
-
-
-
-
-
$1,990,000
-
-
$2,100,000
-
-
$900,000
-
-
-
-
-
The Schuyler Arms
N/A
Avg. Price / ft2
Past 12 months
Past 12 months
-
-
-
-
-
-
-
-
-
-
-
-
-
-
-
-
-
-
-
-
-
-
The Schuyler Arms
N/A
Avg. Price
Past 12 months
Past 12 months
-
-
-
-
-
-
-
-
-
-
-
-
-
-
-
-
-
-
-
-
-
-
The Schuyler Arms
N/A
Median Price
Past 12 months
Past 12 months
-
-
-
-
-
-
-
-
-
-
-
-
-
-
-
-
-
-
-
-
-
-
395 Riverside Drive
$1,033
Avg. Price / ft2
Past 12 months
Past 12 months
-
-
-
-
-
-
$633
$1,174
-
-
$995
$873
-
$735
-
$702
$842
-
$695
-
$585
$514
395 Riverside Drive
$1,092,000
Avg. Price
Past 12 months
Past 12 months
$1,094,583
$1,816,667
$610,000
$1,562,500
-
-
$570,000
$1,130,000
$1,461,667
$1,152,500
$1,008,000
$1,157,017
$532,500
$898,715
-
$762,092
$957,000
$800,500
$720,293
$550,000
$513,505
$752,450
395 Riverside Drive
$1,092,000
Median Price
Past 12 months
Past 12 months
$742,500
$2,100,000
$610,000
$1,562,500
-
-
$570,000
$1,197,500
$830,000
$1,152,500
$742,000
$1,157,017
$532,500
$625,000
-
$760,277
$964,535
$867,500
$649,000
$550,000
$542,011
$731,719
395 Riverside Drive
N/A
Avg. Price / ft2
Past 12 months
Past 12 months
-
-
-
-
-
-
-
-
-
-
-
-
-
-
-
-
-
-
-
-
-
-
395 Riverside Drive
N/A
Avg. Price
Past 12 months
Past 12 months
-
-
-
-
-
-
-
-
-
-
-
-
-
-
-
-
-
-
-
-
-
-
395 Riverside Drive
N/A
Median Price
Past 12 months
Past 12 months
-
-
-
-
-
-
-
-
-
-
-
-
-
-
-
-
-
-
-
-
-
-
395 Riverside Drive
N/A
Avg. Price / ft2
Past 12 months
Past 12 months
-
-
-
-
-
-
$633
-
-
-
$989
$873
-
-
-
-
-
-
$647
-
-
-
395 Riverside Drive
N/A
Avg. Price
Past 12 months
Past 12 months
$718,750
-
$610,000
-
-
-
$570,000
$775,000
$755,000
-
$665,000
$655,000
$532,500
-
-
-
$655,000
-
$503,000
$365,000
$325,000
-
395 Riverside Drive
N/A
Median Price
Past 12 months
Past 12 months
$718,750
-
$610,000
-
-
-
$570,000
$775,000
$755,000
-
$668,000
$655,000
$532,500
-
-
-
$655,000
-
$485,000
$365,000
$325,000
-
395 Riverside Drive
$1,033
Avg. Price / ft2
Past 12 months
Past 12 months
-
-
-
-
-
-
-
$1,174
-
-
$1,000
-
-
$735
-
$702
$842
-
$744
-
$585
$514
395 Riverside Drive
$1,092,000
Avg. Price
Past 12 months
Past 12 months
$1,846,250
$1,675,000
-
$1,562,500
-
-
-
$1,248,333
$2,875,000
$1,152,500
$1,100,000
$1,659,033
-
$1,228,333
-
$762,092
$1,010,465
$1,150,833
$1,046,234
$735,000
$576,340
$764,925
395 Riverside Drive
$1,092,000
Median Price
Past 12 months
Past 12 months
$1,846,250
$1,675,000
-
$1,562,500
-
-
-
$1,210,000
$2,875,000
$1,152,500
$1,100,000
$1,659,033
-
$780,000
-
$760,277
$1,010,465
$885,000
$1,046,234
$735,000
$587,000
$748,296
395 Riverside Drive
N/A
Avg. Price / ft2
Past 12 months
Past 12 months
-
-
-
-
-
-
-
-
-
-
-
-
-
-
-
-
-
-
-
-
-
-
395 Riverside Drive
N/A
Avg. Price
Past 12 months
Past 12 months
-
-
-
-
-
-
-
-
-
-
$1,945,000
-
-
-
-
-
$1,500,000
-
-
-
-
-
395 Riverside Drive
N/A
Median Price
Past 12 months
Past 12 months
-
-
-
-
-
-
-
-
-
-
$1,945,000
-
-
-
-
-
$1,500,000
-
-
-
-
-
395 Riverside Drive
N/A
Avg. Price / ft2
Past 12 months
Past 12 months
-
-
-
-
-
-
-
-
-
-
-
-
-
-
-
-
-
-
-
-
-
-
395 Riverside Drive
N/A
Avg. Price
Past 12 months
Past 12 months
-
$2,100,000
-
-
-
-
-
-
-
-
-
-
-
-
-
-
-
-
-
-
-
-
395 Riverside Drive
N/A
Median Price
Past 12 months
Past 12 months
-
$2,100,000
-
-
-
-
-
-
-
-
-
-
-
-
-
-
-
-
-
-
-
-
395 Riverside Drive
N/A
Avg. Price / ft2
Past 12 months
Past 12 months
-
-
-
-
-
-
-
-
-
-
-
-
-
-
-
-
-
-
-
-
-
-
395 Riverside Drive
N/A
Avg. Price
Past 12 months
Past 12 months
-
-
-
-
-
-
-
-
-
-
-
-
-
-
-
-
-
-
-
-
-
-
395 Riverside Drive
N/A
Median Price
Past 12 months
Past 12 months
-
-
-
-
-
-
-
-
-
-
-
-
-
-
-
-
-
-
-
-
-
-
370 Riverside Drive
$1,030
Avg. Price / ft2
Past 12 months
Past 12 months
-
$901
$955
-
-
-
$1,275
-
-
$1,535
$1,240
$1,390
-
$754
$953
$765
$985
$662
$845
-
-
$767
370 Riverside Drive
$1,220,000
Avg. Price
Past 12 months
Past 12 months
$1,727,500
$1,546,305
$1,575,000
-
-
$1,712,500
$2,235,000
$1,155,000
$883,875
$2,610,000
$2,153,750
$1,280,000
-
$1,252,500
$1,715,000
$1,097,500
$1,280,000
$1,141,250
$1,149,500
$975,000
$898,333
$964,800
370 Riverside Drive
$1,220,000
Median Price
Past 12 months
Past 12 months
$1,727,500
$1,697,500
$1,575,000
-
-
$1,712,500
$2,235,000
$1,155,000
$883,875
$2,610,000
$2,153,750
$895,000
-
$1,125,000
$1,715,000
$1,097,500
$1,280,000
$907,500
$1,149,500
$975,000
$825,000
$1,080,000
370 Riverside Drive
N/A
Avg. Price / ft2
Past 12 months
Past 12 months
-
-
-
-
-
-
-
-
-
-
-
-
-
-
-
-
-
-
-
-
-
-
370 Riverside Drive
N/A
Avg. Price
Past 12 months
Past 12 months
-
-
-
-
-
-
-
-
-
-
-
$442,500
-
-
-
-
-
-
-
-
-
-
370 Riverside Drive
N/A
Median Price
Past 12 months
Past 12 months
-
-
-
-
-
-
-
-
-
-
-
$442,500
-
-
-
-
-
-
-
-
-
-
370 Riverside Drive
N/A
Avg. Price / ft2
Past 12 months
Past 12 months
-
-
-
-
-
-
-
-
-
-
-
-
-
-
-
-
-
-
-
-
-
-
370 Riverside Drive
N/A
Avg. Price
Past 12 months
Past 12 months
-
-
-
-
-
-
-
-
-
-
-
-
-
-
-
-
-
-
-
-
-
-
370 Riverside Drive
N/A
Median Price
Past 12 months
Past 12 months
-
-
-
-
-
-
-
-
-
-
-
-
-
-
-
-
-
-
-
-
-
-
370 Riverside Drive
N/A
Avg. Price / ft2
Past 12 months
Past 12 months
-
$756
-
-
-
-
-
-
-
$1,535
$1,240
-
-
$754
-
$765
$985
$662
$845
-
-
$767
370 Riverside Drive
N/A
Avg. Price
Past 12 months
Past 12 months
$2,200,000
$945,000
-
-
-
-
$2,175,000
-
$883,875
$2,610,000
$1,612,500
$895,000
-
$1,252,500
-
$995,000
$1,280,000
$1,141,250
$1,149,500
$975,000
$898,333
$964,800
370 Riverside Drive
N/A
Median Price
Past 12 months
Past 12 months
$2,200,000
$945,000
-
-
-
-
$2,175,000
-
$883,875
$2,610,000
$1,612,500
$895,000
-
$1,125,000
-
$995,000
$1,280,000
$907,500
$1,149,500
$975,000
$825,000
$1,080,000
370 Riverside Drive
$1,030
Avg. Price / ft2
Past 12 months
Past 12 months
-
$1,046
$955
-
-
-
$1,275
-
-
-
-
$1,390
-
-
$953
-
-
-
-
-
-
-
370 Riverside Drive
$1,220,000
Avg. Price
Past 12 months
Past 12 months
$1,255,000
$1,666,565
$1,575,000
-
-
$1,712,500
$2,295,000
$1,155,000
-
-
$2,695,000
$2,502,500
-
-
$1,715,000
$1,200,000
-
-
-
-
-
-
370 Riverside Drive
$1,220,000
Median Price
Past 12 months
Past 12 months
$1,255,000
$1,700,000
$1,575,000
-
-
$1,712,500
$2,295,000
$1,155,000
-
-
$2,695,000
$2,502,500
-
-
$1,715,000
$1,200,000
-
-
-
-
-
-
370 Riverside Drive
N/A
Avg. Price / ft2
Past 12 months
Past 12 months
-
-
-
-
-
-
-
-
-
-
-
-
-
-
-
-
-
-
-
-
-
-
370 Riverside Drive
N/A
Avg. Price
Past 12 months
Past 12 months
-
-
-
-
-
-
-
-
-
-
-
-
-
-
-
-
-
-
-
-
-
-
370 Riverside Drive
N/A
Median Price
Past 12 months
Past 12 months
-
-
-
-
-
-
-
-
-
-
-
-
-
-
-
-
-
-
-
-
-
-
370 Riverside Drive
N/A
Avg. Price / ft2
Past 12 months
Past 12 months
-
-
-
-
-
-
-
-
-
-
-
-
-
-
-
-
-
-
-
-
-
-
370 Riverside Drive
N/A
Avg. Price
Past 12 months
Past 12 months
-
-
-
-
-
-
-
-
-
-
-
-
-
-
-
-
-
-
-
-
-
-
370 Riverside Drive
N/A
Median Price
Past 12 months
Past 12 months
-
-
-
-
-
-
-
-
-
-
-
-
-
-
-
-
-
-
-
-
-
-
535 West 110th Street
$947
Avg. Price / ft2
Past 12 months
Past 12 months
-
$880
$1,146
$838
$1,229
$1,089
$963
$1,049
$1,023
$930
$877
$809
$741
$679
$823
$799
$839
$741
$755
$650
$484
-
535 West 110th Street
$1,000,000
Avg. Price
Past 12 months
Past 12 months
$860,000
$591,550
$1,481,800
$779,625
$552,500
$1,126,250
$657,000
$1,236,500
$1,360,679
$913,380
$794,500
$629,818
$920,286
$567,506
$721,563
$630,614
$612,063
$731,753
$768,132
$559,379
$451,621
-
535 West 110th Street
$750,000
Median Price
Past 12 months
Past 12 months
$860,000
$570,650
$1,480,000
$829,250
$552,500
$826,250
$697,500
$914,500
$1,241,000
$999,900
$650,000
$647,500
$628,000
$516,966
$715,000
$530,000
$659,000
$699,000
$653,500
$543,130
$388,355
-
535 West 110th Street
N/A
Avg. Price / ft2
Past 12 months
Past 12 months
-
-
-
-
-
-
-
-
-
-
-
-
-
-
-
-
-
-
-
-
$627
-
535 West 110th Street
N/A
Avg. Price
Past 12 months
Past 12 months
-
-
-
-
-
-
-
-
-
-
-
$378,024
-
-
-
$185,029
-
-
-
$319,807
$322,628
-
535 West 110th Street
N/A
Median Price
Past 12 months
Past 12 months
-
-
-
-
-
-
-
-
-
-
-
$378,024
-
-
-
$185,029
-
-
-
$319,807
$322,628
-
535 West 110th Street
$947
Avg. Price / ft2
Past 12 months
Past 12 months
-
$880
$1,018
$747
$1,229
-
$963
$941
$733
$871
$890
$851
$676
$680
$804
$852
$850
$618
$877
$646
$468
-
535 West 110th Street
$1,000,000
Avg. Price
Past 12 months
Past 12 months
-
$591,550
$460,000
$560,000
$552,500
$572,500
$657,000
$689,667
$616,875
$403,500
$569,800
$558,333
$506,667
$455,358
$523,904
$526,514
$529,511
$527,097
$534,937
$429,583
$355,731
-
535 West 110th Street
$750,000
Median Price
Past 12 months
Past 12 months
-
$570,650
$460,000
$560,000
$552,500
$572,500
$697,500
$670,000
$616,875
$403,500
$595,000
$605,000
$500,000
$440,399
$523,904
$520,000
$475,000
$605,000
$631,890
$422,584
$332,010
-
535 West 110th Street
N/A
Avg. Price / ft2
Past 12 months
Past 12 months
-
-
$1,303
$868
-
$998
-
$1,050
$1,167
$968
$839
$766
$687
$675
$832
$719
$818
$814
$694
$653
$481
-
535 West 110th Street
N/A
Avg. Price
Past 12 months
Past 12 months
$860,000
-
$1,487,000
$852,833
-
$997,500
-
$1,200,000
$1,404,000
$1,253,300
$852,625
$765,958
$840,667
$791,802
$820,393
$865,471
$818,443
$811,619
$879,500
$701,997
$631,682
-
535 West 110th Street
N/A
Median Price
Past 12 months
Past 12 months
$860,000
-
$1,487,000
$858,500
-
$997,500
-
$1,200,000
$1,383,000
$1,250,000
$844,000
$750,000
$699,000
$791,802
$754,536
$795,000
$818,443
$762,242
$810,000
$752,286
$606,900
-
535 West 110th Street
N/A
Avg. Price / ft2
Past 12 months
Past 12 months
-
-
$1,021
-
-
-
-
-
-
-
-
-
-
-
-
-
-
-
-
-
-
-
535 West 110th Street
N/A
Avg. Price
Past 12 months
Past 12 months
-
-
$1,480,000
-
-
-
-
-
$2,675,000
-
-
-
-
-
-
-
-
-
$1,600,000
-
$1,027,570
-
535 West 110th Street
N/A
Median Price
Past 12 months
Past 12 months
-
-
$1,480,000
-
-
-
-
-
$2,675,000
-
-
-
-
-
-
-
-
-
$1,600,000
-
$1,027,570
-
535 West 110th Street
N/A
Avg. Price / ft2
Past 12 months
Past 12 months
-
-
$1,085
-
-
$1,181
-
$1,372
-
-
-
-
$1,043
-
-
-
-
$865
-
-
-
-
535 West 110th Street
N/A
Avg. Price
Past 12 months
Past 12 months
-
-
$2,495,000
-
-
$2,362,500
-
$2,950,000
-
-
$2,130,000
-
$2,400,000
-
-
-
-
$1,730,076
-
-
-
-
535 West 110th Street
N/A
Median Price
Past 12 months
Past 12 months
-
-
$2,495,000
-
-
$2,362,500
-
$2,950,000
-
-
$2,130,000
-
$2,400,000
-
-
-
-
$1,730,076
-
-
-
-
535 West 110th Street
N/A
Avg. Price / ft2
Past 12 months
Past 12 months
-
-
-
-
-
-
-
-
-
-
-
-
-
-
-
-
-
-
-
-
-
-
535 West 110th Street
N/A
Avg. Price
Past 12 months
Past 12 months
-
-
-
-
-
-
-
-
-
-
-
-
-
-
-
-
-
-
-
-
-
-
535 West 110th Street
N/A
Median Price
Past 12 months
Past 12 months
-
-
-
-
-
-
-
-
-
-
-
-
-
-
-
-
-
-
-
-
-
-
The Hendrik Hudson
$838
Avg. Price / ft2
Past 12 months
Past 12 months
$789
$684
-
-
-
$957
-
$1,046
$824
$958
-
-
$760
$740
$615
$536
$819
$674
$733
$744
$760
-
The Hendrik Hudson
$610,000
Avg. Price
Past 12 months
Past 12 months
$2,001,250
$1,475,000
$535,000
-
-
$1,310,000
$1,072,500
$832,000
$540,000
$1,248,000
$1,750,000
$505,000
$395,571
$444,000
$800,000
$375,000
$1,638,750
$498,750
$470,000
$649,385
$1,076,750
$737,425
The Hendrik Hudson
$610,000
Median Price
Past 12 months
Past 12 months
$2,412,500
$1,595,000
$535,000
-
-
$650,000
$1,072,500
$623,500
$540,000
$690,000
$1,750,000
$455,000
$425,000
$444,000
$800,000
$375,000
$1,547,500
$465,000
$470,000
$534,500
$1,081,000
$570,000
The Hendrik Hudson
N/A
Avg. Price / ft2
Past 12 months
Past 12 months
-
-
-
-
-
-
-
-
-
-
-
-
$776
-
-
-
-
-
-
$816
-
-
The Hendrik Hudson
N/A
Avg. Price
Past 12 months
Past 12 months
-
-
-
-
-
-
-
-
-
-
-
$425,000
$275,000
-
-
-
-
-
-
$310,000
-
-
The Hendrik Hudson
N/A
Median Price
Past 12 months
Past 12 months
-
-
-
-
-
-
-
-
-
-
-
$425,000
$275,000
-
-
-
-
-
-
$310,000
-
-
The Hendrik Hudson
$838
Avg. Price / ft2
Past 12 months
Past 12 months
$789
$684
-
-
-
$765
-
$1,046
$824
$958
-
-
$744
$740
-
$536
$692
$674
$733
$671
-
-
The Hendrik Hudson
$610,000
Avg. Price
Past 12 months
Past 12 months
$530,000
$530,000
$535,000
-
-
$585,000
$645,000
$565,667
$540,000
$670,000
-
$413,750
$443,800
$444,000
-
$375,000
$492,500
$498,750
$470,000
$534,500
$365,000
$349,850
The Hendrik Hudson
$610,000
Median Price
Past 12 months
Past 12 months
$530,000
$530,000
$535,000
-
-
$585,000
$645,000
$515,000
$540,000
$670,000
-
$455,000
$433,000
$444,000
-
$375,000
$492,500
$465,000
$470,000
$534,500
$365,000
$349,850
The Hendrik Hudson
N/A
Avg. Price / ft2
Past 12 months
Past 12 months
-
-
-
-
-
-
-
-
-
-
-
-
-
-
$615
-
-
-
-
-
-
-
The Hendrik Hudson
N/A
Avg. Price
Past 12 months
Past 12 months
-
-
-
-
-
-
$1,500,000
$1,631,000
-
-
-
$950,000
-
-
$800,000
-
-
-
-
-
-
-
The Hendrik Hudson
N/A
Median Price
Past 12 months
Past 12 months
-
-
-
-
-
-
$1,500,000
$1,631,000
-
-
-
$950,000
-
-
$800,000
-
-
-
-
-
-
-
The Hendrik Hudson
N/A
Avg. Price / ft2
Past 12 months
Past 12 months
-
-
-
-
-
-
-
-
-
-
-
-
-
-
-
-
-
-
-
-
-
-
The Hendrik Hudson
N/A
Avg. Price
Past 12 months
Past 12 months
$2,537,500
-
-
-
-
-
-
-
-
$2,404,000
$1,750,000
-
-
-
-
-
$2,995,000
-
-
$1,218,540
$1,752,000
$1,125,000
The Hendrik Hudson
N/A
Median Price
Past 12 months
Past 12 months
$2,537,500
-
-
-
-
-
-
-
-
$2,404,000
$1,750,000
-
-
-
-
-
$2,995,000
-
-
$1,218,540
$1,752,000
$1,125,000
The Hendrik Hudson
N/A
Avg. Price / ft2
Past 12 months
Past 12 months
-
-
-
-
-
$1,150
-
-
-
-
-
-
-
-
-
-
$1,073
-
-
-
$760
-
The Hendrik Hudson
N/A
Avg. Price
Past 12 months
Past 12 months
$2,400,000
$1,595,000
-
-
-
$2,760,000
-
-
-
-
-
-
-
-
-
-
$2,575,000
-
-
-
$1,825,000
-
The Hendrik Hudson
N/A
Median Price
Past 12 months
Past 12 months
$2,400,000
$1,595,000
-
-
-
$2,760,000
-
-
-
-
-
-
-
-
-
-
$2,575,000
-
-
-
$1,825,000
-
The Hendrik Hudson
N/A
Avg. Price / ft2
Past 12 months
Past 12 months
-
-
-
-
-
-
-
-
-
-
-
-
-
-
-
-
-
-
-
-
-
-
The Hendrik Hudson
N/A
Avg. Price
Past 12 months
Past 12 months
-
-
-
-
-
-
-
-
-
-
-
-
-
-
-
-
-
-
-
-
-
-
The Hendrik Hudson
N/A
Median Price
Past 12 months
Past 12 months
-
-
-
-
-
-
-
-
-
-
-
-
-
-
-
-
-
-
-
-
-
-
Fowler Court
$242
Avg. Price / ft2
Past 12 months
Past 12 months
$1,124
-
$870
$829
-
$781
$1,533
$993
$1,000
-
-
$780
$747
$714
$903
-
$803
$903
$957
$862
-
-
Fowler Court
$435,000
Avg. Price
Past 12 months
Past 12 months
$931,250
$1,795,000
$1,150,000
$870,000
-
$637,000
$2,300,000
$662,500
$1,315,000
$2,506,250
$690,000
$780,000
$821,250
$895,000
$542,000
-
$684,500
$1,625,000
$1,435,000
$977,500
-
-
Fowler Court
$435,000
Median Price
Past 12 months
Past 12 months
$900,000
$1,795,000
$1,150,000
$870,000
-
$637,000
$2,300,000
$662,500
$1,315,000
$2,506,250
$690,000
$780,000
$821,250
$700,000
$542,000
-
$689,000
$1,625,000
$1,435,000
$1,140,000
-
-
Fowler Court
N/A
Avg. Price / ft2
Past 12 months
Past 12 months
-
-
-
-
-
-
-
-
-
-
-
-
-
-
-
-
-
-
-
-
-
-
Fowler Court
N/A
Avg. Price
Past 12 months
Past 12 months
-
-
-
-
-
-
-
-
-
-
-
-
-
-
-
-
-
-
-
-
-
-
Fowler Court
N/A
Median Price
Past 12 months
Past 12 months
-
-
-
-
-
-
-
-
-
-
-
-
-
-
-
-
-
-
-
-
-
-
Fowler Court
N/A
Avg. Price / ft2
Past 12 months
Past 12 months
-
-
-
-
-
$766
-
$993
-
-
-
-
-
$759
$903
-
$876
-
-
-
-
-
Fowler Court
N/A
Avg. Price
Past 12 months
Past 12 months
-
-
-
-
-
$479,000
-
$662,500
-
-
$690,000
-
-
$550,000
$542,000
-
$635,000
-
-
-
-
-
Fowler Court
N/A
Median Price
Past 12 months
Past 12 months
-
-
-
-
-
$479,000
-
$662,500
-
-
$690,000
-
-
$550,000
$542,000
-
$635,000
-
-
-
-
-
Fowler Court
N/A
Avg. Price / ft2
Past 12 months
Past 12 months
-
-
-
$829
-
$795
$1,533
-
-
-
-
$780
$747
$538
-
-
$730
-
$957
$862
-
-
Fowler Court
N/A
Avg. Price
Past 12 months
Past 12 months
-
-
-
$870,000
-
$795,000
$2,300,000
-
$730,000
-
-
$780,000
$821,250
$700,000
-
-
$709,250
-
$1,435,000
$791,250
-
-
Fowler Court
N/A
Median Price
Past 12 months
Past 12 months
-
-
-
$870,000
-
$795,000
$2,300,000
-
$730,000
-
-
$780,000
$821,250
$700,000
-
-
$709,250
-
$1,435,000
$791,250
-
-
Fowler Court
$242
Avg. Price / ft2
Past 12 months
Past 12 months
$1,124
-
-
-
-
-
-
-
-
-
-
-
-
$844
-
-
-
$903
-
-
-
-
Fowler Court
$435,000
Avg. Price
Past 12 months
Past 12 months
$1,600,000
$1,795,000
-
-
-
-
-
-
-
-
-
-
-
$1,435,000
-
-
-
$1,625,000
-
$1,350,000
-
-
Fowler Court
$435,000
Median Price
Past 12 months
Past 12 months
$1,600,000
$1,795,000
-
-
-
-
-
-
-
-
-
-
-
$1,435,000
-
-
-
$1,625,000
-
$1,350,000
-
-
Fowler Court
N/A
Avg. Price / ft2
Past 12 months
Past 12 months
-
-
$870
-
-
-
-
-
$1,000
-
-
-
-
-
-
-
-
-
-
-
-
-
Fowler Court
N/A
Avg. Price
Past 12 months
Past 12 months
-
-
$1,150,000
-
-
-
-
-
$1,900,000
$2,506,250
-
-
-
-
-
-
-
-
-
-
-
-
Fowler Court
N/A
Median Price
Past 12 months
Past 12 months
-
-
$1,150,000
-
-
-
-
-
$1,900,000
$2,506,250
-
-
-
-
-
-
-
-
-
-
-
-
Fowler Court
N/A
Avg. Price / ft2
Past 12 months
Past 12 months
-
-
-
-
-
-
-
-
-
-
-
-
-
-
-
-
-
-
-
-
-
-
Fowler Court
N/A
Avg. Price
Past 12 months
Past 12 months
-
-
-
-
-
-
-
-
-
-
-
-
-
-
-
-
-
-
-
-
-
-
Fowler Court
N/A
Median Price
Past 12 months
Past 12 months
-
-
-
-
-
-
-
-
-
-
-
-
-
-
-
-
-
-
-
-
-
-
The Cornwall
N/A
Avg. Price / ft2
Past 12 months
Past 12 months
-
-
$1,687
-
-
$1,061
-
-
$1,000
-
$1,479
-
$1,470
$761
-
-
-
-
-
$1,250
-
$515
The Cornwall
N/A
Avg. Price
Past 12 months
Past 12 months
$4,650,000
-
$3,600,000
-
-
$875,000
$2,087,413
-
$1,562,500
$1,977,500
$2,898,000
$2,778,400
$2,185,000
$1,515,833
-
-
-
$2,941,667
$1,092,667
$2,562,550
-
$425,000
The Cornwall
N/A
Median Price
Past 12 months
Past 12 months
$4,650,000
-
$3,600,000
-
-
$875,000
$2,087,413
-
$1,562,500
$1,977,500
$2,898,000
$2,667,000
$2,185,000
$1,725,000
-
-
-
$3,200,000
$700,000
$2,562,550
-
$425,000
The Cornwall
N/A
Avg. Price / ft2
Past 12 months
Past 12 months
-
-
-
-
-
-
-
-
-
-
-
-
-
-
-
-
-
-
-
-
-
-
The Cornwall
N/A
Avg. Price
Past 12 months
Past 12 months
-
-
-
-
-
-
-
-
-
-
-
-
-
-
-
-
-
-
-
-
-
-
The Cornwall
N/A
Median Price
Past 12 months
Past 12 months
-
-
-
-
-
-
-
-
-
-
-
-
-
-
-
-
-
-
-
-
-
-
The Cornwall
N/A
Avg. Price / ft2
Past 12 months
Past 12 months
-
-
-
-
-
$1,061
-
-
$1,000
-
-
-
-
$761
-
-
-
-
-
-
-
$515
The Cornwall
N/A
Avg. Price
Past 12 months
Past 12 months
-
-
-
-
-
$875,000
-
-
$825,000
-
-
-
-
$627,500
-
-
-
-
-
-
-
$425,000
The Cornwall
N/A
Median Price
Past 12 months
Past 12 months
-
-
-
-
-
$875,000
-
-
$825,000
-
-
-
-
$627,500
-
-
-
-
-
-
-
$425,000
The Cornwall
N/A
Avg. Price / ft2
Past 12 months
Past 12 months
-
-
-
-
-
-
-
-
-
-
-
-
-
-
-
-
-
-
-
-
-
-
The Cornwall
N/A
Avg. Price
Past 12 months
Past 12 months
-
-
-
-
-
-
-
-
-
$780,000
-
-
$695,000
-
-
-
-
-
$664,000
-
-
-
The Cornwall
N/A
Median Price
Past 12 months
Past 12 months
-
-
-
-
-
-
-
-
-
$780,000
-
-
$695,000
-
-
-
-
-
$664,000
-
-
-
The Cornwall
N/A
Avg. Price / ft2
Past 12 months
Past 12 months
-
-
-
-
-
-
-
-
-
-
$1,552
-
-
-
-
-
-
-
-
-
-
-
The Cornwall
N/A
Avg. Price
Past 12 months
Past 12 months
-
-
-
-
-
-
-
-
$2,300,000
-
$2,796,000
$2,297,333
-
$1,960,000
-
-
-
$1,425,000
$1,950,000
$2,000,100
-
-
The Cornwall
N/A
Median Price
Past 12 months
Past 12 months
-
-
-
-
-
-
-
-
$2,300,000
-
$2,796,000
$2,250,000
-
$1,960,000
-
-
-
$1,425,000
$1,950,000
$2,000,100
-
-
The Cornwall
N/A
Avg. Price / ft2
Past 12 months
Past 12 months
-
-
$1,687
-
-
-
-
-
-
-
$1,406
-
$1,470
-
-
-
-
-
-
$1,250
-
-
The Cornwall
N/A
Avg. Price
Past 12 months
Past 12 months
$4,650,000
-
$3,600,000
-
-
-
$2,087,413
-
-
$3,175,000
$3,000,000
$3,500,000
$3,675,000
-
-
-
-
$3,700,000
-
$3,125,000
-
-
The Cornwall
N/A
Median Price
Past 12 months
Past 12 months
$4,650,000
-
$3,600,000
-
-
-
$2,087,413
-
-
$3,175,000
$3,000,000
$3,500,000
$3,675,000
-
-
-
-
$3,700,000
-
$3,125,000
-
-
The Cornwall
N/A
Avg. Price / ft2
Past 12 months
Past 12 months
-
-
-
-
-
-
-
-
-
-
-
-
-
-
-
-
-
-
-
-
-
-
The Cornwall
N/A
Avg. Price
Past 12 months
Past 12 months
-
-
-
-
-
-
-
-
-
-
-
-
-
-
-
-
-
-
-
-
-
-
The Cornwall
N/A
Median Price
Past 12 months
Past 12 months
-
-
-
-
-
-
-
-
-
-
-
-
-
-
-
-
-
-
-
-
-
-
The Strathmore
N/A
Avg. Price / ft2
Past 12 months
Past 12 months
-
-
$1,417
-
-
-
-
$1,425
-
-
-
-
-
-
-
-
-
$700
-
-
$521
-
The Strathmore
$1,800,000
Avg. Price
Past 12 months
Past 12 months
-
-
$2,175,000
-
-
-
-
$3,013,750
$2,200,000
$2,250,000
$1,627,500
-
$2,019,662
$1,630,000
-
-
$1,752,000
$3,143,333
$1,722,500
$2,202,500
$688,000
$525,000
The Strathmore
$1,800,000
Median Price
Past 12 months
Past 12 months
-
-
$2,175,000
-
-
-
-
$2,685,000
$2,200,000
$2,250,000
$1,627,500
-
$2,019,662
$1,630,000
-
-
$1,752,000
$4,200,000
$1,722,500
$1,467,500
$730,000
$525,000
The Strathmore
N/A
Avg. Price / ft2
Past 12 months
Past 12 months
-
-
-
-
-
-
-
-
-
-
-
-
-
-
-
-
-
-
-
-
-
-
The Strathmore
N/A
Avg. Price
Past 12 months
Past 12 months
-
-
-
-
-
-
-
-
-
-
-
-
-
-
-
-
-
-
-
-
-
-
The Strathmore
N/A
Median Price
Past 12 months
Past 12 months
-
-
-
-
-
-
-
-
-
-
-
-
-
-
-
-
-
-
-
-
-
-
The Strathmore
N/A
Avg. Price / ft2
Past 12 months
Past 12 months
-
-
-
-
-
-
-
-
-
-
-
-
-
-
-
-
-
-
-
-
-
-
The Strathmore
N/A
Avg. Price
Past 12 months
Past 12 months
-
-
-
-
-
-
-
$1,720,000
-
-
-
-
$2,019,662
-
-
-
$1,379,000
-
-
$980,000
$585,000
$525,000
The Strathmore
N/A
Median Price
Past 12 months
Past 12 months
-
-
-
-
-
-
-
$1,720,000
-
-
-
-
$2,019,662
-
-
-
$1,379,000
-
-
$980,000
$585,000
$525,000
The Strathmore
N/A
Avg. Price / ft2
Past 12 months
Past 12 months
-
-
$1,417
-
-
-
-
-
-
-
-
-
-
-
-
-
-
$700
-
-
$521
-
The Strathmore
N/A
Avg. Price
Past 12 months
Past 12 months
-
-
$2,175,000
-
-
-
-
$1,485,000
$2,200,000
$2,250,000
$1,627,500
-
-
$1,630,000
-
-
-
$980,000
$1,795,000
-
$739,500
-
The Strathmore
N/A
Median Price
Past 12 months
Past 12 months
-
-
$2,175,000
-
-
-
-
$1,485,000
$2,200,000
$2,250,000
$1,627,500
-
-
$1,630,000
-
-
-
$980,000
$1,795,000
-
$739,500
-
The Strathmore
N/A
Avg. Price / ft2
Past 12 months
Past 12 months
-
-
-
-
-
-
-
-
-
-
-
-
-
-
-
-
-
-
-
-
-
-
The Strathmore
$1,800,000
Avg. Price
Past 12 months
Past 12 months
-
-
-
-
-
-
-
$3,650,000
-
-
-
-
-
-
-
-
-
-
-
-
-
-
The Strathmore
$1,800,000
Median Price
Past 12 months
Past 12 months
-
-
-
-
-
-
-
$3,650,000
-
-
-
-
-
-
-
-
-
-
-
-
-
-
The Strathmore
N/A
Avg. Price / ft2
Past 12 months
Past 12 months
-
-
-
-
-
-
-
$1,425
-
-
-
-
-
-
-
-
-
-
-
-
-
-
The Strathmore
N/A
Avg. Price
Past 12 months
Past 12 months
-
-
-
-
-
-
-
$5,200,000
-
-
-
-
-
-
-
-
-
$4,225,000
-
-
-
-
The Strathmore
N/A
Median Price
Past 12 months
Past 12 months
-
-
-
-
-
-
-
$5,200,000
-
-
-
-
-
-
-
-
-
$4,225,000
-
-
-
-
The Strathmore
N/A
Avg. Price / ft2
Past 12 months
Past 12 months
-
-
-
-
-
-
-
-
-
-
-
-
-
-
-
-
-
-
-
-
-
-
The Strathmore
N/A
Avg. Price
Past 12 months
Past 12 months
-
-
-
-
-
-
-
-
-
-
-
-
-
-
-
-
-
-
-
$4,950,000
-
-
The Strathmore
N/A
Median Price
Past 12 months
Past 12 months
-
-
-
-
-
-
-
-
-
-
-
-
-
-
-
-
-
-
-
$4,950,000
-
-
375 Riverside Drive
N/A
Avg. Price / ft2
Past 12 months
Past 12 months
-
$958
$1,065
-
$1,370
$1,083
$858
-
-
-
$765
$867
$445
$854
$883
$888
-
-
$975
$794
-
-
375 Riverside Drive
N/A
Avg. Price
Past 12 months
Past 12 months
$985,000
$1,103,750
$1,215,218
-
$1,575,000
$1,150,050
$1,259,875
$675,000
$1,297,500
$1,488,250
$1,435,000
$1,064,429
$551,667
$1,045,320
$981,092
$1,670,000
$1,105,000
$1,290,600
$1,378,220
$799,833
-
$652,500
375 Riverside Drive
N/A
Median Price
Past 12 months
Past 12 months
$985,000
$1,103,750
$1,000,654
-
$1,575,000
$1,150,050
$997,000
$675,000
$1,297,500
$1,488,250
$1,435,000
$745,000
$620,000
$912,500
$842,000
$1,670,000
$1,105,000
$1,412,500
$1,378,220
$752,000
-
$652,500
375 Riverside Drive
N/A
Avg. Price / ft2
Past 12 months
Past 12 months
-
-
-
-
-
-
-
-
-
-
-
-
-
-
-
-
-
-
-
-
-
-
375 Riverside Drive
N/A
Avg. Price
Past 12 months
Past 12 months
-
-
-
-
-
-
-
-
-
-
-
-
-
-
-
-
-
-
-
-
-
-
375 Riverside Drive
N/A
Median Price
Past 12 months
Past 12 months
-
-
-
-
-
-
-
-
-
-
-
-
-
-
-
-
-
-
-
-
-
-
375 Riverside Drive
N/A
Avg. Price / ft2
Past 12 months
Past 12 months
-
-
$796
-
-
-
$858
-
-
-
$765
$830
$445
-
$664
-
-
-
-
-
-
-
375 Riverside Drive
N/A
Avg. Price
Past 12 months
Past 12 months
-
-
$822,827
-
-
-
$988,333
$675,000
-
-
$620,000
$400,500
$432,500
-
$365,000
-
-
-
-
$392,500
-
-
375 Riverside Drive
N/A
Median Price
Past 12 months
Past 12 months
-
-
$822,827
-
-
-
$950,000
$675,000
-
-
$620,000
$400,500
$432,500
-
$365,000
-
-
-
-
$392,500
-
-
375 Riverside Drive
N/A
Avg. Price / ft2
Past 12 months
Past 12 months
-
$958
-
-
$1,370
$1,083
-
-
-
-
-
$885
-
$854
$1,021
-
-
-
-
$794
-
-
375 Riverside Drive
N/A
Avg. Price
Past 12 months
Past 12 months
$985,000
$957,500
-
-
$1,575,000
$1,150,050
$942,500
-
$1,297,500
$1,488,250
$2,250,000
$891,667
$790,000
$908,384
$842,000
-
-
$959,300
-
$1,003,500
-
$500,000
375 Riverside Drive
N/A
Median Price
Past 12 months
Past 12 months
$985,000
$957,500
-
-
$1,575,000
$1,150,050
$942,500
-
$1,297,500
$1,488,250
$2,250,000
$745,000
$790,000
$895,000
$842,000
-
-
$959,300
-
$1,003,500
-
$500,000
375 Riverside Drive
N/A
Avg. Price / ft2
Past 12 months
Past 12 months
-
-
$1,333
-
-
-
-
-
-
-
-
-
-
-
-
$888
-
-
$975
-
-
-
375 Riverside Drive
N/A
Avg. Price
Past 12 months
Past 12 months
-
-
$1,999,999
-
-
-
$1,743,000
-
-
-
-
$1,987,500
-
$1,730,000
-
$1,670,000
-
$1,412,500
$1,832,308
-
-
-
375 Riverside Drive
N/A
Median Price
Past 12 months
Past 12 months
-
-
$1,999,999
-
-
-
$1,850,000
-
-
-
-
$1,987,500
-
$1,730,000
-
$1,670,000
-
$1,412,500
$1,832,308
-
-
-
375 Riverside Drive
N/A
Avg. Price / ft2
Past 12 months
Past 12 months
-
-
-
-
-
-
-
-
-
-
-
-
-
-
$965
-
-
-
-
-
-
-
375 Riverside Drive
N/A
Avg. Price
Past 12 months
Past 12 months
-
-
-
-
-
-
-
-
-
-
-
-
-
-
$1,736,275
-
-
-
-
-
-
-
375 Riverside Drive
N/A
Median Price
Past 12 months
Past 12 months
-
-
-
-
-
-
-
-
-
-
-
-
-
-
$1,736,275
-
-
-
-
-
-
-
375 Riverside Drive
N/A
Avg. Price / ft2
Past 12 months
Past 12 months
-
-
-
-
-
-
-
-
-
-
-
-
-
-
-
-
-
-
-
-
-
-
375 Riverside Drive
N/A
Avg. Price
Past 12 months
Past 12 months
-
-
-
-
-
-
-
-
-
-
-
-
-
-
-
-
-
-
-
-
-
-
375 Riverside Drive
N/A
Median Price
Past 12 months
Past 12 months
-
-
-
-
-
-
-
-
-
-
-
-
-
-
-
-
-
-
-
-
-
-