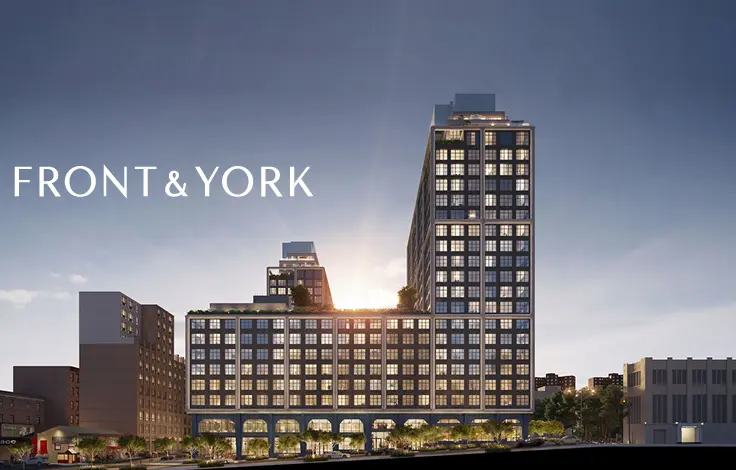
129 East 69th Street: Price Comparison
between Park Avenue & Lexington Avenue Building Profile
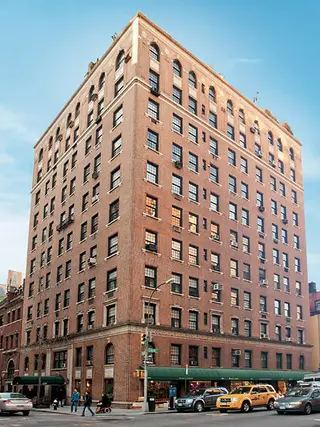
129 East 69th Street
$3,250,000
Avg. Price
Past 12 months
Past 12 months
2025
$3,250,000
2024
$2,716,667
2023
$3,850,000
2022
$3,715,750
2021
$3,650,000
2020
-
2019
$3,329,333
2018
$4,575,000
2017
-
2016
-
2015
$2,195,000
2014
-
2013
$3,235,000
2012
$3,337,500
2011
-
2010
-
2009
-
2008
-
2007
-
2006
$2,900,000
2005
-
2004
$1,993,494
2003
-
129 East 69th Street
$3,250,000
Median Price
Past 12 months
Past 12 months
2025
$3,250,000
2024
$2,650,000
2023
$3,850,000
2022
$3,556,500
2021
$3,650,000
2020
-
2019
$2,900,000
2018
$4,575,000
2017
-
2016
-
2015
$2,195,000
2014
-
2013
$3,235,000
2012
$3,337,500
2011
-
2010
-
2009
-
2008
-
2007
-
2006
$2,900,000
2005
-
2004
$1,993,494
2003
-
129 East 69th Street
N/A
Avg. Price
Past 12 months
Past 12 months
2025
-
2024
-
2023
-
2022
-
2021
-
2020
-
2019
-
2018
-
2017
-
2016
-
2015
-
2014
-
2013
-
2012
-
2011
-
2010
-
2009
-
2008
-
2007
-
2006
-
2005
-
2004
-
2003
-
129 East 69th Street
N/A
Median Price
Past 12 months
Past 12 months
2025
-
2024
-
2023
-
2022
-
2021
-
2020
-
2019
-
2018
-
2017
-
2016
-
2015
-
2014
-
2013
-
2012
-
2011
-
2010
-
2009
-
2008
-
2007
-
2006
-
2005
-
2004
-
2003
-
129 East 69th Street
N/A
Avg. Price
Past 12 months
Past 12 months
2025
-
2024
-
2023
-
2022
-
2021
-
2020
-
2019
-
2018
-
2017
-
2016
-
2015
$2,195,000
2014
-
2013
-
2012
-
2011
-
2010
-
2009
-
2008
-
2007
-
2006
-
2005
-
2004
-
2003
-
129 East 69th Street
N/A
Median Price
Past 12 months
Past 12 months
2025
-
2024
-
2023
-
2022
-
2021
-
2020
-
2019
-
2018
-
2017
-
2016
-
2015
$2,195,000
2014
-
2013
-
2012
-
2011
-
2010
-
2009
-
2008
-
2007
-
2006
-
2005
-
2004
-
2003
-
129 East 69th Street
$3,250,000
Avg. Price
Past 12 months
Past 12 months
2025
$3,250,000
2024
$2,906,250
2023
$3,850,000
2022
$3,754,333
2021
$3,650,000
2020
-
2019
$3,329,333
2018
$4,575,000
2017
-
2016
-
2015
-
2014
-
2013
$3,235,000
2012
$3,337,500
2011
-
2010
-
2009
-
2008
-
2007
-
2006
$2,900,000
2005
-
2004
$1,993,494
2003
-
129 East 69th Street
$3,250,000
Median Price
Past 12 months
Past 12 months
2025
$3,250,000
2024
$2,906,250
2023
$3,850,000
2022
$3,513,000
2021
$3,650,000
2020
-
2019
$2,900,000
2018
$4,575,000
2017
-
2016
-
2015
-
2014
-
2013
$3,235,000
2012
$3,337,500
2011
-
2010
-
2009
-
2008
-
2007
-
2006
$2,900,000
2005
-
2004
$1,993,494
2003
-
129 East 69th Street
N/A
Avg. Price
Past 12 months
Past 12 months
2025
-
2024
$2,337,500
2023
-
2022
$3,600,000
2021
-
2020
-
2019
-
2018
-
2017
-
2016
-
2015
-
2014
-
2013
-
2012
-
2011
-
2010
-
2009
-
2008
-
2007
-
2006
-
2005
-
2004
-
2003
-
129 East 69th Street
N/A
Median Price
Past 12 months
Past 12 months
2025
-
2024
$2,337,500
2023
-
2022
$3,600,000
2021
-
2020
-
2019
-
2018
-
2017
-
2016
-
2015
-
2014
-
2013
-
2012
-
2011
-
2010
-
2009
-
2008
-
2007
-
2006
-
2005
-
2004
-
2003
-
129 East 69th Street
N/A
Avg. Price
Past 12 months
Past 12 months
2025
-
2024
-
2023
-
2022
-
2021
-
2020
-
2019
-
2018
-
2017
-
2016
-
2015
-
2014
-
2013
-
2012
-
2011
-
2010
-
2009
-
2008
-
2007
-
2006
-
2005
-
2004
-
2003
-
129 East 69th Street
N/A
Median Price
Past 12 months
Past 12 months
2025
-
2024
-
2023
-
2022
-
2021
-
2020
-
2019
-
2018
-
2017
-
2016
-
2015
-
2014
-
2013
-
2012
-
2011
-
2010
-
2009
-
2008
-
2007
-
2006
-
2005
-
2004
-
2003
-