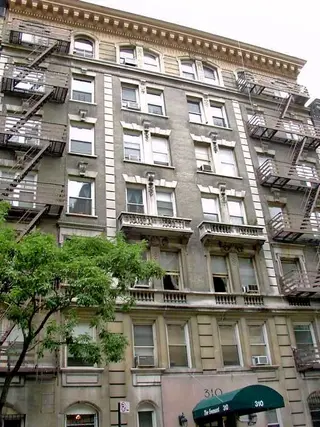
The Fremont, 310 West 94th Street: Price Comparison
between West End Avenue & Riverside Drive Building Profile
The Fremont
N/A
Avg. Price
Past 12 months
Past 12 months
2024
$534,333
2023
-
2022
-
2021
$889,942
2020
-
2019
-
2018
$1,156,501
2017
$831,000
2016
$1,055,000
2015
-
2014
$340,000
2013
-
2012
$1,545,000
2011
$672,500
2010
$397,667
2009
-
2008
-
2007
-
2006
-
2005
$942,500
2004
$535,000
2003
-
The Fremont
N/A
Median Price
Past 12 months
Past 12 months
2024
$493,000
2023
-
2022
-
2021
$740,000
2020
-
2019
-
2018
$1,156,501
2017
$831,000
2016
$1,055,000
2015
-
2014
$340,000
2013
-
2012
$1,545,000
2011
$672,500
2010
$305,000
2009
-
2008
-
2007
-
2006
-
2005
$942,500
2004
$535,000
2003
-
The Fremont
N/A
Avg. Price
Past 12 months
Past 12 months
2024
$375,000
2023
-
2022
-
2021
-
2020
-
2019
-
2018
-
2017
-
2016
$360,000
2015
-
2014
$340,000
2013
-
2012
-
2011
-
2010
$281,500
2009
-
2008
-
2007
-
2006
-
2005
-
2004
-
2003
-
The Fremont
N/A
Median Price
Past 12 months
Past 12 months
2024
$375,000
2023
-
2022
-
2021
-
2020
-
2019
-
2018
-
2017
-
2016
$360,000
2015
-
2014
$340,000
2013
-
2012
-
2011
-
2010
$281,500
2009
-
2008
-
2007
-
2006
-
2005
-
2004
-
2003
-
The Fremont
N/A
Avg. Price
Past 12 months
Past 12 months
2024
$493,000
2023
-
2022
-
2021
$739,913
2020
-
2019
-
2018
-
2017
$831,000
2016
-
2015
-
2014
-
2013
-
2012
-
2011
-
2010
$630,000
2009
-
2008
-
2007
-
2006
-
2005
$532,500
2004
-
2003
-
The Fremont
N/A
Median Price
Past 12 months
Past 12 months
2024
$493,000
2023
-
2022
-
2021
$739,913
2020
-
2019
-
2018
-
2017
$831,000
2016
-
2015
-
2014
-
2013
-
2012
-
2011
-
2010
$630,000
2009
-
2008
-
2007
-
2006
-
2005
$532,500
2004
-
2003
-
The Fremont
N/A
Avg. Price
Past 12 months
Past 12 months
2024
$735,000
2023
-
2022
-
2021
-
2020
-
2019
-
2018
-
2017
-
2016
-
2015
-
2014
-
2013
-
2012
-
2011
-
2010
-
2009
-
2008
-
2007
-
2006
-
2005
-
2004
$535,000
2003
-
The Fremont
N/A
Median Price
Past 12 months
Past 12 months
2024
$735,000
2023
-
2022
-
2021
-
2020
-
2019
-
2018
-
2017
-
2016
-
2015
-
2014
-
2013
-
2012
-
2011
-
2010
-
2009
-
2008
-
2007
-
2006
-
2005
-
2004
$535,000
2003
-
The Fremont
N/A
Avg. Price
Past 12 months
Past 12 months
2024
-
2023
-
2022
-
2021
$1,190,000
2020
-
2019
-
2018
$1,156,501
2017
-
2016
$1,750,000
2015
-
2014
-
2013
-
2012
$1,545,000
2011
$765,000
2010
-
2009
-
2008
-
2007
-
2006
-
2005
$1,352,500
2004
-
2003
-
The Fremont
N/A
Median Price
Past 12 months
Past 12 months
2024
-
2023
-
2022
-
2021
$1,190,000
2020
-
2019
-
2018
$1,156,501
2017
-
2016
$1,750,000
2015
-
2014
-
2013
-
2012
$1,545,000
2011
$765,000
2010
-
2009
-
2008
-
2007
-
2006
-
2005
$1,352,500
2004
-
2003
-
The Fremont
N/A
Avg. Price
Past 12 months
Past 12 months
2024
-
2023
-
2022
-
2021
-
2020
-
2019
-
2018
-
2017
-
2016
-
2015
-
2014
-
2013
-
2012
-
2011
-
2010
-
2009
-
2008
-
2007
-
2006
-
2005
-
2004
-
2003
-
The Fremont
N/A
Median Price
Past 12 months
Past 12 months
2024
-
2023
-
2022
-
2021
-
2020
-
2019
-
2018
-
2017
-
2016
-
2015
-
2014
-
2013
-
2012
-
2011
-
2010
-
2009
-
2008
-
2007
-
2006
-
2005
-
2004
-
2003
-
The Fremont
N/A
Avg. Price
Past 12 months
Past 12 months
2024
-
2023
-
2022
-
2021
-
2020
-
2019
-
2018
-
2017
-
2016
-
2015
-
2014
-
2013
-
2012
-
2011
-
2010
-
2009
-
2008
-
2007
-
2006
-
2005
-
2004
-
2003
-
The Fremont
N/A
Median Price
Past 12 months
Past 12 months
2024
-
2023
-
2022
-
2021
-
2020
-
2019
-
2018
-
2017
-
2016
-
2015
-
2014
-
2013
-
2012
-
2011
-
2010
-
2009
-
2008
-
2007
-
2006
-
2005
-
2004
-
2003
-