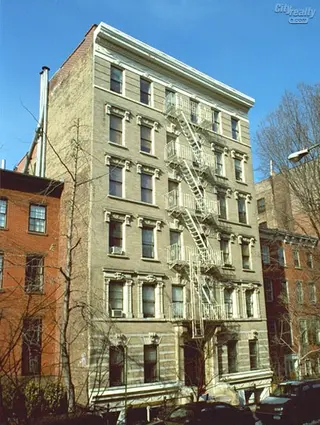
227 West 11th Street: Price Comparison
between Waverly Place & West 4th Street Building Profile
227 West 11th Street
N/A
Avg. Price
Past 12 months
Past 12 months
2024
$1,495,000
2023
$725,000
2022
$861,999
2021
-
2020
-
2019
-
2018
$1,099,000
2017
-
2016
$1,385,000
2015
$688,000
2014
$905,043
2013
$645,000
2012
$570,000
2011
$610,000
2010
$557,461
2009
$429,000
2008
$505,711
2007
-
2006
$559,000
2005
$547,949
2004
$362,500
2003
$373,000
227 West 11th Street
N/A
Median Price
Past 12 months
Past 12 months
2024
$1,495,000
2023
$725,000
2022
$861,999
2021
-
2020
-
2019
-
2018
$1,099,000
2017
-
2016
$1,385,000
2015
$685,000
2014
$905,043
2013
$645,000
2012
$570,000
2011
$610,000
2010
$570,000
2009
$429,000
2008
$490,000
2007
-
2006
$559,000
2005
$547,949
2004
$362,500
2003
$369,000
227 West 11th Street
N/A
Avg. Price
Past 12 months
Past 12 months
2024
-
2023
-
2022
-
2021
-
2020
-
2019
-
2018
-
2017
-
2016
-
2015
-
2014
-
2013
-
2012
-
2011
-
2010
$407,000
2009
-
2008
-
2007
-
2006
-
2005
-
2004
-
2003
-
227 West 11th Street
N/A
Median Price
Past 12 months
Past 12 months
2024
-
2023
-
2022
-
2021
-
2020
-
2019
-
2018
-
2017
-
2016
-
2015
-
2014
-
2013
-
2012
-
2011
-
2010
$407,000
2009
-
2008
-
2007
-
2006
-
2005
-
2004
-
2003
-
227 West 11th Street
N/A
Avg. Price
Past 12 months
Past 12 months
2024
-
2023
$725,000
2022
$861,999
2021
-
2020
-
2019
-
2018
-
2017
-
2016
-
2015
$688,000
2014
$810,586
2013
$645,000
2012
$570,000
2011
$610,000
2010
$570,000
2009
$429,000
2008
$505,711
2007
-
2006
-
2005
$547,949
2004
$362,500
2003
$369,000
227 West 11th Street
N/A
Median Price
Past 12 months
Past 12 months
2024
-
2023
$725,000
2022
$861,999
2021
-
2020
-
2019
-
2018
-
2017
-
2016
-
2015
$685,000
2014
$810,586
2013
$645,000
2012
$570,000
2011
$610,000
2010
$570,000
2009
$429,000
2008
$490,000
2007
-
2006
-
2005
$547,949
2004
$362,500
2003
$369,000
227 West 11th Street
N/A
Avg. Price
Past 12 months
Past 12 months
2024
$1,495,000
2023
-
2022
-
2021
-
2020
-
2019
-
2018
$1,099,000
2017
-
2016
$1,385,000
2015
-
2014
$999,500
2013
-
2012
-
2011
-
2010
$695,384
2009
-
2008
-
2007
-
2006
$559,000
2005
-
2004
-
2003
$550,000
227 West 11th Street
N/A
Median Price
Past 12 months
Past 12 months
2024
$1,495,000
2023
-
2022
-
2021
-
2020
-
2019
-
2018
$1,099,000
2017
-
2016
$1,385,000
2015
-
2014
$999,500
2013
-
2012
-
2011
-
2010
$695,384
2009
-
2008
-
2007
-
2006
$559,000
2005
-
2004
-
2003
$550,000
227 West 11th Street
N/A
Avg. Price
Past 12 months
Past 12 months
2024
-
2023
-
2022
-
2021
-
2020
-
2019
-
2018
-
2017
-
2016
-
2015
-
2014
-
2013
-
2012
-
2011
-
2010
-
2009
-
2008
-
2007
-
2006
-
2005
-
2004
-
2003
-
227 West 11th Street
N/A
Median Price
Past 12 months
Past 12 months
2024
-
2023
-
2022
-
2021
-
2020
-
2019
-
2018
-
2017
-
2016
-
2015
-
2014
-
2013
-
2012
-
2011
-
2010
-
2009
-
2008
-
2007
-
2006
-
2005
-
2004
-
2003
-
227 West 11th Street
N/A
Avg. Price
Past 12 months
Past 12 months
2024
-
2023
-
2022
-
2021
-
2020
-
2019
-
2018
-
2017
-
2016
-
2015
-
2014
-
2013
-
2012
-
2011
-
2010
-
2009
-
2008
-
2007
-
2006
-
2005
-
2004
-
2003
-
227 West 11th Street
N/A
Median Price
Past 12 months
Past 12 months
2024
-
2023
-
2022
-
2021
-
2020
-
2019
-
2018
-
2017
-
2016
-
2015
-
2014
-
2013
-
2012
-
2011
-
2010
-
2009
-
2008
-
2007
-
2006
-
2005
-
2004
-
2003
-