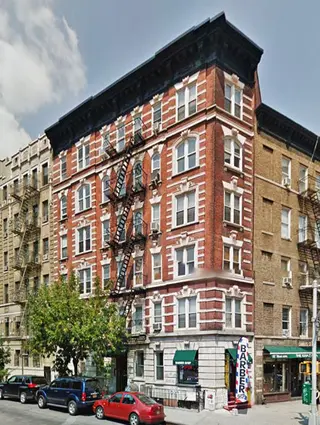
25 Charles Street: Price Comparison
between Waverly Place & West 4th Street Building Profile
25 Charles Street
N/A
Avg. Price
Past 12 months
Past 12 months
2024
$1,013,000
2023
$775,000
2022
-
2021
$1,497,500
2020
-
2019
-
2018
$803,308
2017
-
2016
-
2015
$985,000
2014
$926,250
2013
$873,500
2012
$752,000
2011
$742,500
2010
-
2009
$670,000
2008
$691,948
2007
$671,000
2006
$630,000
2005
$464,633
2004
$501,435
2003
$150,000
25 Charles Street
N/A
Median Price
Past 12 months
Past 12 months
2024
$999,000
2023
$775,000
2022
-
2021
$1,497,500
2020
-
2019
-
2018
$803,308
2017
-
2016
-
2015
$900,000
2014
$926,250
2013
$871,000
2012
$752,000
2011
$742,500
2010
-
2009
$750,000
2008
$660,844
2007
$671,000
2006
$585,000
2005
$499,000
2004
$450,000
2003
$150,000
25 Charles Street
N/A
Avg. Price
Past 12 months
Past 12 months
2024
-
2023
-
2022
-
2021
-
2020
-
2019
-
2018
-
2017
-
2016
-
2015
-
2014
-
2013
-
2012
-
2011
-
2010
-
2009
-
2008
-
2007
-
2006
-
2005
-
2004
-
2003
-
25 Charles Street
N/A
Median Price
Past 12 months
Past 12 months
2024
-
2023
-
2022
-
2021
-
2020
-
2019
-
2018
-
2017
-
2016
-
2015
-
2014
-
2013
-
2012
-
2011
-
2010
-
2009
-
2008
-
2007
-
2006
-
2005
-
2004
-
2003
-
25 Charles Street
N/A
Avg. Price
Past 12 months
Past 12 months
2024
$1,013,000
2023
$775,000
2022
-
2021
-
2020
-
2019
-
2018
$875,000
2017
-
2016
-
2015
$803,333
2014
-
2013
-
2012
-
2011
-
2010
-
2009
$450,000
2008
-
2007
-
2006
$585,000
2005
-
2004
$452,973
2003
$150,000
25 Charles Street
N/A
Median Price
Past 12 months
Past 12 months
2024
$999,000
2023
$775,000
2022
-
2021
-
2020
-
2019
-
2018
$875,000
2017
-
2016
-
2015
$815,000
2014
-
2013
-
2012
-
2011
-
2010
-
2009
$450,000
2008
-
2007
-
2006
$585,000
2005
-
2004
$439,800
2003
$150,000
25 Charles Street
N/A
Avg. Price
Past 12 months
Past 12 months
2024
-
2023
-
2022
-
2021
$1,497,500
2020
-
2019
-
2018
-
2017
-
2016
-
2015
$1,166,667
2014
$926,250
2013
$890,667
2012
$752,000
2011
$742,500
2010
-
2009
$780,000
2008
$710,422
2007
-
2006
-
2005
-
2004
-
2003
$150,000
25 Charles Street
N/A
Median Price
Past 12 months
Past 12 months
2024
-
2023
-
2022
-
2021
$1,497,500
2020
-
2019
-
2018
-
2017
-
2016
-
2015
$1,050,000
2014
$926,250
2013
$920,000
2012
$752,000
2011
$742,500
2010
-
2009
$780,000
2008
$710,422
2007
-
2006
-
2005
-
2004
-
2003
$150,000
25 Charles Street
N/A
Avg. Price
Past 12 months
Past 12 months
2024
-
2023
-
2022
-
2021
-
2020
-
2019
-
2018
-
2017
-
2016
-
2015
-
2014
-
2013
$822,000
2012
-
2011
-
2010
-
2009
-
2008
$655,000
2007
$671,000
2006
$652,500
2005
$464,633
2004
$529,128
2003
-
25 Charles Street
N/A
Median Price
Past 12 months
Past 12 months
2024
-
2023
-
2022
-
2021
-
2020
-
2019
-
2018
-
2017
-
2016
-
2015
-
2014
-
2013
$822,000
2012
-
2011
-
2010
-
2009
-
2008
$655,000
2007
$671,000
2006
$652,500
2005
$499,000
2004
$450,000
2003
-
25 Charles Street
N/A
Avg. Price
Past 12 months
Past 12 months
2024
-
2023
-
2022
-
2021
-
2020
-
2019
-
2018
-
2017
-
2016
-
2015
-
2014
-
2013
-
2012
-
2011
-
2010
-
2009
-
2008
-
2007
-
2006
-
2005
-
2004
-
2003
-
25 Charles Street
N/A
Median Price
Past 12 months
Past 12 months
2024
-
2023
-
2022
-
2021
-
2020
-
2019
-
2018
-
2017
-
2016
-
2015
-
2014
-
2013
-
2012
-
2011
-
2010
-
2009
-
2008
-
2007
-
2006
-
2005
-
2004
-
2003
-
25 Charles Street
N/A
Avg. Price
Past 12 months
Past 12 months
2024
-
2023
-
2022
-
2021
-
2020
-
2019
-
2018
-
2017
-
2016
-
2015
-
2014
-
2013
-
2012
-
2011
-
2010
-
2009
-
2008
-
2007
-
2006
-
2005
-
2004
-
2003
-
25 Charles Street
N/A
Median Price
Past 12 months
Past 12 months
2024
-
2023
-
2022
-
2021
-
2020
-
2019
-
2018
-
2017
-
2016
-
2015
-
2014
-
2013
-
2012
-
2011
-
2010
-
2009
-
2008
-
2007
-
2006
-
2005
-
2004
-
2003
-