571 Hudson Street: Price Comparison
between West 11th Street & Bank Street Building Profile
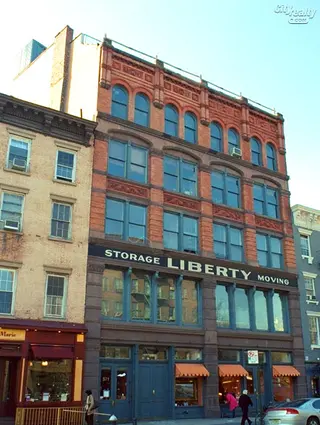
571 Hudson Street
$1,570,000
Avg. Price
Past 12 months
Past 12 months
2024
$1,870,000
2023
$1,735,000
2022
$2,150,000
2021
$1,445,000
2020
$2,200,000
2019
-
2018
-
2017
-
2016
-
2015
-
2014
$2,005,000
2013
-
2012
$1,515,000
2011
-
2010
$1,587,500
2009
-
2008
-
2007
$1,225,000
2006
$1,600,000
2005
$1,699,000
2004
$650,000
2003
-
571 Hudson Street
$1,570,000
Median Price
Past 12 months
Past 12 months
2024
$1,870,000
2023
$1,735,000
2022
$2,150,000
2021
$1,445,000
2020
$2,200,000
2019
-
2018
-
2017
-
2016
-
2015
-
2014
$1,590,000
2013
-
2012
$1,515,000
2011
-
2010
$1,587,500
2009
-
2008
-
2007
$1,225,000
2006
$1,600,000
2005
$1,699,000
2004
$650,000
2003
-
571 Hudson Street
N/A
Avg. Price
Past 12 months
Past 12 months
2024
-
2023
-
2022
-
2021
-
2020
-
2019
-
2018
-
2017
-
2016
-
2015
-
2014
-
2013
-
2012
-
2011
-
2010
-
2009
-
2008
-
2007
-
2006
-
2005
-
2004
-
2003
-
571 Hudson Street
N/A
Median Price
Past 12 months
Past 12 months
2024
-
2023
-
2022
-
2021
-
2020
-
2019
-
2018
-
2017
-
2016
-
2015
-
2014
-
2013
-
2012
-
2011
-
2010
-
2009
-
2008
-
2007
-
2006
-
2005
-
2004
-
2003
-
571 Hudson Street
N/A
Avg. Price
Past 12 months
Past 12 months
2024
-
2023
-
2022
-
2021
-
2020
$2,200,000
2019
-
2018
-
2017
-
2016
-
2015
-
2014
$2,212,500
2013
-
2012
$1,515,000
2011
-
2010
$1,900,000
2009
-
2008
-
2007
$1,225,000
2006
-
2005
$1,699,000
2004
$650,000
2003
-
571 Hudson Street
N/A
Median Price
Past 12 months
Past 12 months
2024
-
2023
-
2022
-
2021
-
2020
$2,200,000
2019
-
2018
-
2017
-
2016
-
2015
-
2014
$2,212,500
2013
-
2012
$1,515,000
2011
-
2010
$1,900,000
2009
-
2008
-
2007
$1,225,000
2006
-
2005
$1,699,000
2004
$650,000
2003
-
571 Hudson Street
$1,570,000
Avg. Price
Past 12 months
Past 12 months
2024
$1,870,000
2023
$1,735,000
2022
$2,150,000
2021
$1,445,000
2020
-
2019
-
2018
-
2017
-
2016
-
2015
-
2014
$1,590,000
2013
-
2012
-
2011
-
2010
$1,275,000
2009
-
2008
-
2007
-
2006
$1,600,000
2005
-
2004
-
2003
-
571 Hudson Street
$1,570,000
Median Price
Past 12 months
Past 12 months
2024
$1,870,000
2023
$1,735,000
2022
$2,150,000
2021
$1,445,000
2020
-
2019
-
2018
-
2017
-
2016
-
2015
-
2014
$1,590,000
2013
-
2012
-
2011
-
2010
$1,275,000
2009
-
2008
-
2007
-
2006
$1,600,000
2005
-
2004
-
2003
-
571 Hudson Street
N/A
Avg. Price
Past 12 months
Past 12 months
2024
-
2023
-
2022
-
2021
-
2020
-
2019
-
2018
-
2017
-
2016
-
2015
-
2014
-
2013
-
2012
-
2011
-
2010
-
2009
-
2008
-
2007
-
2006
-
2005
-
2004
-
2003
-
571 Hudson Street
N/A
Median Price
Past 12 months
Past 12 months
2024
-
2023
-
2022
-
2021
-
2020
-
2019
-
2018
-
2017
-
2016
-
2015
-
2014
-
2013
-
2012
-
2011
-
2010
-
2009
-
2008
-
2007
-
2006
-
2005
-
2004
-
2003
-
571 Hudson Street
N/A
Avg. Price
Past 12 months
Past 12 months
2024
-
2023
-
2022
-
2021
-
2020
-
2019
-
2018
-
2017
-
2016
-
2015
-
2014
-
2013
-
2012
-
2011
-
2010
-
2009
-
2008
-
2007
-
2006
-
2005
-
2004
-
2003
-
571 Hudson Street
N/A
Median Price
Past 12 months
Past 12 months
2024
-
2023
-
2022
-
2021
-
2020
-
2019
-
2018
-
2017
-
2016
-
2015
-
2014
-
2013
-
2012
-
2011
-
2010
-
2009
-
2008
-
2007
-
2006
-
2005
-
2004
-
2003
-
Hudson Mews
$3,182
Avg. Price / ft2
Past 12 months
Past 12 months
-
-
$1,502
-
-
$1,441
$2,357
$1,783
-
-
-
$1,238
$1,271
-
$841
-
-
$1,192
-
-
-
-
Hudson Mews
$3,867,500
Avg. Price
Past 12 months
Past 12 months
-
$3,258,333
$2,560,000
-
-
$1,585,000
$3,300,000
$2,140,000
-
-
$3,510,000
$1,705,000
$2,557,000
-
$925,000
-
-
$2,154,000
$1,685,000
-
$500,254
-
Hudson Mews
$4,097,500
Median Price
Past 12 months
Past 12 months
-
$3,400,000
$2,560,000
-
-
$1,585,000
$3,300,000
$2,140,000
-
-
$3,510,000
$1,705,000
$2,600,000
-
$925,000
-
-
$2,050,000
$1,685,000
-
$500,254
-
Hudson Mews
N/A
Avg. Price / ft2
Past 12 months
Past 12 months
-
-
-
-
-
-
-
-
-
-
-
-
-
-
-
-
-
-
-
-
-
-
Hudson Mews
N/A
Avg. Price
Past 12 months
Past 12 months
-
-
-
-
-
-
-
-
-
-
-
-
-
-
-
-
-
-
-
-
-
-
Hudson Mews
N/A
Median Price
Past 12 months
Past 12 months
-
-
-
-
-
-
-
-
-
-
-
-
-
-
-
-
-
-
-
-
-
-
Hudson Mews
N/A
Avg. Price / ft2
Past 12 months
Past 12 months
-
-
-
-
-
$1,441
-
-
-
-
-
-
-
-
$841
-
-
-
-
-
-
-
Hudson Mews
$4,600,000
Avg. Price
Past 12 months
Past 12 months
-
-
-
-
-
$1,585,000
-
-
-
-
$3,510,000
-
$2,600,000
-
$925,000
-
-
-
$1,685,000
-
-
-
Hudson Mews
$4,600,000
Median Price
Past 12 months
Past 12 months
-
-
-
-
-
$1,585,000
-
-
-
-
$3,510,000
-
$2,600,000
-
$925,000
-
-
-
$1,685,000
-
-
-
Hudson Mews
$3,579
Avg. Price / ft2
Past 12 months
Past 12 months
-
-
$1,502
-
-
-
-
$1,783
-
-
-
$1,238
-
-
-
-
-
$1,171
-
-
-
-
Hudson Mews
$3,485,000
Avg. Price
Past 12 months
Past 12 months
-
$3,258,333
$2,560,000
-
-
-
-
$2,140,000
-
-
-
$1,705,000
$2,021,000
-
-
-
-
$2,050,000
-
-
$500,254
-
Hudson Mews
$3,485,000
Median Price
Past 12 months
Past 12 months
-
$3,400,000
$2,560,000
-
-
-
-
$2,140,000
-
-
-
$1,705,000
$2,021,000
-
-
-
-
$2,050,000
-
-
$500,254
-
Hudson Mews
$2,786
Avg. Price / ft2
Past 12 months
Past 12 months
-
-
-
-
-
-
$2,357
-
-
-
-
-
$1,271
-
-
-
-
$1,202
-
-
-
-
Hudson Mews
$3,900,000
Avg. Price
Past 12 months
Past 12 months
-
-
-
-
-
-
$3,300,000
-
-
-
-
-
$3,050,000
-
-
-
-
$2,206,000
-
-
-
-
Hudson Mews
$3,900,000
Median Price
Past 12 months
Past 12 months
-
-
-
-
-
-
$3,300,000
-
-
-
-
-
$3,050,000
-
-
-
-
$2,206,000
-
-
-
-
Hudson Mews
N/A
Avg. Price / ft2
Past 12 months
Past 12 months
-
-
-
-
-
-
-
-
-
-
-
-
-
-
-
-
-
-
-
-
-
-
Hudson Mews
N/A
Avg. Price
Past 12 months
Past 12 months
-
-
-
-
-
-
-
-
-
-
-
-
-
-
-
-
-
-
-
-
-
-
Hudson Mews
N/A
Median Price
Past 12 months
Past 12 months
-
-
-
-
-
-
-
-
-
-
-
-
-
-
-
-
-
-
-
-
-
-
Hudson Mews
N/A
Avg. Price / ft2
Past 12 months
Past 12 months
-
-
-
-
-
-
-
-
-
-
-
-
-
-
-
-
-
-
-
-
-
-
Hudson Mews
N/A
Avg. Price
Past 12 months
Past 12 months
-
-
-
-
-
-
-
-
-
-
-
-
-
-
-
-
-
-
-
-
-
-
Hudson Mews
N/A
Median Price
Past 12 months
Past 12 months
-
-
-
-
-
-
-
-
-
-
-
-
-
-
-
-
-
-
-
-
-
-
Greenwich House
$2,785
Avg. Price / ft2
Past 12 months
Past 12 months
-
-
-
-
-
$1,872
-
-
$1,816
-
-
-
$1,351
$1,214
$897
$1,000
-
$1,667
$700
-
-
-
Greenwich House
$9,631,250
Avg. Price
Past 12 months
Past 12 months
$5,250,000
-
-
-
-
$3,800,000
$3,850,000
-
$3,995,000
$3,450,000
-
-
$2,971,500
$2,550,000
$1,725,000
$2,100,000
-
$3,375,000
$1,225,000
-
-
-
Greenwich House
$9,631,250
Median Price
Past 12 months
Past 12 months
$5,250,000
-
-
-
-
$3,800,000
$3,850,000
-
$3,995,000
$3,450,000
-
-
$2,971,500
$2,550,000
$1,725,000
$2,100,000
-
$3,375,000
$1,225,000
-
-
-
Greenwich House
N/A
Avg. Price / ft2
Past 12 months
Past 12 months
-
-
-
-
-
-
-
-
-
-
-
-
-
-
$686
-
-
-
$700
-
-
-
Greenwich House
N/A
Avg. Price
Past 12 months
Past 12 months
-
-
-
-
-
-
-
-
-
-
-
-
-
-
$1,200,000
-
-
-
$1,225,000
-
-
-
Greenwich House
N/A
Median Price
Past 12 months
Past 12 months
-
-
-
-
-
-
-
-
-
-
-
-
-
-
$1,200,000
-
-
-
$1,225,000
-
-
-
Greenwich House
N/A
Avg. Price / ft2
Past 12 months
Past 12 months
-
-
-
-
-
-
-
-
-
-
-
-
-
-
-
-
-
-
-
-
-
-
Greenwich House
N/A
Avg. Price
Past 12 months
Past 12 months
-
-
-
-
-
-
-
-
-
-
-
-
-
-
-
-
-
-
-
-
-
-
Greenwich House
N/A
Median Price
Past 12 months
Past 12 months
-
-
-
-
-
-
-
-
-
-
-
-
-
-
-
-
-
-
-
-
-
-
Greenwich House
$2,052
Avg. Price / ft2
Past 12 months
Past 12 months
-
-
-
-
-
$1,872
-
-
$1,816
-
-
-
$1,665
$1,214
$1,108
$1,000
-
$1,667
-
-
-
-
Greenwich House
$4,612,500
Avg. Price
Past 12 months
Past 12 months
-
-
-
-
-
$3,800,000
-
-
$3,995,000
$3,450,000
-
-
$3,663,000
$2,550,000
$2,250,000
$2,100,000
-
$3,375,000
-
-
-
-
Greenwich House
$4,612,500
Median Price
Past 12 months
Past 12 months
-
-
-
-
-
$3,800,000
-
-
$3,995,000
$3,450,000
-
-
$3,663,000
$2,550,000
$2,250,000
$2,100,000
-
$3,375,000
-
-
-
-
Greenwich House
N/A
Avg. Price / ft2
Past 12 months
Past 12 months
-
-
-
-
-
-
-
-
-
-
-
-
$1,036
-
-
-
-
-
-
-
-
-
Greenwich House
N/A
Avg. Price
Past 12 months
Past 12 months
-
-
-
-
-
-
-
-
-
-
-
-
$2,280,000
-
-
-
-
-
-
-
-
-
Greenwich House
N/A
Median Price
Past 12 months
Past 12 months
-
-
-
-
-
-
-
-
-
-
-
-
$2,280,000
-
-
-
-
-
-
-
-
-
Greenwich House
$3,519
Avg. Price / ft2
Past 12 months
Past 12 months
-
-
-
-
-
-
-
-
-
-
-
-
-
-
-
-
-
-
-
-
-
-
Greenwich House
$14,650,000
Avg. Price
Past 12 months
Past 12 months
$5,250,000
-
-
-
-
-
$3,850,000
-
-
-
-
-
-
-
-
-
-
-
-
-
-
-
Greenwich House
$14,650,000
Median Price
Past 12 months
Past 12 months
$5,250,000
-
-
-
-
-
$3,850,000
-
-
-
-
-
-
-
-
-
-
-
-
-
-
-
Greenwich House
N/A
Avg. Price / ft2
Past 12 months
Past 12 months
-
-
-
-
-
-
-
-
-
-
-
-
-
-
-
-
-
-
-
-
-
-
Greenwich House
N/A
Avg. Price
Past 12 months
Past 12 months
-
-
-
-
-
-
-
-
-
-
-
-
-
-
-
-
-
-
-
-
-
-
Greenwich House
N/A
Median Price
Past 12 months
Past 12 months
-
-
-
-
-
-
-
-
-
-
-
-
-
-
-
-
-
-
-
-
-
-
The Left Bank
$1,901
Avg. Price / ft2
Past 12 months
Past 12 months
-
$1,675
$1,184
$1,404
-
-
-
-
$1,739
$1,517
$1,280
-
$1,089
$743
$927
-
$1,077
-
$1,038
$1,035
$525
$695
The Left Bank
$1,306,973
Avg. Price
Past 12 months
Past 12 months
$580,000
$1,129,250
$1,193,333
$1,068,357
-
-
$1,175,000
$650,000
$966,250
$737,143
$827,400
$529,667
$543,375
$580,625
$592,800
$525,000
$654,500
$1,140,000
$611,000
$499,650
$411,600
$329,833
The Left Bank
$1,337,500
Median Price
Past 12 months
Past 12 months
$580,000
$1,026,000
$1,217,500
$832,000
-
-
$1,175,000
$650,000
$966,250
$710,000
$750,000
$540,000
$490,000
$478,750
$525,000
$525,000
$550,000
$1,140,000
$499,000
$598,050
$325,000
$312,500
The Left Bank
N/A
Avg. Price / ft2
Past 12 months
Past 12 months
-
-
$1,184
$1,213
-
-
-
-
$1,739
$1,591
$960
-
$1,089
$855
$935
-
$1,077
-
$998
-
-
$695
The Left Bank
$685,000
Avg. Price
Past 12 months
Past 12 months
$580,000
$470,000
$1,046,667
$630,750
-
-
-
$650,000
$782,500
$724,000
$556,000
$529,667
$457,833
$478,750
$471,667
$525,000
$528,125
-
$499,000
$341,300
$442,250
$292,800
The Left Bank
$685,000
Median Price
Past 12 months
Past 12 months
$580,000
$470,000
$730,000
$630,750
-
-
-
$650,000
$782,500
$710,000
$556,000
$540,000
$490,000
$478,750
$450,000
$525,000
$533,750
-
$499,000
$341,300
$330,000
$310,000
The Left Bank
N/A
Avg. Price / ft2
Past 12 months
Past 12 months
-
$1,675
-
$1,550
-
-
-
-
-
$1,292
$1,600
-
-
$631
$916
-
-
-
$1,077
$1,035
$525
-
The Left Bank
$1,293,500
Avg. Price
Past 12 months
Past 12 months
-
$1,026,000
$1,340,000
$955,500
-
-
$1,175,000
-
$1,150,000
$1,030,000
$1,008,333
-
$800,000
$682,500
$774,500
-
$1,160,000
$850,000
$835,000
$658,000
$289,000
$515,000
The Left Bank
$1,337,500
Median Price
Past 12 months
Past 12 months
-
$1,026,000
$1,525,000
$891,000
-
-
$1,175,000
-
$1,150,000
$1,030,000
$800,000
-
$800,000
$682,500
$774,500
-
$1,160,000
$850,000
$835,000
$658,000
$289,000
$515,000
The Left Bank
$1,901
Avg. Price / ft2
Past 12 months
Past 12 months
-
-
-
$1,640
-
-
-
-
-
-
-
-
-
-
-
-
-
-
-
-
-
-
The Left Bank
$2,270,000
Avg. Price
Past 12 months
Past 12 months
-
$1,995,000
-
$2,395,000
-
-
-
-
-
-
-
-
-
-
-
-
-
$1,430,000
-
-
-
-
The Left Bank
$2,270,000
Median Price
Past 12 months
Past 12 months
-
$1,995,000
-
$2,395,000
-
-
-
-
-
-
-
-
-
-
-
-
-
$1,430,000
-
-
-
-
The Left Bank
N/A
Avg. Price / ft2
Past 12 months
Past 12 months
-
-
-
-
-
-
-
-
-
-
-
-
-
-
-
-
-
-
-
-
-
-
The Left Bank
N/A
Avg. Price
Past 12 months
Past 12 months
-
-
-
-
-
-
-
-
-
-
-
-
-
-
-
-
-
-
-
-
-
-
The Left Bank
N/A
Median Price
Past 12 months
Past 12 months
-
-
-
-
-
-
-
-
-
-
-
-
-
-
-
-
-
-
-
-
-
-
The Left Bank
N/A
Avg. Price / ft2
Past 12 months
Past 12 months
-
-
-
-
-
-
-
-
-
-
-
-
-
-
-
-
-
-
-
-
-
-
The Left Bank
N/A
Avg. Price
Past 12 months
Past 12 months
-
-
-
-
-
-
-
-
-
-
-
-
-
-
-
-
-
-
-
-
-
-
The Left Bank
N/A
Median Price
Past 12 months
Past 12 months
-
-
-
-
-
-
-
-
-
-
-
-
-
-
-
-
-
-
-
-
-
-
The Stafford Mews
$1,837
Avg. Price / ft2
Past 12 months
Past 12 months
$1,320
$1,245
$1,708
-
-
$1,430
$1,213
$1,399
-
$1,233
-
-
$1,119
-
-
$1,111
-
-
-
-
-
-
The Stafford Mews
$3,950,000
Avg. Price
Past 12 months
Past 12 months
$2,028,333
$2,490,000
$3,800,000
-
-
$3,075,000
$2,135,000
$2,325,000
-
$2,650,000
-
$1,300,000
$2,350,000
$2,900,000
-
$1,900,000
$1,350,000
-
-
$910,000
-
-
The Stafford Mews
$3,950,000
Median Price
Past 12 months
Past 12 months
$2,060,000
$2,490,000
$3,800,000
-
-
$3,075,000
$2,135,000
$2,325,000
-
$2,650,000
-
$1,300,000
$2,350,000
$2,900,000
-
$1,900,000
$1,350,000
-
-
$910,000
-
-
The Stafford Mews
N/A
Avg. Price / ft2
Past 12 months
Past 12 months
-
-
-
-
-
-
-
-
-
-
-
-
-
-
-
-
-
-
-
-
-
-
The Stafford Mews
N/A
Avg. Price
Past 12 months
Past 12 months
$1,300,000
-
-
-
-
-
-
-
-
-
-
-
-
-
-
-
-
-
-
-
-
-
The Stafford Mews
N/A
Median Price
Past 12 months
Past 12 months
$1,300,000
-
-
-
-
-
-
-
-
-
-
-
-
-
-
-
-
-
-
-
-
-
The Stafford Mews
N/A
Avg. Price / ft2
Past 12 months
Past 12 months
$1,373
-
-
-
-
-
-
$1,393
-
-
-
-
-
-
-
-
-
-
-
-
-
-
The Stafford Mews
N/A
Avg. Price
Past 12 months
Past 12 months
$2,060,000
-
-
-
-
-
-
$1,700,000
-
-
-
$1,300,000
-
-
-
-
-
-
-
$910,000
-
-
The Stafford Mews
N/A
Median Price
Past 12 months
Past 12 months
$2,060,000
-
-
-
-
-
-
$1,700,000
-
-
-
$1,300,000
-
-
-
-
-
-
-
$910,000
-
-
The Stafford Mews
$1,837
Avg. Price / ft2
Past 12 months
Past 12 months
$1,267
$1,245
$1,708
-
-
$1,430
-
-
-
$1,233
-
-
-
-
-
$1,111
-
-
-
-
-
-
The Stafford Mews
$3,950,000
Avg. Price
Past 12 months
Past 12 months
$2,725,000
$2,490,000
$3,800,000
-
-
$3,075,000
$1,570,000
-
-
$2,650,000
-
-
-
-
-
$1,900,000
$1,350,000
-
-
-
-
-
The Stafford Mews
$3,950,000
Median Price
Past 12 months
Past 12 months
$2,725,000
$2,490,000
$3,800,000
-
-
$3,075,000
$1,570,000
-
-
$2,650,000
-
-
-
-
-
$1,900,000
$1,350,000
-
-
-
-
-
The Stafford Mews
N/A
Avg. Price / ft2
Past 12 months
Past 12 months
-
-
-
-
-
-
$1,213
$1,405
-
-
-
-
$1,119
-
-
-
-
-
-
-
-
-
The Stafford Mews
N/A
Avg. Price
Past 12 months
Past 12 months
-
-
-
-
-
-
$2,700,000
$2,950,000
-
-
-
-
$2,350,000
$2,900,000
-
-
-
-
-
-
-
-
The Stafford Mews
N/A
Median Price
Past 12 months
Past 12 months
-
-
-
-
-
-
$2,700,000
$2,950,000
-
-
-
-
$2,350,000
$2,900,000
-
-
-
-
-
-
-
-
The Stafford Mews
N/A
Avg. Price / ft2
Past 12 months
Past 12 months
-
-
-
-
-
-
-
-
-
-
-
-
-
-
-
-
-
-
-
-
-
-
The Stafford Mews
N/A
Avg. Price
Past 12 months
Past 12 months
-
-
-
-
-
-
-
-
-
-
-
-
-
-
-
-
-
-
-
-
-
-
The Stafford Mews
N/A
Median Price
Past 12 months
Past 12 months
-
-
-
-
-
-
-
-
-
-
-
-
-
-
-
-
-
-
-
-
-
-
The Stafford Mews
N/A
Avg. Price / ft2
Past 12 months
Past 12 months
-
-
-
-
-
-
-
-
-
-
-
-
-
-
-
-
-
-
-
-
-
-
The Stafford Mews
N/A
Avg. Price
Past 12 months
Past 12 months
-
-
-
-
-
-
-
-
-
-
-
-
-
-
-
-
-
-
-
-
-
-
The Stafford Mews
N/A
Median Price
Past 12 months
Past 12 months
-
-
-
-
-
-
-
-
-
-
-
-
-
-
-
-
-
-
-
-
-
-
West Village Houses
$1,236
Avg. Price / ft2
Past 12 months
Past 12 months
$1,193
$1,183
$1,169
-
$1,124
$1,236
$1,561
$1,593
$674
$1,509
$1,064
$783
$1,019
$1,020
$892
$504
$903
$357
$341
-
-
-
West Village Houses
$1,217,500
Avg. Price
Past 12 months
Past 12 months
$1,140,965
$988,500
$1,076,119
-
$899,000
$1,062,500
$1,369,375
$1,583,000
$964,173
$1,275,080
$886,284
$689,282
$886,250
$865,000
$666,250
$421,098
$522,241
$300,939
$286,524
-
-
-
West Village Houses
$1,100,000
Median Price
Past 12 months
Past 12 months
$1,069,625
$950,000
$1,042,500
-
$899,000
$1,062,500
$1,092,500
$1,342,500
$986,491
$1,275,080
$919,290
$689,282
$886,250
$865,000
$666,250
$264,634
$630,000
$193,498
$246,162
-
-
-
West Village Houses
N/A
Avg. Price / ft2
Past 12 months
Past 12 months
-
-
-
-
-
-
-
-
-
-
-
-
-
-
-
-
-
-
-
-
-
-
West Village Houses
N/A
Avg. Price
Past 12 months
Past 12 months
-
-
-
-
-
-
-
-
-
-
-
-
-
-
-
-
-
-
-
-
-
-
West Village Houses
N/A
Median Price
Past 12 months
Past 12 months
-
-
-
-
-
-
-
-
-
-
-
-
-
-
-
-
-
-
-
-
-
-
West Village Houses
$1,247
Avg. Price / ft2
Past 12 months
Past 12 months
-
$1,328
$1,141
-
$1,124
-
-
$1,606
-
-
$1,284
$1,324
-
-
$892
-
$900
$214
$457
-
-
-
West Village Houses
$997,500
Avg. Price
Past 12 months
Past 12 months
$942,500
$902,250
$799,000
-
$899,000
-
$780,000
$1,285,000
-
-
$937,860
$1,058,980
-
-
$666,250
-
$630,000
$173,710
$281,429
-
-
-
West Village Houses
$997,500
Median Price
Past 12 months
Past 12 months
$942,500
$902,250
$799,000
-
$899,000
-
$780,000
$1,285,000
-
-
$940,000
$1,058,980
-
-
$666,250
-
$630,000
$178,529
$216,831
-
-
-
West Village Houses
$1,343
Avg. Price / ft2
Past 12 months
Past 12 months
$1,321
$1,290
$1,342
-
-
$1,236
$1,842
$1,586
-
$1,509
$1,111
-
$1,019
$1,020
-
$504
$905
$354
$344
-
-
-
West Village Houses
$1,229,545
Avg. Price
Past 12 months
Past 12 months
$1,133,168
$1,041,250
$1,112,000
-
-
$1,062,500
$1,470,000
$1,682,333
$915,835
$1,275,080
$900,662
-
$886,250
$865,000
-
$421,098
$468,361
$272,595
$291,954
-
-
-
West Village Houses
$1,100,000
Median Price
Past 12 months
Past 12 months
$1,075,000
$1,032,500
$1,085,000
-
-
$1,062,500
$1,350,000
$1,400,000
$915,835
$1,275,080
$900,662
-
$886,250
$865,000
-
$264,634
$468,361
$192,533
$246,162
-
-
-
West Village Houses
N/A
Avg. Price / ft2
Past 12 months
Past 12 months
$894
$718
$750
-
-
-
$1,279
-
$660
-
$531
$241
-
-
-
-
-
$459
$202
-
-
-
West Village Houses
N/A
Avg. Price
Past 12 months
Past 12 months
$1,296,667
$950,000
$1,124,975
-
-
-
$1,757,500
-
$990,193
-
$702,800
$319,583
-
-
-
-
-
$474,774
$287,294
-
-
-
West Village Houses
N/A
Median Price
Past 12 months
Past 12 months
$1,150,000
$950,000
$1,124,975
-
-
-
$1,757,500
-
$990,193
-
$702,800
$319,583
-
-
-
-
-
$208,457
$287,294
-
-
-
West Village Houses
$1,064
Avg. Price / ft2
Past 12 months
Past 12 months
-
-
-
-
-
-
-
-
$688
-
-
-
-
-
-
-
-
$268
$205
-
-
-
West Village Houses
$1,525,000
Avg. Price
Past 12 months
Past 12 months
-
-
-
-
-
-
-
-
$986,491
-
-
-
-
-
-
-
-
$384,101
$293,361
-
-
-
West Village Houses
$1,525,000
Median Price
Past 12 months
Past 12 months
-
-
-
-
-
-
-
-
$986,491
-
-
-
-
-
-
-
-
$384,101
$293,361
-
-
-
West Village Houses
N/A
Avg. Price / ft2
Past 12 months
Past 12 months
-
-
-
-
-
-
-
-
-
-
-
-
-
-
-
-
-
-
-
-
-
-
West Village Houses
N/A
Avg. Price
Past 12 months
Past 12 months
-
-
-
-
-
-
-
-
-
-
-
-
-
-
-
-
-
-
-
-
-
-
West Village Houses
N/A
Median Price
Past 12 months
Past 12 months
-
-
-
-
-
-
-
-
-
-
-
-
-
-
-
-
-
-
-
-
-
-
The Van Gogh
$1,200
Avg. Price / ft2
Past 12 months
Past 12 months
-
$1,603
$1,997
$1,548
$1,340
-
$1,341
$1,470
-
$1,394
$1,109
$1,158
$1,086
$869
$898
$880
$1,307
$1,013
$922
$718
$722
$577
The Van Gogh
$918,500
Avg. Price
Past 12 months
Past 12 months
$1,014,167
$1,317,500
$1,655,167
$1,038,667
$703,250
$1,395,000
$640,000
$1,015,969
$1,050,571
$1,003,750
$671,300
$736,417
$666,625
$685,400
$425,000
$466,048
$1,374,167
$499,750
$557,329
$436,535
$432,333
$524,700
The Van Gogh
$924,500
Median Price
Past 12 months
Past 12 months
$715,000
$1,210,000
$766,000
$699,000
$703,250
$1,395,000
$615,000
$962,500
$949,000
$751,250
$607,500
$540,500
$547,500
$565,000
$425,000
$450,000
$1,374,167
$495,000
$441,815
$430,000
$412,000
$425,000
The Van Gogh
$1,200
Avg. Price / ft2
Past 12 months
Past 12 months
-
$1,590
$1,553
$1,464
$1,340
-
$1,341
$1,472
-
$1,167
-
$905
$1,044
-
$898
-
-
$1,066
$877
$860
$739
-
The Van Gogh
$699,500
Avg. Price
Past 12 months
Past 12 months
$651,667
$845,000
$620,250
$660,500
$703,250
$640,000
$530,000
$736,000
$607,500
$686,250
$578,750
$525,250
$521,083
$391,000
$425,000
$450,000
-
$469,667
$416,726
$467,500
$373,000
$316,000
The Van Gogh
$699,500
Median Price
Past 12 months
Past 12 months
$640,000
$645,000
$678,000
$660,500
$703,250
$640,000
$600,000
$710,000
$607,500
$720,000
$578,750
$540,500
$535,000
$391,000
$425,000
$450,000
-
$430,000
$405,000
$467,500
$388,000
$316,000
The Van Gogh
N/A
Avg. Price / ft2
Past 12 months
Past 12 months
-
-
-
-
-
-
-
$1,468
-
$1,621
$1,109
-
-
$869
-
$880
$1,307
$908
$933
$576
$716
$557
The Van Gogh
$1,137,500
Avg. Price
Past 12 months
Past 12 months
$917,500
$1,168,333
-
-
-
-
$1,300,000
$1,079,133
$984,750
$1,173,333
$733,000
-
$781,500
$657,500
-
$572,667
$915,000
$590,000
$587,500
$374,604
$491,667
$415,000
The Van Gogh
$1,137,500
Median Price
Past 12 months
Past 12 months
$917,500
$1,120,000
-
-
-
-
$1,300,000
$1,069,163
$1,024,500
$1,250,000
$770,000
-
$781,500
$657,500
-
$632,000
$915,000
$590,000
$587,500
$374,604
$525,000
$415,000
The Van Gogh
N/A
Avg. Price / ft2
Past 12 months
Past 12 months
-
-
$2,440
$1,632
-
-
-
-
-
-
-
$1,664
$1,295
-
-
-
-
-
$1,091
-
-
$597
The Van Gogh
N/A
Avg. Price
Past 12 months
Past 12 months
$2,295,000
$1,950,000
$3,725,000
$1,795,000
-
$2,150,000
-
$2,100,000
$2,200,000
$2,400,000
-
$1,830,000
$1,425,000
$1,330,000
-
-
$1,833,333
-
$1,200,000
-
-
$738,750
The Van Gogh
N/A
Median Price
Past 12 months
Past 12 months
$2,295,000
$1,950,000
$3,725,000
$1,795,000
-
$2,150,000
-
$2,100,000
$2,200,000
$2,400,000
-
$1,830,000
$1,425,000
$1,330,000
-
-
$1,833,333
-
$1,200,000
-
-
$738,750
The Van Gogh
N/A
Avg. Price / ft2
Past 12 months
Past 12 months
-
$1,630
-
-
-
-
-
-
-
-
-
-
-
-
-
-
-
-
-
-
-
-
The Van Gogh
N/A
Avg. Price
Past 12 months
Past 12 months
-
$2,550,000
-
-
-
-
-
-
-
-
-
-
-
-
-
-
-
-
-
-
-
-
The Van Gogh
N/A
Median Price
Past 12 months
Past 12 months
-
$2,550,000
-
-
-
-
-
-
-
-
-
-
-
-
-
-
-
-
-
-
-
-
The Van Gogh
N/A
Avg. Price / ft2
Past 12 months
Past 12 months
-
-
-
-
-
-
-
-
-
-
-
-
-
-
-
-
-
-
-
-
-
-
The Van Gogh
N/A
Avg. Price
Past 12 months
Past 12 months
-
-
-
-
-
-
-
-
-
-
-
-
-
-
-
-
-
-
-
-
-
-
The Van Gogh
N/A
Median Price
Past 12 months
Past 12 months
-
-
-
-
-
-
-
-
-
-
-
-
-
-
-
-
-
-
-
-
-
-
The Van Gogh
N/A
Avg. Price / ft2
Past 12 months
Past 12 months
-
-
-
-
-
-
-
-
-
-
-
-
-
-
-
-
-
-
-
-
-
-
The Van Gogh
N/A
Avg. Price
Past 12 months
Past 12 months
-
-
-
-
-
-
-
-
-
-
-
-
-
-
-
-
-
-
-
-
-
-
The Van Gogh
N/A
Median Price
Past 12 months
Past 12 months
-
-
-
-
-
-
-
-
-
-
-
-
-
-
-
-
-
-
-
-
-
-
Tudor Arms
$995
Avg. Price / ft2
Past 12 months
Past 12 months
-
$1,350
$1,738
$1,417
-
$1,198
$1,083
$1,500
-
-
-
-
$1,046
-
-
-
$1,002
$943
$1,017
-
-
-
Tudor Arms
$936,000
Avg. Price
Past 12 months
Past 12 months
$1,099,125
$871,403
$927,667
$850,000
-
$716,800
$650,000
$710,000
-
-
$895,000
$850,000
$627,700
$537,000
-
$550,000
$663,000
$520,767
$501,621
-
-
-
Tudor Arms
$995,000
Median Price
Past 12 months
Past 12 months
$1,099,125
$810,000
$985,000
$850,000
-
$705,000
$650,000
$710,000
-
-
$895,000
$850,000
$627,700
$537,000
-
$550,000
$663,000
$582,500
$501,621
-
-
-
Tudor Arms
N/A
Avg. Price / ft2
Past 12 months
Past 12 months
-
-
-
-
-
-
-
$1,500
-
-
-
-
-
-
-
-
-
$912
-
-
-
-
Tudor Arms
$580,000
Avg. Price
Past 12 months
Past 12 months
-
$654,209
$698,000
-
-
$415,800
-
$600,000
-
-
-
-
-
$299,000
-
-
-
$364,800
-
-
-
-
Tudor Arms
$580,000
Median Price
Past 12 months
Past 12 months
-
$654,209
$698,000
-
-
$415,800
-
$600,000
-
-
-
-
-
$299,000
-
-
-
$364,800
-
-
-
-
Tudor Arms
N/A
Avg. Price / ft2
Past 12 months
Past 12 months
-
$1,350
$1,738
$1,417
-
$1,141
$1,083
-
-
-
-
-
$1,046
-
-
-
$1,002
$958
-
-
-
-
Tudor Arms
$1,035,000
Avg. Price
Past 12 months
Past 12 months
$1,099,125
$980,000
$1,042,500
$850,000
-
$708,750
$650,000
$820,000
-
-
$895,000
$850,000
$627,700
$775,000
-
$550,000
$663,000
$598,750
$189,660
-
-
-
Tudor Arms
$1,130,000
Median Price
Past 12 months
Past 12 months
$1,099,125
$980,000
$1,042,500
$850,000
-
$705,000
$650,000
$820,000
-
-
$895,000
$850,000
$627,700
$775,000
-
$550,000
$663,000
$598,750
$189,660
-
-
-
Tudor Arms
N/A
Avg. Price / ft2
Past 12 months
Past 12 months
-
-
-
-
-
$1,313
-
-
-
-
-
-
-
-
-
-
-
-
$1,017
-
-
-
Tudor Arms
N/A
Avg. Price
Past 12 months
Past 12 months
-
-
-
-
-
$1,050,000
-
-
-
-
-
-
-
-
-
-
-
-
$813,581
-
-
-
Tudor Arms
N/A
Median Price
Past 12 months
Past 12 months
-
-
-
-
-
$1,050,000
-
-
-
-
-
-
-
-
-
-
-
-
$813,581
-
-
-
Tudor Arms
$995
Avg. Price / ft2
Past 12 months
Past 12 months
-
-
-
-
-
-
-
-
-
-
-
-
-
-
-
-
-
-
-
-
-
-
Tudor Arms
$995,000
Avg. Price
Past 12 months
Past 12 months
-
-
-
-
-
-
-
-
-
-
-
-
-
-
-
-
-
-
-
-
-
-
Tudor Arms
$995,000
Median Price
Past 12 months
Past 12 months
-
-
-
-
-
-
-
-
-
-
-
-
-
-
-
-
-
-
-
-
-
-
Tudor Arms
N/A
Avg. Price / ft2
Past 12 months
Past 12 months
-
-
-
-
-
-
-
-
-
-
-
-
-
-
-
-
-
-
-
-
-
-
Tudor Arms
N/A
Avg. Price
Past 12 months
Past 12 months
-
-
-
-
-
-
-
-
-
-
-
-
-
-
-
-
-
-
-
-
-
-
Tudor Arms
N/A
Median Price
Past 12 months
Past 12 months
-
-
-
-
-
-
-
-
-
-
-
-
-
-
-
-
-
-
-
-
-
-
Harbor House
N/A
Avg. Price / ft2
Past 12 months
Past 12 months
-
-
-
$1,400
-
$1,008
$1,056
$1,219
-
-
$1,512
$1,292
$1,025
-
$958
-
$1,163
$824
$879
$1,111
-
$610
Harbor House
$2,900,000
Avg. Price
Past 12 months
Past 12 months
$1,366,333
$2,425,000
$2,650,000
$840,000
-
$1,352,500
$845,000
$837,500
-
$2,447,667
$1,763,333
$1,833,333
$1,186,667
$1,409,750
$1,016,667
-
$757,500
$736,362
$807,727
$838,533
$839,000
$520,750
Harbor House
$2,900,000
Median Price
Past 12 months
Past 12 months
$949,000
$2,425,000
$2,650,000
$840,000
-
$1,352,500
$845,000
$837,500
-
$3,045,000
$2,030,000
$1,825,000
$645,000
$1,389,000
$1,130,000
-
$757,500
$735,000
$680,000
$719,500
$839,000
$520,750
Harbor House
N/A
Avg. Price / ft2
Past 12 months
Past 12 months
-
-
-
-
-
-
-
-
-
-
-
-
-
-
-
-
-
-
-
-
-
-
Harbor House
N/A
Avg. Price
Past 12 months
Past 12 months
-
-
-
-
-
-
-
-
-
-
-
-
-
-
-
-
-
-
-
-
-
-
Harbor House
N/A
Median Price
Past 12 months
Past 12 months
-
-
-
-
-
-
-
-
-
-
-
-
-
-
-
-
-
-
-
-
-
-
Harbor House
N/A
Avg. Price / ft2
Past 12 months
Past 12 months
-
-
-
$1,400
-
$1,008
$1,056
$1,219
-
-
$1,344
-
$1,025
-
$975
-
$1,163
$843
$879
$1,111
-
-
Harbor House
N/A
Avg. Price
Past 12 months
Past 12 months
$899,500
$1,200,000
-
$840,000
-
$605,000
$845,000
$837,500
-
$799,000
$1,075,000
-
$630,000
$729,500
$585,000
-
$757,500
$622,953
$684,659
$609,925
$382,000
$310,000
Harbor House
N/A
Median Price
Past 12 months
Past 12 months
$899,500
$1,200,000
-
$840,000
-
$605,000
$845,000
$837,500
-
$799,000
$1,075,000
-
$630,000
$729,500
$585,000
-
$757,500
$720,000
$664,318
$537,850
$382,000
$310,000
Harbor House
N/A
Avg. Price / ft2
Past 12 months
Past 12 months
-
-
-
-
-
-
-
-
-
-
$1,681
$1,521
-
-
$942
-
-
-
-
-
-
$610
Harbor House
$2,900,000
Avg. Price
Past 12 months
Past 12 months
$2,300,000
$3,650,000
$2,475,000
-
-
$2,100,000
-
-
-
-
$2,107,500
$1,900,000
$2,300,000
$2,000,000
$1,232,500
-
-
-
$1,300,000
$1,272,000
-
$731,500
Harbor House
$2,900,000
Median Price
Past 12 months
Past 12 months
$2,300,000
$3,650,000
$2,475,000
-
-
$2,100,000
-
-
-
-
$2,107,500
$1,900,000
$2,300,000
$2,000,000
$1,232,500
-
-
-
$1,300,000
$1,272,000
-
$731,500
Harbor House
N/A
Avg. Price / ft2
Past 12 months
Past 12 months
-
-
-
-
-
-
-
-
-
-
-
$1,063
-
-
-
-
-
$744
-
-
-
-
Harbor House
N/A
Avg. Price
Past 12 months
Past 12 months
-
-
$2,825,000
-
-
-
-
-
-
$3,272,000
-
$1,700,000
-
$2,180,000
-
-
-
$1,190,000
-
-
-
-
Harbor House
N/A
Median Price
Past 12 months
Past 12 months
-
-
$2,825,000
-
-
-
-
-
-
$3,272,000
-
$1,700,000
-
$2,180,000
-
-
-
$1,190,000
-
-
-
-
Harbor House
N/A
Avg. Price / ft2
Past 12 months
Past 12 months
-
-
-
-
-
-
-
-
-
-
-
-
-
-
-
-
-
-
-
-
-
-
Harbor House
N/A
Avg. Price
Past 12 months
Past 12 months
-
-
-
-
-
-
-
-
-
-
-
-
-
-
-
-
-
-
-
-
-
-
Harbor House
N/A
Median Price
Past 12 months
Past 12 months
-
-
-
-
-
-
-
-
-
-
-
-
-
-
-
-
-
-
-
-
-
-
Harbor House
N/A
Avg. Price / ft2
Past 12 months
Past 12 months
-
-
-
-
-
-
-
-
-
-
-
-
-
-
-
-
-
-
-
-
-
-
Harbor House
N/A
Avg. Price
Past 12 months
Past 12 months
-
-
-
-
-
-
-
-
-
-
-
-
-
-
-
-
-
-
-
-
-
-
Harbor House
N/A
Median Price
Past 12 months
Past 12 months
-
-
-
-
-
-
-
-
-
-
-
-
-
-
-
-
-
-
-
-
-
-
720 Greenwich Street
N/A
Avg. Price / ft2
Past 12 months
Past 12 months
-
$1,150
$1,469
$1,860
-
$1,311
$1,029
-
$2,367
$1,446
-
$1,244
$1,200
$982
$1,091
$853
$1,138
$1,010
$869
$925
$763
$588
720 Greenwich Street
$3,353,333
Avg. Price
Past 12 months
Past 12 months
$805,000
$754,750
$1,183,761
$2,135,000
-
$992,000
$709,000
$1,360,000
$2,220,000
$1,265,000
$1,295,000
$740,250
$1,124,444
$788,813
$855,038
$720,000
$896,750
$567,000
$619,000
$785,833
$650,167
$512,944
720 Greenwich Street
$3,353,333
Median Price
Past 12 months
Past 12 months
$770,000
$732,000
$975,000
$2,060,000
-
$1,100,000
$720,000
$1,360,000
$2,830,000
$1,265,000
$1,295,000
$755,500
$960,000
$615,000
$840,575
$720,000
$843,500
$567,000
$545,000
$710,000
$777,500
$500,000
720 Greenwich Street
N/A
Avg. Price / ft2
Past 12 months
Past 12 months
-
$1,150
$1,341
-
-
$1,435
$1,036
-
-
-
-
-
$914
$898
$998
$811
$948
$1,010
$857
$781
$640
$487
720 Greenwich Street
N/A
Avg. Price
Past 12 months
Past 12 months
$770,000
$754,750
$733,333
$880,000
-
$689,000
$707,000
-
-
-
-
-
$580,000
$462,125
$499,000
$365,000
$550,000
$505,000
$408,000
$375,000
$288,000
$254,167
720 Greenwich Street
N/A
Median Price
Past 12 months
Past 12 months
$770,000
$732,000
$665,000
$880,000
-
$689,000
$725,000
-
-
-
-
-
$580,000
$474,250
$499,000
$365,000
$550,000
$505,000
$400,000
$375,000
$288,000
$287,500
720 Greenwich Street
N/A
Avg. Price / ft2
Past 12 months
Past 12 months
-
-
$1,308
$1,860
-
$1,187
$1,021
-
$2,367
$1,446
-
$1,244
$1,271
$1,071
$1,122
-
$1,202
-
$885
$972
$885
$649
720 Greenwich Street
N/A
Avg. Price
Past 12 months
Past 12 months
$840,000
-
$1,222,108
$2,060,000
-
$1,143,500
$715,000
$1,360,000
$1,915,000
$1,265,000
$1,295,000
$937,000
$1,126,667
$787,333
$973,717
-
$1,012,333
$629,000
$830,000
$747,500
$831,250
$642,333
720 Greenwich Street
N/A
Median Price
Past 12 months
Past 12 months
$840,000
-
$1,100,000
$2,060,000
-
$1,143,500
$715,000
$1,360,000
$1,915,000
$1,265,000
$1,295,000
$769,000
$1,045,000
$817,000
$1,062,150
-
$950,000
$629,000
$840,000
$710,000
$831,250
$647,000
720 Greenwich Street
N/A
Avg. Price / ft2
Past 12 months
Past 12 months
-
-
$2,017
-
-
-
-
-
-
-
-
-
-
-
-
$896
-
-
-
-
-
-
720 Greenwich Street
$3,353,333
Avg. Price
Past 12 months
Past 12 months
-
-
$2,420,000
-
-
-
-
-
$2,830,000
-
-
$150,000
$2,200,000
-
-
$1,075,000
-
-
-
$1,350,000
-
-
720 Greenwich Street
$3,353,333
Median Price
Past 12 months
Past 12 months
-
-
$2,420,000
-
-
-
-
-
$2,830,000
-
-
$150,000
$2,200,000
-
-
$1,075,000
-
-
-
$1,350,000
-
-
720 Greenwich Street
N/A
Avg. Price / ft2
Past 12 months
Past 12 months
-
-
-
-
-
-
-
-
-
-
-
-
-
$1,135
-
-
-
-
-
-
-
-
720 Greenwich Street
N/A
Avg. Price
Past 12 months
Past 12 months
-
-
-
$3,540,000
-
-
-
-
-
-
-
-
-
$2,100,000
-
-
-
-
-
-
-
-
720 Greenwich Street
N/A
Median Price
Past 12 months
Past 12 months
-
-
-
$3,540,000
-
-
-
-
-
-
-
-
-
$2,100,000
-
-
-
-
-
-
-
-
720 Greenwich Street
N/A
Avg. Price / ft2
Past 12 months
Past 12 months
-
-
-
-
-
-
-
-
-
-
-
-
-
-
-
-
-
-
-
-
-
-
720 Greenwich Street
N/A
Avg. Price
Past 12 months
Past 12 months
-
-
-
-
-
-
-
-
-
-
-
-
-
-
-
-
-
-
-
-
-
-
720 Greenwich Street
N/A
Median Price
Past 12 months
Past 12 months
-
-
-
-
-
-
-
-
-
-
-
-
-
-
-
-
-
-
-
-
-
-
720 Greenwich Street
N/A
Avg. Price / ft2
Past 12 months
Past 12 months
-
-
-
-
-
-
-
-
-
-
-
-
-
-
-
-
-
-
-
-
-
-
720 Greenwich Street
N/A
Avg. Price
Past 12 months
Past 12 months
-
-
-
-
-
-
-
-
-
-
-
-
-
-
-
-
-
-
-
-
-
-
720 Greenwich Street
N/A
Median Price
Past 12 months
Past 12 months
-
-
-
-
-
-
-
-
-
-
-
-
-
-
-
-
-
-
-
-
-
-
The Rembrandt
N/A
Avg. Price / ft2
Past 12 months
Past 12 months
$2,045
-
$1,728
$1,233
$1,238
-
$1,312
$1,489
$1,445
-
$1,348
$1,359
$1,103
-
$1,051
$874
$1,168
$1,001
$1,021
$841
$698
$816
The Rembrandt
$1,837,500
Avg. Price
Past 12 months
Past 12 months
$1,615,000
$1,799,478
$856,667
$807,300
$720,000
$700,000
$861,000
$1,086,167
$768,250
$952,167
$727,500
$1,148,167
$1,617,500
$679,000
$462,500
$603,640
$534,167
$713,257
$793,357
$393,333
$350,000
$603,143
The Rembrandt
$1,837,500
Median Price
Past 12 months
Past 12 months
$1,250,000
$2,038,433
$840,000
$658,000
$705,000
$700,000
$675,000
$776,000
$735,000
$727,500
$642,500
$640,000
$1,617,500
$679,000
$462,500
$460,000
$555,000
$573,901
$525,000
$370,000
$360,000
$460,000
The Rembrandt
N/A
Avg. Price / ft2
Past 12 months
Past 12 months
-
-
$1,728
$1,233
$1,238
-
$1,312
$1,489
$1,445
-
$1,142
$1,123
$1,103
-
$1,051
$805
$1,168
$998
$1,021
$841
$698
$600
The Rembrandt
N/A
Avg. Price
Past 12 months
Past 12 months
$800,000
-
$856,667
$634,125
$720,000
$700,000
$642,500
$723,000
$691,667
$678,250
$603,333
$613,500
$535,000
$418,000
$462,500
$429,550
$534,167
$519,124
$506,000
$440,000
$350,000
$227,500
The Rembrandt
N/A
Median Price
Past 12 months
Past 12 months
$800,000
-
$840,000
$594,000
$705,000
$700,000
$625,000
$723,000
$675,000
$678,250
$630,000
$602,000
$535,000
$418,000
$462,500
$428,000
$555,000
$561,378
$504,500
$440,000
$360,000
$227,500
The Rembrandt
N/A
Avg. Price / ft2
Past 12 months
Past 12 months
$1,563
-
-
-
-
-
-
-
-
-
$1,760
-
-
-
-
-
-
-
-
-
-
-
The Rembrandt
N/A
Avg. Price
Past 12 months
Past 12 months
$1,405,000
$1,265,000
-
-
-
-
-
-
$998,000
$1,500,000
$1,100,000
-
-
$940,000
-
-
-
-
$720,000
$300,000
-
$474,000
The Rembrandt
N/A
Median Price
Past 12 months
Past 12 months
$1,405,000
$1,265,000
-
-
-
-
-
-
$998,000
$1,500,000
$1,100,000
-
-
$940,000
-
-
-
-
$720,000
$300,000
-
$460,000
The Rembrandt
N/A
Avg. Price / ft2
Past 12 months
Past 12 months
$2,528
-
-
-
-
-
-
-
-
-
-
$2,066
-
-
-
$1,083
-
$1,007
-
-
-
$1,031
The Rembrandt
$1,837,500
Avg. Price
Past 12 months
Past 12 months
$3,665,000
$2,066,717
-
$1,500,000
-
-
$1,735,000
$1,812,500
-
-
-
$2,217,500
-
-
-
$1,300,000
-
$1,101,524
$1,404,750
-
-
$1,172,500
The Rembrandt
$1,837,500
Median Price
Past 12 months
Past 12 months
$3,665,000
$2,066,717
-
$1,500,000
-
-
$1,735,000
$1,812,500
-
-
-
$2,217,500
-
-
-
$1,300,000
-
$1,101,524
$1,404,750
-
-
$1,172,500
The Rembrandt
N/A
Avg. Price / ft2
Past 12 months
Past 12 months
-
-
-
-
-
-
-
-
-
-
-
-
-
-
-
-
-
-
-
-
-
-
The Rembrandt
N/A
Avg. Price
Past 12 months
Past 12 months
-
-
-
-
-
-
-
-
-
-
-
-
$2,700,000
-
-
-
-
-
-
-
-
-
The Rembrandt
N/A
Median Price
Past 12 months
Past 12 months
-
-
-
-
-
-
-
-
-
-
-
-
$2,700,000
-
-
-
-
-
-
-
-
-
The Rembrandt
N/A
Avg. Price / ft2
Past 12 months
Past 12 months
-
-
-
-
-
-
-
-
-
-
-
-
-
-
-
-
-
-
-
-
-
-
The Rembrandt
N/A
Avg. Price
Past 12 months
Past 12 months
-
-
-
-
-
-
-
-
-
-
-
-
-
-
-
-
-
-
-
-
-
-
The Rembrandt
N/A
Median Price
Past 12 months
Past 12 months
-
-
-
-
-
-
-
-
-
-
-
-
-
-
-
-
-
-
-
-
-
-
The Rembrandt
N/A
Avg. Price / ft2
Past 12 months
Past 12 months
-
-
-
-
-
-
-
-
-
-
-
-
-
-
-
-
-
-
-
-
-
-
The Rembrandt
N/A
Avg. Price
Past 12 months
Past 12 months
-
-
-
-
-
-
-
-
-
-
-
-
-
-
-
-
-
-
-
-
-
-
The Rembrandt
N/A
Median Price
Past 12 months
Past 12 months
-
-
-
-
-
-
-
-
-
-
-
-
-
-
-
-
-
-
-
-
-
-