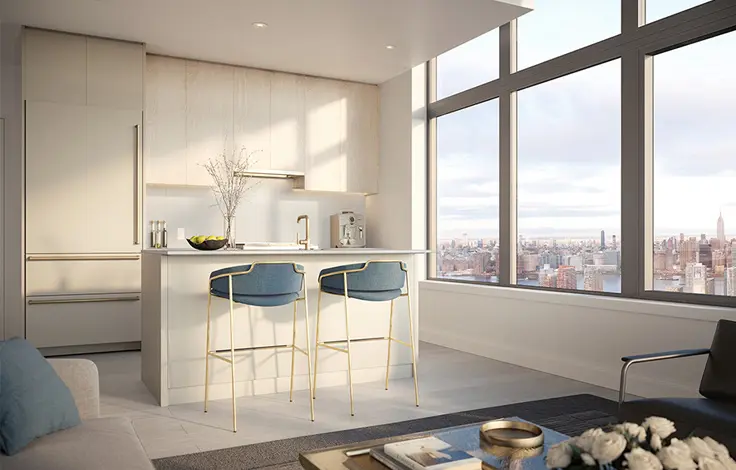
228 Bushwick Avenue: Price Comparison
between Meserole Street & Montrose Avenue View Full Building Profile
228 Bushwick Avenue
N/A
Avg. Price / ft2
Past 12 months
Past 12 months
2023
$1,080
2022
$1,094
2021
-
2020
-
2019
$1,001
2018
$1,109
2017
$947
2016
$976
2015
$1,110
2014
$938
2013
-
2012
$554
2011
$533
2010
-
2009
-
2008
-
2007
-
2006
-
2005
-
2004
-
2003
-
228 Bushwick Avenue
N/A
Avg. Price
Past 12 months
Past 12 months
2023
$850,000
2022
$832,500
2021
-
2020
-
2019
$578,750
2018
$599,000
2017
$736,600
2016
$768,000
2015
$776,667
2014
$915,000
2013
-
2012
$423,544
2011
$376,441
2010
-
2009
-
2008
-
2007
-
2006
-
2005
-
2004
-
2003
-
228 Bushwick Avenue
N/A
Median Price / ft2
Past 12 months
Past 12 months
2023
$1,080
2022
$1,056
2021
-
2020
-
2019
$1,001
2018
$1,109
2017
$947
2016
$976
2015
$1,135
2014
$938
2013
-
2012
$553
2011
$529
2010
-
2009
-
2008
-
2007
-
2006
-
2005
-
2004
-
2003
-
228 Bushwick Avenue
N/A
Median Price
Past 12 months
Past 12 months
2023
$850,000
2022
$755,000
2021
-
2020
-
2019
$578,750
2018
$599,000
2017
$736,600
2016
$768,000
2015
$765,000
2014
$915,000
2013
-
2012
$442,306
2011
$372,000
2010
-
2009
-
2008
-
2007
-
2006
-
2005
-
2004
-
2003
-
228 Bushwick Avenue
N/A
Avg. Price / ft2
Past 12 months
Past 12 months
2023
-
2022
-
2021
-
2020
-
2019
-
2018
-
2017
-
2016
-
2015
-
2014
-
2013
-
2012
-
2011
-
2010
-
2009
-
2008
-
2007
-
2006
-
2005
-
2004
-
2003
-
228 Bushwick Avenue
N/A
Avg. Price
Past 12 months
Past 12 months
2023
-
2022
-
2021
-
2020
-
2019
-
2018
-
2017
-
2016
-
2015
-
2014
-
2013
-
2012
-
2011
-
2010
-
2009
-
2008
-
2007
-
2006
-
2005
-
2004
-
2003
-
228 Bushwick Avenue
N/A
Median Price / ft2
Past 12 months
Past 12 months
2023
-
2022
-
2021
-
2020
-
2019
-
2018
-
2017
-
2016
-
2015
-
2014
-
2013
-
2012
-
2011
-
2010
-
2009
-
2008
-
2007
-
2006
-
2005
-
2004
-
2003
-
228 Bushwick Avenue
N/A
Median Price
Past 12 months
Past 12 months
2023
-
2022
-
2021
-
2020
-
2019
-
2018
-
2017
-
2016
-
2015
-
2014
-
2013
-
2012
-
2011
-
2010
-
2009
-
2008
-
2007
-
2006
-
2005
-
2004
-
2003
-
228 Bushwick Avenue
N/A
Avg. Price / ft2
Past 12 months
Past 12 months
2023
-
2022
$1,054
2021
-
2020
-
2019
$1,001
2018
$1,109
2017
$1,048
2016
-
2015
$1,170
2014
-
2013
-
2012
$556
2011
$538
2010
-
2009
-
2008
-
2007
-
2006
-
2005
-
2004
-
2003
-
228 Bushwick Avenue
N/A
Avg. Price
Past 12 months
Past 12 months
2023
-
2022
$637,500
2021
-
2020
-
2019
$578,750
2018
$599,000
2017
$611,000
2016
-
2015
$757,500
2014
-
2013
-
2012
$331,770
2011
$319,503
2010
-
2009
-
2008
-
2007
-
2006
-
2005
-
2004
-
2003
-
228 Bushwick Avenue
N/A
Median Price / ft2
Past 12 months
Past 12 months
2023
-
2022
$1,054
2021
-
2020
-
2019
$1,001
2018
$1,109
2017
$1,048
2016
-
2015
$1,170
2014
-
2013
-
2012
$553
2011
$532
2010
-
2009
-
2008
-
2007
-
2006
-
2005
-
2004
-
2003
-
228 Bushwick Avenue
N/A
Median Price
Past 12 months
Past 12 months
2023
-
2022
$637,500
2021
-
2020
-
2019
$578,750
2018
$599,000
2017
$611,000
2016
-
2015
$757,500
2014
-
2013
-
2012
$334,620
2011
$305,000
2010
-
2009
-
2008
-
2007
-
2006
-
2005
-
2004
-
2003
-
228 Bushwick Avenue
N/A
Avg. Price / ft2
Past 12 months
Past 12 months
2023
$1,080
2022
$1,135
2021
-
2020
-
2019
-
2018
-
2017
$845
2016
$976
2015
$988
2014
$938
2013
-
2012
$554
2011
$526
2010
-
2009
-
2008
-
2007
-
2006
-
2005
-
2004
-
2003
-
228 Bushwick Avenue
N/A
Avg. Price
Past 12 months
Past 12 months
2023
$850,000
2022
$1,027,500
2021
-
2020
-
2019
-
2018
-
2017
$862,200
2016
$768,000
2015
$815,000
2014
$915,000
2013
-
2012
$469,432
2011
$461,847
2010
-
2009
-
2008
-
2007
-
2006
-
2005
-
2004
-
2003
-
228 Bushwick Avenue
N/A
Median Price / ft2
Past 12 months
Past 12 months
2023
$1,080
2022
$1,135
2021
-
2020
-
2019
-
2018
-
2017
$845
2016
$976
2015
$988
2014
$938
2013
-
2012
$555
2011
$529
2010
-
2009
-
2008
-
2007
-
2006
-
2005
-
2004
-
2003
-
228 Bushwick Avenue
N/A
Median Price
Past 12 months
Past 12 months
2023
$850,000
2022
$1,027,500
2021
-
2020
-
2019
-
2018
-
2017
$862,200
2016
$768,000
2015
$815,000
2014
$915,000
2013
-
2012
$456,750
2011
$434,025
2010
-
2009
-
2008
-
2007
-
2006
-
2005
-
2004
-
2003
-
228 Bushwick Avenue
N/A
Avg. Price / ft2
Past 12 months
Past 12 months
2023
-
2022
-
2021
-
2020
-
2019
-
2018
-
2017
-
2016
-
2015
-
2014
-
2013
-
2012
-
2011
-
2010
-
2009
-
2008
-
2007
-
2006
-
2005
-
2004
-
2003
-
228 Bushwick Avenue
N/A
Avg. Price
Past 12 months
Past 12 months
2023
-
2022
-
2021
-
2020
-
2019
-
2018
-
2017
-
2016
-
2015
-
2014
-
2013
-
2012
-
2011
-
2010
-
2009
-
2008
-
2007
-
2006
-
2005
-
2004
-
2003
-
228 Bushwick Avenue
N/A
Median Price / ft2
Past 12 months
Past 12 months
2023
-
2022
-
2021
-
2020
-
2019
-
2018
-
2017
-
2016
-
2015
-
2014
-
2013
-
2012
-
2011
-
2010
-
2009
-
2008
-
2007
-
2006
-
2005
-
2004
-
2003
-
228 Bushwick Avenue
N/A
Median Price
Past 12 months
Past 12 months
2023
-
2022
-
2021
-
2020
-
2019
-
2018
-
2017
-
2016
-
2015
-
2014
-
2013
-
2012
-
2011
-
2010
-
2009
-
2008
-
2007
-
2006
-
2005
-
2004
-
2003
-
228 Bushwick Avenue
N/A
Avg. Price / ft2
Past 12 months
Past 12 months
2023
-
2022
-
2021
-
2020
-
2019
-
2018
-
2017
-
2016
-
2015
-
2014
-
2013
-
2012
-
2011
-
2010
-
2009
-
2008
-
2007
-
2006
-
2005
-
2004
-
2003
-
228 Bushwick Avenue
N/A
Avg. Price
Past 12 months
Past 12 months
2023
-
2022
-
2021
-
2020
-
2019
-
2018
-
2017
-
2016
-
2015
-
2014
-
2013
-
2012
-
2011
-
2010
-
2009
-
2008
-
2007
-
2006
-
2005
-
2004
-
2003
-
228 Bushwick Avenue
N/A
Median Price / ft2
Past 12 months
Past 12 months
2023
-
2022
-
2021
-
2020
-
2019
-
2018
-
2017
-
2016
-
2015
-
2014
-
2013
-
2012
-
2011
-
2010
-
2009
-
2008
-
2007
-
2006
-
2005
-
2004
-
2003
-
228 Bushwick Avenue
N/A
Median Price
Past 12 months
Past 12 months
2023
-
2022
-
2021
-
2020
-
2019
-
2018
-
2017
-
2016
-
2015
-
2014
-
2013
-
2012
-
2011
-
2010
-
2009
-
2008
-
2007
-
2006
-
2005
-
2004
-
2003
-