201 East 79th Street: Price Comparison
between Third Avenue & Second Avenue Building Profile
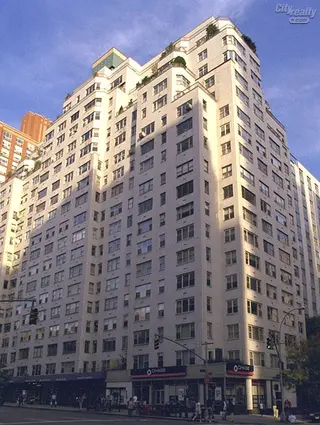
201 East 79th Street
$1,242,501
Avg. Price
Past 12 months
Past 12 months
2024
$1,468,333
2023
$1,062,500
2022
$1,863,167
2021
-
2020
$700,000
2019
$1,532,550
2018
$1,157,797
2017
$1,253,750
2016
$1,948,650
2015
$1,802,000
2014
$1,672,486
2013
$1,140,075
2012
$970,833
2011
$982,808
2010
-
2009
$1,197,500
2008
$1,367,714
2007
$1,295,222
2006
$1,069,683
2005
$1,124,970
2004
$854,000
2003
$885,357
201 East 79th Street
$1,225,000
Median Price
Past 12 months
Past 12 months
2024
$1,537,500
2023
$1,062,500
2022
$1,739,500
2021
-
2020
$700,000
2019
$1,532,550
2018
$1,007,500
2017
$1,237,500
2016
$1,895,000
2015
$1,700,000
2014
$1,527,371
2013
$952,500
2012
$882,500
2011
$984,000
2010
-
2009
$1,200,000
2008
$1,244,000
2007
$1,295,000
2006
$1,117,500
2005
$995,000
2004
$852,000
2003
$895,000
201 East 79th Street
N/A
Avg. Price
Past 12 months
Past 12 months
2024
-
2023
-
2022
-
2021
-
2020
-
2019
-
2018
-
2017
-
2016
-
2015
-
2014
-
2013
-
2012
-
2011
-
2010
-
2009
-
2008
-
2007
-
2006
-
2005
-
2004
-
2003
-
201 East 79th Street
N/A
Median Price
Past 12 months
Past 12 months
2024
-
2023
-
2022
-
2021
-
2020
-
2019
-
2018
-
2017
-
2016
-
2015
-
2014
-
2013
-
2012
-
2011
-
2010
-
2009
-
2008
-
2007
-
2006
-
2005
-
2004
-
2003
-
201 East 79th Street
$792,500
Avg. Price
Past 12 months
Past 12 months
2024
$1,155,000
2023
$915,000
2022
$825,000
2021
-
2020
$700,000
2019
-
2018
$1,013,750
2017
$846,250
2016
$904,500
2015
$955,000
2014
$1,198,000
2013
$742,333
2012
$641,667
2011
$761,500
2010
-
2009
$622,500
2008
$660,000
2007
$638,000
2006
$735,000
2005
$736,625
2004
$450,000
2003
-
201 East 79th Street
$792,500
Median Price
Past 12 months
Past 12 months
2024
$1,155,000
2023
$915,000
2022
$825,000
2021
-
2020
$700,000
2019
-
2018
$1,002,500
2017
$846,250
2016
$904,500
2015
$955,000
2014
$1,198,000
2013
$760,000
2012
$750,000
2011
$761,500
2010
-
2009
$622,500
2008
$665,000
2007
$650,000
2006
$645,000
2005
$724,500
2004
$450,000
2003
-
201 East 79th Street
$1,390,625
Avg. Price
Past 12 months
Past 12 months
2024
$1,625,000
2023
$1,210,000
2022
$1,739,500
2021
-
2020
-
2019
$1,532,550
2018
$1,301,844
2017
$1,661,250
2016
$1,973,571
2015
$1,826,667
2014
$1,720,624
2013
$1,217,292
2012
$1,300,000
2011
$1,175,833
2010
-
2009
$1,196,875
2008
$1,414,667
2007
$1,400,000
2006
$1,184,525
2005
$1,001,450
2004
$934,800
2003
$917,500
201 East 79th Street
$1,375,000
Median Price
Past 12 months
Past 12 months
2024
$1,625,000
2023
$1,210,000
2022
$1,739,500
2021
-
2020
-
2019
$1,532,550
2018
$1,212,500
2017
$1,661,250
2016
$1,930,000
2015
$1,700,000
2014
$1,527,371
2013
$1,160,000
2012
$1,300,000
2011
$1,260,000
2010
-
2009
$1,212,500
2008
$1,350,000
2007
$1,400,000
2006
$1,147,500
2005
$936,150
2004
$999,000
2003
$895,000
201 East 79th Street
$1,550,005
Avg. Price
Past 12 months
Past 12 months
2024
-
2023
-
2022
-
2021
-
2020
-
2019
-
2018
-
2017
-
2016
$3,862,500
2015
-
2014
$1,810,000
2013
$1,870,000
2012
-
2011
$1,335,000
2010
-
2009
$2,350,000
2008
$3,350,000
2007
$1,810,000
2006
$1,155,000
2005
$1,526,000
2004
-
2003
-
201 East 79th Street
$1,550,005
Median Price
Past 12 months
Past 12 months
2024
-
2023
-
2022
-
2021
-
2020
-
2019
-
2018
-
2017
-
2016
$3,862,500
2015
-
2014
$1,810,000
2013
$1,870,000
2012
-
2011
$1,335,000
2010
-
2009
$2,350,000
2008
$3,350,000
2007
$1,810,000
2006
$1,155,000
2005
$1,625,000
2004
-
2003
-
201 East 79th Street
N/A
Avg. Price
Past 12 months
Past 12 months
2024
-
2023
-
2022
-
2021
-
2020
-
2019
-
2018
-
2017
-
2016
-
2015
-
2014
-
2013
-
2012
-
2011
$141,960
2010
-
2009
-
2008
-
2007
-
2006
-
2005
-
2004
-
2003
-
201 East 79th Street
N/A
Median Price
Past 12 months
Past 12 months
2024
-
2023
-
2022
-
2021
-
2020
-
2019
-
2018
-
2017
-
2016
-
2015
-
2014
-
2013
-
2012
-
2011
$141,960
2010
-
2009
-
2008
-
2007
-
2006
-
2005
-
2004
-
2003
-
201 East 79th Street
N/A
Avg. Price
Past 12 months
Past 12 months
2024
-
2023
-
2022
-
2021
-
2020
-
2019
-
2018
-
2017
-
2016
-
2015
-
2014
-
2013
-
2012
-
2011
-
2010
-
2009
-
2008
-
2007
-
2006
-
2005
-
2004
-
2003
-
201 East 79th Street
N/A
Median Price
Past 12 months
Past 12 months
2024
-
2023
-
2022
-
2021
-
2020
-
2019
-
2018
-
2017
-
2016
-
2015
-
2014
-
2013
-
2012
-
2011
-
2010
-
2009
-
2008
-
2007
-
2006
-
2005
-
2004
-
2003
-
Lenox Manor
N/A
Avg. Price / ft2
Past 12 months
Past 12 months
$1,098
$1,126
$867
$1,000
-
$1,283
$2,100
$1,112
$1,264
$990
-
-
$894
$915
$871
-
$800
$884
-
-
$506
$479
Lenox Manor
$967,667
Avg. Price
Past 12 months
Past 12 months
$947,455
$1,283,909
$1,257,500
$1,425,000
-
$1,950,333
$1,462,143
$1,173,250
$1,778,759
$950,125
$1,168,069
$1,182,986
$858,050
$881,600
$1,242,500
$964,000
$769,500
$1,725,286
$1,336,000
$716,643
$725,667
$563,875
Lenox Manor
$775,000
Median Price
Past 12 months
Past 12 months
$778,888
$1,450,000
$1,257,500
$1,425,000
-
$1,835,000
$1,450,000
$822,000
$1,710,000
$795,500
$1,255,000
$1,067,457
$995,000
$905,000
$872,500
$960,000
$741,500
$1,295,000
$1,150,000
$700,000
$707,500
$433,250
Lenox Manor
N/A
Avg. Price / ft2
Past 12 months
Past 12 months
$1,005
$934
-
-
-
-
$2,419
-
-
$990
-
-
$706
$800
-
-
$800
-
-
-
-
-
Lenox Manor
N/A
Avg. Price
Past 12 months
Past 12 months
$502,500
$467,000
-
-
-
-
$1,112,500
-
-
$495,000
-
$408,000
$353,000
$360,000
-
-
$400,000
-
-
$330,000
-
$237,000
Lenox Manor
N/A
Median Price
Past 12 months
Past 12 months
$502,500
$467,000
-
-
-
-
$1,112,500
-
-
$495,000
-
$408,000
$353,000
$360,000
-
-
$400,000
-
-
$330,000
-
$237,000
Lenox Manor
N/A
Avg. Price / ft2
Past 12 months
Past 12 months
$1,039
-
$867
-
-
-
-
$1,112
-
-
-
-
$1,067
$905
$828
-
-
$777
-
-
$506
$479
Lenox Manor
$626,111
Avg. Price
Past 12 months
Past 12 months
$870,296
$675,000
$715,000
-
-
$795,000
$785,000
$772,667
-
$795,500
$662,277
$825,000
$718,810
$681,667
$763,750
$592,500
$741,500
$591,500
-
$742,875
$516,250
$407,875
Lenox Manor
$650,000
Median Price
Past 12 months
Past 12 months
$778,888
$675,000
$715,000
-
-
$795,000
$785,000
$810,000
-
$795,500
$662,277
$825,000
$599,000
$610,000
$763,750
$592,500
$741,500
$591,500
-
$691,250
$516,250
$406,250
Lenox Manor
N/A
Avg. Price / ft2
Past 12 months
Past 12 months
$1,343
$1,242
-
$1,000
-
$1,385
$1,462
-
$1,264
-
-
-
$910
$952
-
-
-
$938
-
-
-
-
Lenox Manor
$1,480,000
Avg. Price
Past 12 months
Past 12 months
$1,508,150
$1,522,667
-
$1,200,000
-
$1,685,000
$1,450,000
-
$1,655,000
$1,637,500
$1,305,000
$1,161,638
$1,098,300
$1,117,200
-
$967,500
$1,167,000
$1,172,500
$1,225,000
$857,500
$1,010,500
$747,500
Lenox Manor
$1,480,000
Median Price
Past 12 months
Past 12 months
$1,508,150
$1,535,000
-
$1,200,000
-
$1,685,000
$1,450,000
-
$1,650,000
$1,637,500
$1,305,000
$1,069,163
$1,110,000
$1,085,000
-
$967,500
$1,167,000
$1,172,500
$1,150,000
$857,500
$966,500
$747,500
Lenox Manor
N/A
Avg. Price / ft2
Past 12 months
Past 12 months
-
$1,085
-
-
-
$1,232
-
-
-
-
-
-
-
-
$957
-
-
-
-
-
-
-
Lenox Manor
N/A
Avg. Price
Past 12 months
Past 12 months
-
$2,495,000
-
$1,650,000
-
$2,512,333
$2,875,000
$2,375,000
$2,150,035
$931,250
-
$2,380,000
-
-
$2,200,000
$1,700,000
-
$1,924,500
$2,325,000
-
-
$1,147,500
Lenox Manor
N/A
Median Price
Past 12 months
Past 12 months
-
$2,495,000
-
$1,650,000
-
$2,717,000
$2,875,000
$2,375,000
$2,150,035
$931,250
-
$2,380,000
-
-
$2,200,000
$1,700,000
-
$1,924,500
$2,325,000
-
-
$1,147,500
Lenox Manor
N/A
Avg. Price / ft2
Past 12 months
Past 12 months
-
-
-
-
-
-
-
-
-
-
-
-
-
-
-
-
-
-
-
-
-
-
Lenox Manor
N/A
Avg. Price
Past 12 months
Past 12 months
-
-
$1,800,000
-
-
-
-
-
-
-
-
-
-
-
-
-
-
$4,700,000
-
-
-
-
Lenox Manor
N/A
Median Price
Past 12 months
Past 12 months
-
-
$1,800,000
-
-
-
-
-
-
-
-
-
-
-
-
-
-
$4,700,000
-
-
-
-
Lenox Manor
N/A
Avg. Price / ft2
Past 12 months
Past 12 months
-
-
-
-
-
-
-
-
-
-
-
-
-
-
-
-
-
-
-
-
-
-
Lenox Manor
N/A
Avg. Price
Past 12 months
Past 12 months
-
-
-
-
-
-
-
-
-
-
-
-
-
-
-
-
-
-
-
-
-
-
Lenox Manor
N/A
Median Price
Past 12 months
Past 12 months
-
-
-
-
-
-
-
-
-
-
-
-
-
-
-
-
-
-
-
-
-
-
175 East 79th Street
N/A
Avg. Price / ft2
Past 12 months
Past 12 months
$1,339
-
-
$1,162
-
$1,203
$972
$1,003
-
$917
-
$574
$708
-
-
-
$875
$831
-
-
-
-
175 East 79th Street
$1,996,667
Avg. Price
Past 12 months
Past 12 months
$916,667
$690,000
$977,788
$1,875,000
-
$1,925,000
$900,000
$1,001,667
-
$866,667
$720,000
$1,555,833
$1,098,750
$1,196,375
-
-
$1,400,000
$763,000
-
$2,395,000
$1,750,000
-
175 East 79th Street
$2,350,000
Median Price
Past 12 months
Past 12 months
$850,000
$690,000
$977,788
$1,875,000
-
$1,925,000
$900,000
$995,000
-
$825,000
$720,000
$1,545,000
$1,098,750
$1,062,750
-
-
$1,400,000
$747,500
-
$2,395,000
$1,750,000
-
175 East 79th Street
N/A
Avg. Price / ft2
Past 12 months
Past 12 months
-
-
-
-
-
-
-
-
-
-
-
$515
-
-
-
-
-
-
-
-
-
-
175 East 79th Street
N/A
Avg. Price
Past 12 months
Past 12 months
-
-
-
-
-
-
-
-
-
-
-
$850,000
-
-
-
-
-
-
-
-
-
-
175 East 79th Street
N/A
Median Price
Past 12 months
Past 12 months
-
-
-
-
-
-
-
-
-
-
-
$850,000
-
-
-
-
-
-
-
-
-
-
175 East 79th Street
N/A
Avg. Price / ft2
Past 12 months
Past 12 months
$1,339
-
-
-
-
-
$972
$1,003
-
$917
-
$633
$708
-
-
-
-
$831
-
-
-
-
175 East 79th Street
$965,000
Avg. Price
Past 12 months
Past 12 months
$916,667
$690,000
$977,788
-
-
-
$900,000
$1,001,667
-
$866,667
$720,000
$1,008,750
$637,500
$895,167
-
-
-
$763,000
-
$2,395,000
-
-
175 East 79th Street
$965,000
Median Price
Past 12 months
Past 12 months
$850,000
$690,000
$977,788
-
-
-
$900,000
$995,000
-
$825,000
$720,000
$670,000
$637,500
$630,500
-
-
-
$747,500
-
$2,395,000
-
-
175 East 79th Street
N/A
Avg. Price / ft2
Past 12 months
Past 12 months
-
-
-
$1,162
-
$1,203
-
-
-
-
-
-
-
-
-
-
$875
-
-
-
-
-
175 East 79th Street
$2,512,500
Avg. Price
Past 12 months
Past 12 months
-
-
-
$1,875,000
-
$1,925,000
-
-
-
-
-
$1,994,167
$1,560,000
$2,100,000
-
-
$1,400,000
-
-
-
$1,750,000
-
175 East 79th Street
$2,512,500
Median Price
Past 12 months
Past 12 months
-
-
-
$1,875,000
-
$1,925,000
-
-
-
-
-
$2,200,000
$1,560,000
$2,100,000
-
-
$1,400,000
-
-
-
$1,750,000
-
175 East 79th Street
N/A
Avg. Price / ft2
Past 12 months
Past 12 months
-
-
-
-
-
-
-
-
-
-
-
-
-
-
-
-
-
-
-
-
-
-
175 East 79th Street
N/A
Avg. Price
Past 12 months
Past 12 months
-
-
-
-
-
-
-
-
-
-
-
$3,135,000
-
-
-
-
-
-
-
-
-
-
175 East 79th Street
N/A
Median Price
Past 12 months
Past 12 months
-
-
-
-
-
-
-
-
-
-
-
$3,135,000
-
-
-
-
-
-
-
-
-
-
175 East 79th Street
N/A
Avg. Price / ft2
Past 12 months
Past 12 months
-
-
-
-
-
-
-
-
-
-
-
-
-
-
-
-
-
-
-
-
-
-
175 East 79th Street
N/A
Avg. Price
Past 12 months
Past 12 months
-
-
-
-
-
-
-
-
-
-
-
-
-
-
-
-
-
-
-
-
-
-
175 East 79th Street
N/A
Median Price
Past 12 months
Past 12 months
-
-
-
-
-
-
-
-
-
-
-
-
-
-
-
-
-
-
-
-
-
-
175 East 79th Street
N/A
Avg. Price / ft2
Past 12 months
Past 12 months
-
-
-
-
-
-
-
-
-
-
-
-
-
-
-
-
-
-
-
-
-
-
175 East 79th Street
N/A
Avg. Price
Past 12 months
Past 12 months
-
-
-
-
-
-
-
-
-
-
-
-
-
-
-
-
-
-
-
-
-
-
175 East 79th Street
N/A
Median Price
Past 12 months
Past 12 months
-
-
-
-
-
-
-
-
-
-
-
-
-
-
-
-
-
-
-
-
-
-
225 East 79th Street
N/A
Avg. Price / ft2
Past 12 months
Past 12 months
$904
$666
-
$942
-
$800
-
$964
$863
$636
$757
$641
$500
-
$709
$670
$658
$724
$771
-
$673
$593
225 East 79th Street
$520,357
Avg. Price
Past 12 months
Past 12 months
$543,333
$554,375
$370,000
$713,750
$305,550
$560,000
$575,000
$1,220,045
$599,500
$417,500
$531,333
$557,333
$325,000
$725,000
$645,333
$630,000
$325,167
$879,780
$577,857
$302,500
$343,875
$373,833
225 East 79th Street
$440,000
Median Price
Past 12 months
Past 12 months
$375,000
$481,250
$370,000
$512,500
$305,550
$560,000
$575,000
$1,395,000
$670,000
$405,500
$379,500
$412,500
$225,000
$725,000
$282,000
$455,000
$329,000
$499,900
$495,000
$245,000
$346,500
$331,000
225 East 79th Street
N/A
Avg. Price / ft2
Past 12 months
Past 12 months
$922
-
-
$783
-
-
-
$700
-
$578
$549
-
$500
-
$627
-
$658
$584
-
-
-
-
225 East 79th Street
$354,375
Avg. Price
Past 12 months
Past 12 months
$350,625
$325,000
$270,000
$352,500
$305,550
-
-
$315,000
$327,500
$292,500
$279,333
$262,000
$225,000
$275,000
$255,500
-
$325,167
$292,000
$290,000
$212,500
-
$189,333
225 East 79th Street
$330,000
Median Price
Past 12 months
Past 12 months
$332,500
$325,000
$270,000
$352,500
$305,550
-
-
$315,000
$327,500
$292,500
$280,000
$262,000
$225,000
$275,000
$255,500
-
$329,000
$292,000
$290,000
$212,500
-
$146,000
225 East 79th Street
N/A
Avg. Price / ft2
Past 12 months
Past 12 months
$886
$666
-
$838
-
$800
-
-
$863
$694
$747
$641
-
-
-
$562
-
-
$751
-
$673
$593
225 East 79th Street
$575,000
Avg. Price
Past 12 months
Past 12 months
$620,000
$481,250
$470,000
$650,000
-
$560,000
$575,000
-
$670,000
$542,500
$525,000
$456,667
-
-
-
$447,500
-
-
$544,000
$450,000
$487,500
$415,000
225 East 79th Street
$575,000
Median Price
Past 12 months
Past 12 months
$620,000
$481,250
$470,000
$650,000
-
$560,000
$575,000
-
$670,000
$542,500
$525,000
$415,000
-
-
-
$447,500
-
-
$562,000
$450,000
$487,500
$415,000
225 East 79th Street
N/A
Avg. Price / ft2
Past 12 months
Past 12 months
-
-
-
$1,364
-
-
-
$1,227
-
-
$1,182
-
-
-
-
$884
-
$1,004
-
-
-
-
225 East 79th Street
$1,075,000
Avg. Price
Past 12 months
Past 12 months
$1,237,500
$930,000
-
$1,500,000
-
-
-
$1,418,409
$801,000
-
$1,300,000
-
$525,000
$1,175,000
-
$995,000
-
$1,580,000
-
-
-
$880,000
225 East 79th Street
$1,075,000
Median Price
Past 12 months
Past 12 months
$1,237,500
$930,000
-
$1,500,000
-
-
-
$1,395,000
$801,000
-
$1,300,000
-
$525,000
$1,175,000
-
$995,000
-
$1,580,000
-
-
-
$880,000
225 East 79th Street
N/A
Avg. Price / ft2
Past 12 months
Past 12 months
-
-
-
-
-
-
-
-
-
-
-
-
-
-
$792
-
-
-
$831
-
-
-
225 East 79th Street
N/A
Avg. Price
Past 12 months
Past 12 months
-
-
-
-
-
-
-
$1,530,000
-
-
-
$1,450,000
-
-
$1,425,000
-
-
$1,735,000
$1,495,000
-
-
-
225 East 79th Street
N/A
Median Price
Past 12 months
Past 12 months
-
-
-
-
-
-
-
$1,530,000
-
-
-
$1,450,000
-
-
$1,425,000
-
-
$1,735,000
$1,495,000
-
-
-
225 East 79th Street
N/A
Avg. Price / ft2
Past 12 months
Past 12 months
-
-
-
-
-
-
-
-
-
-
-
-
-
-
-
-
-
-
-
-
-
-
225 East 79th Street
N/A
Avg. Price
Past 12 months
Past 12 months
-
-
-
-
-
-
-
-
-
-
-
-
-
-
-
-
-
-
-
-
-
-
225 East 79th Street
N/A
Median Price
Past 12 months
Past 12 months
-
-
-
-
-
-
-
-
-
-
-
-
-
-
-
-
-
-
-
-
-
-
225 East 79th Street
N/A
Avg. Price / ft2
Past 12 months
Past 12 months
-
-
-
-
-
-
-
-
-
-
-
-
-
-
-
-
-
-
-
-
-
-
225 East 79th Street
N/A
Avg. Price
Past 12 months
Past 12 months
-
-
-
-
-
-
-
-
-
-
-
-
-
-
-
-
-
-
-
-
-
-
225 East 79th Street
N/A
Median Price
Past 12 months
Past 12 months
-
-
-
-
-
-
-
-
-
-
-
-
-
-
-
-
-
-
-
-
-
-
Belmont 79
N/A
Avg. Price / ft2
Past 12 months
Past 12 months
$931
$733
$727
$741
$635
$741
-
$885
$891
$960
$1,032
$745
$527
$642
$550
$659
$697
$720
$655
$654
$620
-
Belmont 79
$297,500
Avg. Price
Past 12 months
Past 12 months
$500,000
$639,000
$400,000
$500,000
$540,000
$488,333
-
$457,500
$706,000
$803,833
$911,334
$710,840
$366,600
$397,500
$335,000
$425,000
$731,250
$473,000
$360,000
$365,500
$474,167
-
Belmont 79
$297,500
Median Price
Past 12 months
Past 12 months
$500,000
$540,000
$400,000
$500,000
$540,000
$525,000
-
$440,000
$577,000
$585,000
$911,334
$575,000
$315,000
$397,500
$335,000
$425,000
$705,000
$515,000
$360,000
$313,500
$495,000
-
Belmont 79
N/A
Avg. Price / ft2
Past 12 months
Past 12 months
$931
$727
$727
-
-
$727
-
$885
-
-
-
$555
$527
$773
$582
-
-
$689
$655
$549
$676
-
Belmont 79
$265,000
Avg. Price
Past 12 months
Past 12 months
$500,000
$400,000
$400,000
-
-
$400,000
-
$457,500
$420,000
-
-
$305,000
$293,333
$425,000
$320,000
-
-
$379,000
$360,000
$304,000
$343,750
-
Belmont 79
$265,000
Median Price
Past 12 months
Past 12 months
$500,000
$400,000
$400,000
-
-
$400,000
-
$440,000
$420,000
-
-
$305,000
$290,000
$425,000
$320,000
-
-
$379,000
$360,000
$302,000
$343,750
-
Belmont 79
N/A
Avg. Price / ft2
Past 12 months
Past 12 months
-
-
-
$741
$635
$748
-
-
$891
$836
-
$728
-
$510
$519
$659
$666
$750
-
$759
-
-
Belmont 79
N/A
Avg. Price
Past 12 months
Past 12 months
-
$535,000
-
$500,000
$540,000
$532,500
-
-
$577,000
$582,000
$636,406
$543,333
$476,500
$370,000
$350,000
$425,000
$512,500
$520,000
-
$550,000
-
-
Belmont 79
N/A
Median Price
Past 12 months
Past 12 months
-
$535,000
-
$500,000
$540,000
$532,500
-
-
$577,000
$582,000
$636,406
$540,000
$476,500
$370,000
$350,000
$425,000
$512,500
$520,000
-
$550,000
-
-
Belmont 79
N/A
Avg. Price / ft2
Past 12 months
Past 12 months
-
$739
-
-
-
-
-
-
-
$1,085
$1,032
$1,062
-
-
-
-
-
-
-
-
-
-
Belmont 79
N/A
Avg. Price
Past 12 months
Past 12 months
-
$862,500
-
-
-
-
-
-
$1,250,000
$1,247,500
$1,186,261
$1,045,441
-
-
-
-
$800,000
-
-
-
-
-
Belmont 79
N/A
Median Price
Past 12 months
Past 12 months
-
$862,500
-
-
-
-
-
-
$1,250,000
$1,247,500
$1,186,261
$1,045,441
-
-
-
-
$800,000
-
-
-
-
-
Belmont 79
N/A
Avg. Price / ft2
Past 12 months
Past 12 months
-
-
-
-
-
-
-
-
-
-
-
$655
-
-
-
-
$759
-
-
-
$507
-
Belmont 79
N/A
Avg. Price
Past 12 months
Past 12 months
-
-
-
-
-
-
-
-
-
-
-
$950,000
-
-
-
-
$1,100,000
-
-
-
$735,000
-
Belmont 79
N/A
Median Price
Past 12 months
Past 12 months
-
-
-
-
-
-
-
-
-
-
-
$950,000
-
-
-
-
$1,100,000
-
-
-
$735,000
-
Belmont 79
N/A
Avg. Price / ft2
Past 12 months
Past 12 months
-
-
-
-
-
-
-
-
-
-
-
-
-
-
-
-
-
-
-
-
-
-
Belmont 79
N/A
Avg. Price
Past 12 months
Past 12 months
-
-
-
-
-
-
-
-
-
-
-
-
-
-
-
-
-
-
-
-
-
-
Belmont 79
N/A
Median Price
Past 12 months
Past 12 months
-
-
-
-
-
-
-
-
-
-
-
-
-
-
-
-
-
-
-
-
-
-
Belmont 79
N/A
Avg. Price / ft2
Past 12 months
Past 12 months
-
-
-
-
-
-
-
-
-
-
-
-
-
-
-
-
-
-
-
-
-
-
Belmont 79
N/A
Avg. Price
Past 12 months
Past 12 months
-
-
-
-
-
-
-
-
-
-
-
-
-
-
-
-
-
-
-
-
-
-
Belmont 79
N/A
Median Price
Past 12 months
Past 12 months
-
-
-
-
-
-
-
-
-
-
-
-
-
-
-
-
-
-
-
-
-
-
205 East 63rd Street
$533
Avg. Price / ft2
Past 12 months
Past 12 months
$498
$467
$495
-
$571
$715
$773
$686
$681
$695
$659
$515
$468
$587
-
$499
$650
$659
$638
$614
$487
$542
205 East 63rd Street
$802,500
Avg. Price
Past 12 months
Past 12 months
$645,857
$524,400
$571,286
-
$592,500
$1,346,250
$795,000
$847,889
$639,333
$866,365
$1,061,273
$469,875
$546,500
$804,167
$1,510,000
$372,500
$1,076,389
$754,375
$472,000
$667,669
$647,790
$487,250
205 East 63rd Street
$772,500
Median Price
Past 12 months
Past 12 months
$611,000
$560,000
$515,000
-
$592,500
$1,346,250
$780,000
$860,000
$495,000
$690,000
$999,999
$362,000
$414,500
$650,000
$1,510,000
$372,500
$640,000
$707,500
$472,000
$595,000
$687,500
$439,500
205 East 63rd Street
N/A
Avg. Price / ft2
Past 12 months
Past 12 months
$436
-
$430
-
-
-
-
-
-
-
-
$491
-
-
-
-
$621
-
$638
-
$342
-
205 East 63rd Street
$265,000
Avg. Price
Past 12 months
Past 12 months
$240,000
$192,000
$215,000
-
-
-
-
$326,000
$400,000
-
-
$278,500
-
-
-
-
$341,500
$302,500
$399,000
$330,000
$217,633
-
205 East 63rd Street
$265,000
Median Price
Past 12 months
Past 12 months
$240,000
$192,000
$215,000
-
-
-
-
$326,000
$400,000
-
-
$277,500
-
-
-
-
$341,500
$302,500
$399,000
$330,000
$199,900
-
205 East 63rd Street
N/A
Avg. Price / ft2
Past 12 months
Past 12 months
$450
-
-
-
$571
-
$691
-
$479
$742
$450
-
$440
$445
-
$499
$563
$631
-
$579
-
$542
205 East 63rd Street
N/A
Avg. Price
Past 12 months
Past 12 months
$458,667
$275,000
$475,000
-
$592,500
-
$531,667
$490,000
$512,000
$500,393
$437,167
$442,500
$380,333
$375,000
$1,510,000
$372,500
$545,833
$505,000
$545,000
$521,588
$560,000
$401,333
205 East 63rd Street
N/A
Median Price
Past 12 months
Past 12 months
$475,000
$275,000
$475,000
-
$592,500
-
$525,000
$450,000
$505,000
$425,000
$425,000
$442,500
$380,000
$375,000
$1,510,000
$372,500
$585,000
$505,000
$545,000
$495,000
$560,000
$400,000
205 East 63rd Street
N/A
Avg. Price / ft2
Past 12 months
Past 12 months
$657
-
$469
-
-
-
$815
$629
-
$559
$770
-
-
$446
-
-
-
$687
-
-
$500
-
205 East 63rd Street
$770,000
Avg. Price
Past 12 months
Past 12 months
$968,333
$560,000
$628,000
-
-
-
$1,058,333
$998,750
-
$1,088,333
$993,500
$780,000
-
$650,000
-
-
$877,000
$1,105,000
-
$812,500
$850,000
$745,000
205 East 63rd Street
$770,000
Median Price
Past 12 months
Past 12 months
$880,000
$560,000
$600,000
-
-
-
$995,000
$930,000
-
$875,000
$999,999
$780,000
-
$650,000
-
-
$877,000
$1,105,000
-
$812,500
$775,000
$745,000
205 East 63rd Street
$757
Avg. Price / ft2
Past 12 months
Past 12 months
-
$467
$613
-
-
$715
-
-
$882
$761
$966
$613
$550
$798
-
-
$970
-
-
$684
$606
-
205 East 63rd Street
$1,400,000
Avg. Price
Past 12 months
Past 12 months
-
$797,500
$1,225,000
-
-
$1,346,250
-
-
$1,500,000
$1,498,333
$1,572,500
$980,000
$1,045,000
$1,387,500
-
-
$2,163,333
-
-
$1,300,000
$932,500
-
205 East 63rd Street
$1,400,000
Median Price
Past 12 months
Past 12 months
-
$797,500
$1,225,000
-
-
$1,346,250
-
-
$1,500,000
$1,395,000
$1,572,500
$980,000
$1,045,000
$1,387,500
-
-
$1,940,000
-
-
$1,300,000
$932,500
-
205 East 63rd Street
$310
Avg. Price / ft2
Past 12 months
Past 12 months
-
-
-
-
-
-
-
$744
-
-
-
-
-
-
-
-
-
-
-
-
-
-
205 East 63rd Street
$775,000
Avg. Price
Past 12 months
Past 12 months
-
-
-
-
-
-
-
$1,840,000
-
-
$2,250,000
-
-
-
-
-
-
-
-
-
-
-
205 East 63rd Street
$775,000
Median Price
Past 12 months
Past 12 months
-
-
-
-
-
-
-
$1,840,000
-
-
$2,250,000
-
-
-
-
-
-
-
-
-
-
-
205 East 63rd Street
N/A
Avg. Price / ft2
Past 12 months
Past 12 months
-
-
-
-
-
-
-
-
-
-
-
-
-
-
-
-
-
-
-
-
-
-
205 East 63rd Street
N/A
Avg. Price
Past 12 months
Past 12 months
-
-
-
-
-
-
-
-
-
-
-
-
-
-
-
-
-
-
-
-
-
-
205 East 63rd Street
N/A
Median Price
Past 12 months
Past 12 months
-
-
-
-
-
-
-
-
-
-
-
-
-
-
-
-
-
-
-
-
-
-
Newport East
$1,085
Avg. Price / ft2
Past 12 months
Past 12 months
$994
$864
$1,094
$1,027
$966
$1,031
$1,054
$947
$1,051
$875
$865
$834
$660
$683
$633
$778
$850
$766
$717
$696
$720
$464
Newport East
$1,173,167
Avg. Price
Past 12 months
Past 12 months
$1,183,558
$850,500
$1,065,840
$912,371
$1,040,000
$842,475
$1,053,465
$983,239
$1,028,282
$786,523
$789,343
$917,915
$633,411
$615,169
$610,000
$1,096,622
$652,778
$593,449
$662,979
$645,600
$737,972
$489,223
Newport East
$1,050,000
Median Price
Past 12 months
Past 12 months
$725,000
$885,000
$890,000
$857,500
$860,000
$754,352
$790,000
$897,500
$809,509
$599,000
$485,000
$857,000
$626,250
$470,000
$610,000
$1,009,124
$650,000
$557,500
$670,931
$586,250
$787,500
$460,000
Newport East
N/A
Avg. Price / ft2
Past 12 months
Past 12 months
$676
-
-
$975
$908
$1,001
$902
-
$1,019
$775
$721
$645
$630
$647
-
-
$898
$726
$764
$700
$536
$400
Newport East
$532,000
Avg. Price
Past 12 months
Past 12 months
$442,342
$565,000
-
$507,000
$445,000
$555,200
$556,106
$515,000
$511,500
$465,000
$382,950
$354,900
$364,630
$402,246
-
-
$452,500
$426,227
$566,334
$438,667
$352,032
$331,682
Newport East
$532,000
Median Price
Past 12 months
Past 12 months
$427,025
$565,000
-
$507,000
$445,000
$505,000
$585,000
$515,000
$513,500
$480,000
$420,000
$354,900
$367,950
$400,000
-
-
$452,500
$420,000
$563,103
$385,000
$342,500
$255,803
Newport East
N/A
Avg. Price / ft2
Past 12 months
Past 12 months
-
$864
$865
$960
$971
$1,003
$1,042
$878
$1,014
$853
$1,063
$766
$699
$631
$728
-
$780
$894
$703
-
-
$485
Newport East
$840,000
Avg. Price
Past 12 months
Past 12 months
$560,000
$812,500
$782,500
$746,725
$767,500
$815,926
$808,504
$712,803
$789,565
$644,246
$542,500
$604,652
$527,300
$492,228
$655,000
$559,000
$651,667
$645,000
$571,227
$570,833
$327,000
$456,000
Newport East
$840,000
Median Price
Past 12 months
Past 12 months
$560,000
$885,000
$782,500
$773,888
$767,500
$792,500
$790,000
$650,000
$809,509
$599,000
$455,000
$610,202
$600,000
$485,000
$655,000
$559,000
$652,500
$617,500
$599,000
$572,500
$327,000
$475,000
Newport East
N/A
Avg. Price / ft2
Past 12 months
Past 12 months
$939
-
$1,481
$1,188
$1,014
$1,108
$1,302
$1,060
$1,276
$1,012
$577
$1,099
$639
$800
$538
$835
$1,010
$719
$711
$692
$697
-
Newport East
$1,292,500
Avg. Price
Past 12 months
Past 12 months
$1,166,667
$1,250,000
$1,555,000
$1,446,350
$1,420,000
$1,356,667
$1,620,000
$1,100,181
$1,363,333
$1,345,173
$1,033,529
$1,080,750
$845,758
$1,014,375
$565,000
$981,618
$1,060,000
$870,975
$827,419
$969,000
$828,067
$653,702
Newport East
$1,292,500
Median Price
Past 12 months
Past 12 months
$1,325,000
$1,250,000
$1,555,000
$1,542,500
$1,420,000
$1,300,000
$1,620,000
$1,103,500
$1,340,000
$1,280,000
$1,195,000
$1,087,000
$861,800
$1,102,500
$565,000
$937,500
$1,060,000
$907,500
$848,000
$969,000
$850,000
$690,000
Newport East
N/A
Avg. Price / ft2
Past 12 months
Past 12 months
-
-
$1,164
-
-
-
-
-
-
-
$1,389
$1,029
-
-
-
$687
-
-
-
-
-
-
Newport East
N/A
Avg. Price
Past 12 months
Past 12 months
-
-
$1,629,200
-
$1,800,000
-
$1,749,667
$1,930,000
-
-
$2,263,333
$1,515,000
$965,000
$1,180,000
-
$1,153,041
-
-
-
$999,500
$874,500
-
Newport East
N/A
Median Price
Past 12 months
Past 12 months
-
-
$1,629,200
-
$1,800,000
-
$1,750,000
$1,930,000
-
-
$2,263,333
$1,565,000
$965,000
$1,180,000
-
$1,150,000
-
-
-
$999,500
$874,500
-
Newport East
N/A
Avg. Price / ft2
Past 12 months
Past 12 months
$1,208
-
-
-
-
-
-
-
$1,000
-
-
-
-
-
-
$939
-
-
-
-
$927
-
Newport East
N/A
Avg. Price
Past 12 months
Past 12 months
$2,632,500
-
-
-
-
-
-
-
$4,000,000
-
-
-
-
-
-
$1,925,000
-
-
-
-
$1,900,000
-
Newport East
N/A
Median Price
Past 12 months
Past 12 months
$2,632,500
-
-
-
-
-
-
-
$4,000,000
-
-
-
-
-
-
$1,925,000
-
-
-
-
$1,900,000
-
Newport East
$1,085
Avg. Price / ft2
Past 12 months
Past 12 months
-
-
-
-
-
-
-
-
-
-
-
-
-
-
-
-
-
-
-
-
-
-
Newport East
$2,550,000
Avg. Price
Past 12 months
Past 12 months
-
-
-
-
-
-
-
-
-
-
-
-
-
-
-
-
-
-
-
-
-
-
Newport East
$2,550,000
Median Price
Past 12 months
Past 12 months
-
-
-
-
-
-
-
-
-
-
-
-
-
-
-
-
-
-
-
-
-
-
205 East 78th Street
$1,055
Avg. Price / ft2
Past 12 months
Past 12 months
$929
$881
$1,081
$875
$873
$909
$1,124
$847
$1,010
$811
$824
$900
$652
$797
$717
$655
$887
$892
$728
$674
$598
$505
205 East 78th Street
$881,818
Avg. Price
Past 12 months
Past 12 months
$731,406
$771,429
$847,143
$976,116
$704,831
$521,417
$952,500
$723,273
$709,643
$767,071
$655,342
$796,395
$529,000
$696,000
$740,100
$615,286
$686,167
$708,521
$663,500
$680,618
$511,277
$337,700
205 East 78th Street
$820,000
Median Price
Past 12 months
Past 12 months
$556,874
$695,000
$700,000
$775,000
$663,500
$395,000
$790,000
$612,000
$727,000
$615,500
$615,000
$595,000
$500,000
$639,000
$637,500
$480,000
$659,000
$607,000
$607,500
$600,000
$494,500
$307,500
205 East 78th Street
$894
Avg. Price / ft2
Past 12 months
Past 12 months
-
-
-
$770
$900
$864
-
-
$998
-
$825
$780
$600
-
$763
$620
-
$700
-
$660
-
$394
205 East 78th Street
$371,667
Avg. Price
Past 12 months
Past 12 months
$386,667
$405,000
$355,000
$385,000
$360,000
$382,500
$420,000
$390,000
$381,333
$395,000
$335,438
$330,833
$300,000
-
$305,000
$305,000
$545,500
$516,278
$713,571
$659,857
$445,179
$208,500
205 East 78th Street
$395,000
Median Price
Past 12 months
Past 12 months
$380,000
$405,000
$355,000
$385,000
$360,000
$382,500
$420,000
$390,000
$375,000
$365,000
$356,250
$307,500
$300,000
-
$305,000
$305,000
$545,500
$480,000
$640,000
$600,000
$442,500
$208,500
205 East 78th Street
$983
Avg. Price / ft2
Past 12 months
Past 12 months
$775
$831
$939
$707
$844
$999
$854
$847
$835
$811
$720
$659
$591
$704
$675
$519
$886
$870
$728
$640
$565
$532
205 East 78th Street
$888,000
Avg. Price
Past 12 months
Past 12 months
$604,583
$597,500
$753,000
$508,750
$616,442
$799,250
$781,667
$651,889
$695,111
$608,429
$585,150
$578,900
$511,429
$547,200
$541,800
$475,667
$626,636
$709,571
$524,000
$510,500
$448,308
$358,333
205 East 78th Street
$820,000
Median Price
Past 12 months
Past 12 months
$675,000
$612,500
$700,000
$497,500
$663,500
$799,250
$770,000
$612,000
$755,000
$701,000
$622,500
$587,500
$505,000
$575,000
$489,000
$480,000
$649,000
$725,000
$504,500
$527,500
$490,000
$325,000
205 East 78th Street
$1,321
Avg. Price / ft2
Past 12 months
Past 12 months
$1,160
$1,084
$1,508
$990
$988
-
$1,529
-
$1,191
-
$1,133
$974
$888
$891
$778
$825
$899
$900
-
$720
$713
-
205 East 78th Street
$1,381,667
Avg. Price
Past 12 months
Past 12 months
$1,438,750
$1,302,500
$1,810,000
$1,258,350
$1,580,000
-
$1,642,500
$1,699,000
$1,267,500
$1,500,000
$1,070,750
$1,231,250
$1,110,000
$1,078,750
$1,096,750
$1,320,000
$839,500
$1,125,000
$1,150,000
$846,037
$855,000
-
205 East 78th Street
$1,430,000
Median Price
Past 12 months
Past 12 months
$1,438,750
$1,302,500
$1,810,000
$1,400,000
$1,580,000
-
$1,792,500
$1,699,000
$1,267,500
$1,500,000
$1,237,500
$1,200,000
$1,110,000
$900,000
$1,024,500
$1,320,000
$839,500
$1,125,000
$1,150,000
$843,112
$855,000
-
205 East 78th Street
N/A
Avg. Price / ft2
Past 12 months
Past 12 months
-
-
-
$1,191
-
-
-
-
-
-
-
$1,279
-
-
-
-
-
$1,185
-
-
$585
-
205 East 78th Street
N/A
Avg. Price
Past 12 months
Past 12 months
-
-
-
$2,025,525
-
-
-
-
-
-
-
$1,712,500
-
-
-
-
-
$2,014,875
-
-
$1,022,500
-
205 East 78th Street
N/A
Median Price
Past 12 months
Past 12 months
-
-
-
$2,025,525
-
-
-
-
-
-
-
$1,712,500
-
-
-
-
-
$2,014,875
-
-
$1,022,500
-
205 East 78th Street
N/A
Avg. Price / ft2
Past 12 months
Past 12 months
-
-
-
-
-
-
-
-
-
-
-
-
-
-
-
-
-
-
-
-
-
-
205 East 78th Street
N/A
Avg. Price
Past 12 months
Past 12 months
-
-
-
-
-
-
-
-
-
-
-
-
-
-
-
-
-
-
-
-
-
-
205 East 78th Street
N/A
Median Price
Past 12 months
Past 12 months
-
-
-
-
-
-
-
-
-
-
-
-
-
-
-
-
-
-
-
-
-
-
205 East 78th Street
N/A
Avg. Price / ft2
Past 12 months
Past 12 months
-
-
-
-
-
-
-
-
-
-
-
-
-
-
-
-
-
-
-
-
-
-
205 East 78th Street
N/A
Avg. Price
Past 12 months
Past 12 months
-
-
-
-
-
-
-
-
-
-
-
-
-
-
-
-
-
-
-
-
-
-
205 East 78th Street
N/A
Median Price
Past 12 months
Past 12 months
-
-
-
-
-
-
-
-
-
-
-
-
-
-
-
-
-
-
-
-
-
-
The Kimberly
$993
Avg. Price / ft2
Past 12 months
Past 12 months
-
$991
$978
$938
$858
$823
$1,061
$929
$917
$831
$855
$744
$626
$594
$750
$671
$768
$696
-
$644
$560
$491
The Kimberly
$821,250
Avg. Price
Past 12 months
Past 12 months
$725,000
$1,038,006
$888,333
$716,000
$750,000
$830,000
$1,571,667
$684,000
$1,007,400
$731,667
$552,500
$695,656
$486,000
$580,000
$450,000
$654,333
$579,750
$668,500
$470,000
$554,000
$501,700
$452,500
The Kimberly
$821,250
Median Price
Past 12 months
Past 12 months
$725,000
$1,125,000
$790,000
$625,000
$725,000
$920,000
$1,725,000
$500,000
$835,000
$530,000
$552,500
$535,000
$490,000
$580,000
$450,000
$540,000
$512,500
$653,500
$470,000
$565,000
$411,000
$452,500
The Kimberly
N/A
Avg. Price / ft2
Past 12 months
Past 12 months
-
-
-
-
-
-
-
-
-
-
-
-
-
-
$750
-
-
-
-
-
-
-
The Kimberly
N/A
Avg. Price
Past 12 months
Past 12 months
-
-
-
-
-
-
-
$500,000
-
$430,000
-
$469,950
-
-
$450,000
-
-
-
$365,000
-
-
-
The Kimberly
N/A
Median Price
Past 12 months
Past 12 months
-
-
-
-
-
-
-
$500,000
-
$430,000
-
$469,950
-
-
$450,000
-
-
-
$365,000
-
-
-
The Kimberly
N/A
Avg. Price / ft2
Past 12 months
Past 12 months
-
-
$921
$938
$853
$773
-
$895
$943
-
$855
$600
$626
$594
-
$704
$735
$660
-
$630
$560
-
The Kimberly
$500,000
Avg. Price
Past 12 months
Past 12 months
$725,000
$700,000
$732,500
$716,000
$650,000
$580,000
-
$492,000
$767,333
-
$552,500
$468,333
$486,000
$580,000
-
$482,500
$488,500
$563,000
$575,000
$465,800
$465,875
$365,000
The Kimberly
$500,000
Median Price
Past 12 months
Past 12 months
$725,000
$700,000
$732,500
$625,000
$650,000
$580,000
-
$492,000
$768,000
-
$552,500
$455,000
$490,000
$580,000
-
$482,500
$510,000
$585,000
$575,000
$430,000
$394,250
$365,000
The Kimberly
$993
Avg. Price / ft2
Past 12 months
Past 12 months
-
$991
$1,091
-
$864
$872
-
$964
$865
$831
-
$815
-
-
-
-
$901
$767
-
$672
-
$491
The Kimberly
$1,142,500
Avg. Price
Past 12 months
Past 12 months
-
$1,207,009
$1,200,000
-
$950,000
$955,000
$1,240,000
$1,060,000
$995,000
$882,500
-
$855,333
-
-
-
-
$1,036,000
$879,500
-
$774,500
$645,000
$540,000
The Kimberly
$1,142,500
Median Price
Past 12 months
Past 12 months
-
$1,207,009
$1,200,000
-
$950,000
$955,000
$1,240,000
$1,060,000
$995,000
$882,500
-
$856,000
-
-
-
-
$1,036,000
$879,500
-
$774,500
$645,000
$540,000
The Kimberly
N/A
Avg. Price / ft2
Past 12 months
Past 12 months
-
-
-
-
-
-
$1,061
-
-
-
-
$818
-
-
-
$605
-
-
-
-
-
-
The Kimberly
N/A
Avg. Price
Past 12 months
Past 12 months
-
-
-
-
-
-
$1,737,500
-
$1,740,000
-
-
$1,350,000
-
-
-
$998,000
-
-
-
-
-
-
The Kimberly
N/A
Median Price
Past 12 months
Past 12 months
-
-
-
-
-
-
$1,737,500
-
$1,740,000
-
-
$1,350,000
-
-
-
$998,000
-
-
-
-
-
-
The Kimberly
N/A
Avg. Price / ft2
Past 12 months
Past 12 months
-
-
-
-
-
-
-
-
-
-
-
-
-
-
-
-
-
-
-
-
-
-
The Kimberly
N/A
Avg. Price
Past 12 months
Past 12 months
-
-
-
-
-
-
-
-
-
-
-
-
-
-
-
-
-
-
-
-
-
-
The Kimberly
N/A
Median Price
Past 12 months
Past 12 months
-
-
-
-
-
-
-
-
-
-
-
-
-
-
-
-
-
-
-
-
-
-
The Kimberly
N/A
Avg. Price / ft2
Past 12 months
Past 12 months
-
-
-
-
-
-
-
-
-
-
-
-
-
-
-
-
-
-
-
-
-
-
The Kimberly
N/A
Avg. Price
Past 12 months
Past 12 months
-
-
-
-
-
-
-
-
-
-
-
-
-
-
-
-
-
-
-
-
-
-
The Kimberly
N/A
Median Price
Past 12 months
Past 12 months
-
-
-
-
-
-
-
-
-
-
-
-
-
-
-
-
-
-
-
-
-
-
The Queen Anne
$981
Avg. Price / ft2
Past 12 months
Past 12 months
-
$1,149
$1,693
$715
$701
$1,100
-
-
-
$1,278
-
$1,039
$815
-
$844
-
-
$1,089
-
$713
-
$538
The Queen Anne
$665,000
Avg. Price
Past 12 months
Past 12 months
$1,440,000
$1,683,333
$2,811,667
$707,500
$467,500
$1,045,000
-
$2,045,000
$2,147,500
$1,417,321
$1,553,300
$1,057,945
$893,750
$580,000
$1,155,833
$1,070,282
$1,482,500
$1,084,315
-
$999,500
$977,214
$755,833
The Queen Anne
$665,000
Median Price
Past 12 months
Past 12 months
$1,440,000
$1,500,000
$2,708,000
$707,500
$467,500
$1,045,000
-
$2,045,000
$2,095,000
$1,145,000
$1,426,500
$1,057,945
$857,500
$580,000
$750,000
$1,153,065
$1,482,500
$1,037,500
-
$999,500
$825,000
$614,500
The Queen Anne
N/A
Avg. Price / ft2
Past 12 months
Past 12 months
-
-
-
-
-
-
-
-
-
-
-
-
-
-
-
-
-
-
-
-
-
-
The Queen Anne
N/A
Avg. Price
Past 12 months
Past 12 months
-
-
-
-
-
-
-
-
-
-
-
-
-
-
-
-
-
-
-
-
-
-
The Queen Anne
N/A
Median Price
Past 12 months
Past 12 months
-
-
-
-
-
-
-
-
-
-
-
-
-
-
-
-
-
-
-
-
-
-
The Queen Anne
$981
Avg. Price / ft2
Past 12 months
Past 12 months
-
-
-
$715
$701
$1,100
-
-
-
$1,205
-
-
-
-
$666
-
-
-
-
$713
-
-
The Queen Anne
$665,000
Avg. Price
Past 12 months
Past 12 months
-
-
-
$707,500
$467,500
$1,045,000
-
-
-
$794,688
-
$765,000
$525,000
$580,000
$683,750
-
$865,000
$677,500
-
$699,000
$485,000
$465,000
The Queen Anne
$665,000
Median Price
Past 12 months
Past 12 months
-
-
-
$707,500
$467,500
$1,045,000
-
-
-
$740,375
-
$765,000
$525,000
$580,000
$683,750
-
$865,000
$677,500
-
$699,000
$485,000
$465,000
The Queen Anne
N/A
Avg. Price / ft2
Past 12 months
Past 12 months
-
$964
-
-
-
-
-
-
-
-
-
$1,039
$815
-
-
-
-
$1,078
-
-
-
$538
The Queen Anne
N/A
Avg. Price
Past 12 months
Past 12 months
$1,440,000
$1,425,000
-
-
-
-
-
$1,540,000
$1,687,500
$1,380,000
$1,366,625
$1,350,889
$1,262,500
-
-
$1,370,000
$2,100,000
$1,075,296
-
$1,300,000
$1,052,500
$699,000
The Queen Anne
N/A
Median Price
Past 12 months
Past 12 months
$1,440,000
$1,425,000
-
-
-
-
-
$1,540,000
$1,687,500
$1,380,000
$1,358,250
$1,350,889
$1,262,500
-
-
$1,370,000
$2,100,000
$1,325,000
-
$1,300,000
$1,052,500
$699,000
The Queen Anne
N/A
Avg. Price / ft2
Past 12 months
Past 12 months
-
$1,333
$1,693
-
-
-
-
-
-
$1,350
-
-
-
-
$1,200
-
-
$1,100
-
-
-
-
The Queen Anne
N/A
Avg. Price
Past 12 months
Past 12 months
-
$2,200,000
$2,708,000
-
-
-
-
$2,550,000
$2,290,000
$2,362,500
$2,300,000
-
-
-
$2,100,000
-
-
$1,925,000
-
-
-
$1,725,000
The Queen Anne
N/A
Median Price
Past 12 months
Past 12 months
-
$2,200,000
$2,708,000
-
-
-
-
$2,550,000
$2,290,000
$2,362,500
$2,300,000
-
-
-
$2,100,000
-
-
$1,925,000
-
-
-
$1,725,000
The Queen Anne
N/A
Avg. Price / ft2
Past 12 months
Past 12 months
-
-
-
-
-
-
-
-
-
-
-
-
-
-
-
-
-
-
-
-
-
-
The Queen Anne
N/A
Avg. Price
Past 12 months
Past 12 months
-
-
$3,105,000
-
-
-
-
-
$2,925,000
$3,000,000
-
-
-
-
-
-
-
-
-
-
-
-
The Queen Anne
N/A
Median Price
Past 12 months
Past 12 months
-
-
$3,105,000
-
-
-
-
-
$2,925,000
$3,000,000
-
-
-
-
-
-
-
-
-
-
-
-
The Queen Anne
N/A
Avg. Price / ft2
Past 12 months
Past 12 months
-
-
-
-
-
-
-
-
-
-
-
-
-
-
-
-
-
-
-
-
-
-
The Queen Anne
N/A
Avg. Price
Past 12 months
Past 12 months
-
-
-
-
-
-
-
-
-
-
-
-
-
-
-
-
-
-
-
-
-
-
The Queen Anne
N/A
Median Price
Past 12 months
Past 12 months
-
-
-
-
-
-
-
-
-
-
-
-
-
-
-
-
-
-
-
-
-
-
179 East 79th Street
$969
Avg. Price / ft2
Past 12 months
Past 12 months
$1,159
-
$922
$819
-
$612
$981
$2,250
$1,024
$833
$760
$734
$1,017
$690
$726
$886
$813
$769
$969
$721
$656
$406
179 East 79th Street
$701,667
Avg. Price
Past 12 months
Past 12 months
$2,550,000
$654,000
$830,000
$825,625
-
$690,000
$759,720
$2,408,125
$948,667
$1,024,833
$951,143
$749,928
$1,875,000
$764,383
$581,000
$1,139,058
$728,333
$678,071
$1,021,000
$717,196
$569,714
$543,333
179 East 79th Street
$715,000
Median Price
Past 12 months
Past 12 months
$2,550,000
$654,000
$830,000
$682,500
-
$690,000
$725,000
$1,187,500
$736,000
$709,500
$726,500
$675,000
$1,875,000
$658,000
$620,000
$842,175
$725,000
$690,000
$1,195,000
$619,088
$545,000
$445,000
179 East 79th Street
N/A
Avg. Price / ft2
Past 12 months
Past 12 months
-
-
-
-
-
-
-
-
-
-
-
-
-
-
-
-
-
-
-
-
-
-
179 East 79th Street
N/A
Avg. Price
Past 12 months
Past 12 months
-
-
-
-
-
-
-
-
-
-
-
-
-
-
-
-
-
-
-
-
-
-
179 East 79th Street
N/A
Median Price
Past 12 months
Past 12 months
-
-
-
-
-
-
-
-
-
-
-
-
-
-
-
-
-
-
-
-
-
-
179 East 79th Street
$969
Avg. Price / ft2
Past 12 months
Past 12 months
-
-
$922
$819
-
$612
$981
-
$903
$833
$655
$734
-
$690
$726
-
$813
$769
-
$721
$656
$406
179 East 79th Street
$701,667
Avg. Price
Past 12 months
Past 12 months
-
$654,000
$830,000
$655,000
-
$690,000
$759,720
$628,750
$691,750
$674,750
$601,250
$633,333
$700,000
$571,575
$581,000
$625,000
$728,333
$678,071
$727,500
$586,544
$547,800
$385,000
179 East 79th Street
$715,000
Median Price
Past 12 months
Past 12 months
-
$654,000
$830,000
$650,000
-
$690,000
$725,000
$628,750
$688,500
$674,750
$601,250
$625,000
$700,000
$571,575
$620,000
$625,000
$725,000
$690,000
$727,500
$577,000
$545,000
$385,000
179 East 79th Street
N/A
Avg. Price / ft2
Past 12 months
Past 12 months
-
-
-
-
-
-
-
-
$1,146
-
$813
-
-
-
-
-
-
-
$969
-
-
-
179 East 79th Street
N/A
Avg. Price
Past 12 months
Past 12 months
-
-
-
$1,337,500
-
-
-
$1,625,000
$1,462,500
-
$1,182,250
$1,099,710
-
$1,150,000
-
$842,175
-
-
$1,216,667
$978,500
$624,500
$860,000
179 East 79th Street
N/A
Median Price
Past 12 months
Past 12 months
-
-
-
$1,337,500
-
-
-
$1,625,000
$1,462,500
-
$1,337,500
$1,099,710
-
$1,150,000
-
$842,175
-
-
$1,195,000
$978,500
$624,500
$860,000
179 East 79th Street
N/A
Avg. Price / ft2
Past 12 months
Past 12 months
-
-
-
-
-
-
-
$2,250
-
-
-
-
$1,017
-
-
-
-
-
-
-
-
-
179 East 79th Street
N/A
Avg. Price
Past 12 months
Past 12 months
-
-
-
-
-
-
-
$6,750,000
-
$1,725,000
-
-
$3,050,000
-
-
-
-
-
-
-
-
-
179 East 79th Street
N/A
Median Price
Past 12 months
Past 12 months
-
-
-
-
-
-
-
$6,750,000
-
$1,725,000
-
-
$3,050,000
-
-
-
-
-
-
-
-
-
179 East 79th Street
N/A
Avg. Price / ft2
Past 12 months
Past 12 months
$1,159
-
-
-
-
-
-
-
-
-
-
-
-
-
-
$886
-
-
-
-
-
-
179 East 79th Street
N/A
Avg. Price
Past 12 months
Past 12 months
$2,550,000
-
-
-
-
-
-
-
-
-
-
-
-
-
-
$1,950,000
-
-
-
-
-
-
179 East 79th Street
N/A
Median Price
Past 12 months
Past 12 months
$2,550,000
-
-
-
-
-
-
-
-
-
-
-
-
-
-
$1,950,000
-
-
-
-
-
-
179 East 79th Street
N/A
Avg. Price / ft2
Past 12 months
Past 12 months
-
-
-
-
-
-
-
-
-
-
-
-
-
-
-
-
-
-
-
-
-
-
179 East 79th Street
N/A
Avg. Price
Past 12 months
Past 12 months
-
-
-
-
-
-
-
-
-
-
-
-
-
-
-
-
-
-
-
-
-
-
179 East 79th Street
N/A
Median Price
Past 12 months
Past 12 months
-
-
-
-
-
-
-
-
-
-
-
-
-
-
-
-
-
-
-
-
-
-


