The Gallery, 112 West 72nd Street: Price Comparison
between Columbus Avenue & Amsterdam Avenue Building Profile
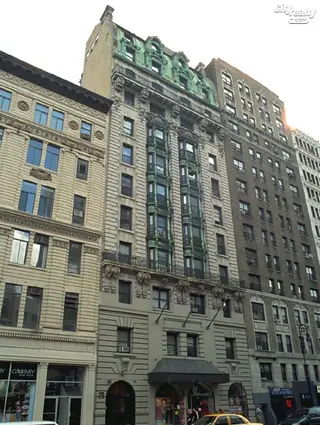
The Gallery
$1,533
Avg. Price / ft2
Past 12 months
Past 12 months
2024
-
2023
-
2022
-
2021
$1,392
2020
-
2019
-
2018
$1,489
2017
$1,336
2016
$1,483
2015
$1,467
2014
$1,415
2013
$1,456
2012
$1,081
2011
$944
2010
$1,065
2009
$960
2008
$1,389
2007
-
2006
$1,234
2005
$1,124
2004
$818
2003
$621
The Gallery
$989,298
Avg. Price
Past 12 months
Past 12 months
2024
-
2023
-
2022
-
2021
$536,520
2020
-
2019
-
2018
$818,667
2017
$1,026,839
2016
$890,000
2015
$502,250
2014
$952,000
2013
$863,750
2012
$495,770
2011
$540,776
2010
$589,427
2009
$513,677
2008
$816,000
2007
-
2006
$549,000
2005
$729,975
2004
$581,285
2003
$435,000
The Gallery
$1,562
Median Price / ft2
Past 12 months
Past 12 months
2024
-
2023
-
2022
-
2021
$1,409
2020
-
2019
-
2018
$1,489
2017
$1,357
2016
$1,483
2015
$1,467
2014
$1,335
2013
$1,335
2012
$1,024
2011
$926
2010
$960
2009
$973
2008
$1,346
2007
-
2006
$1,234
2005
$1,167
2004
$786
2003
$621
The Gallery
$999,900
Median Price
Past 12 months
Past 12 months
2024
-
2023
-
2022
-
2021
$559,274
2020
-
2019
-
2018
$730,000
2017
$921,516
2016
$890,000
2015
$502,250
2014
$895,000
2013
$787,500
2012
$440,000
2011
$552,000
2010
$485,000
2009
$499,000
2008
$749,000
2007
-
2006
$549,000
2005
$816,000
2004
$549,855
2003
$435,000
The Gallery
N/A
Avg. Price / ft2
Past 12 months
Past 12 months
2024
-
2023
-
2022
-
2021
-
2020
-
2019
-
2018
-
2017
-
2016
-
2015
$1,467
2014
$1,335
2013
$1,244
2012
$1,231
2011
$990
2010
$949
2009
$973
2008
$1,346
2007
-
2006
$1,234
2005
$872
2004
-
2003
-
The Gallery
N/A
Avg. Price
Past 12 months
Past 12 months
2024
-
2023
-
2022
-
2021
$400,530
2020
-
2019
-
2018
-
2017
-
2016
-
2015
$502,250
2014
$550,000
2013
$535,000
2012
$332,310
2011
$425,880
2010
$422,100
2009
$292,030
2008
$599,000
2007
-
2006
$549,000
2005
$388,000
2004
-
2003
-
The Gallery
N/A
Median Price / ft2
Past 12 months
Past 12 months
2024
-
2023
-
2022
-
2021
-
2020
-
2019
-
2018
-
2017
-
2016
-
2015
$1,467
2014
$1,335
2013
$1,244
2012
$1,231
2011
$990
2010
$949
2009
$973
2008
$1,346
2007
-
2006
$1,234
2005
$872
2004
-
2003
-
The Gallery
N/A
Median Price
Past 12 months
Past 12 months
2024
-
2023
-
2022
-
2021
$400,530
2020
-
2019
-
2018
-
2017
-
2016
-
2015
$502,250
2014
$550,000
2013
$535,000
2012
$332,310
2011
$425,880
2010
$422,100
2009
$292,030
2008
$599,000
2007
-
2006
$549,000
2005
$388,000
2004
-
2003
-
The Gallery
$1,693
Avg. Price / ft2
Past 12 months
Past 12 months
2024
-
2023
-
2022
-
2021
$1,392
2020
-
2019
-
2018
$1,407
2017
$1,357
2016
-
2015
-
2014
$2,016
2013
$1,527
2012
$1,007
2011
$977
2010
$1,054
2009
$953
2008
$1,571
2007
-
2006
-
2005
$1,208
2004
-
2003
$621
The Gallery
$983,998
Avg. Price
Past 12 months
Past 12 months
2024
-
2023
-
2022
-
2021
$581,849
2020
-
2019
-
2018
$678,000
2017
$604,000
2016
-
2015
-
2014
$1,411,000
2013
$973,333
2012
$577,500
2011
$539,000
2010
$591,778
2009
$624,500
2008
$1,100,000
2007
-
2006
-
2005
$843,967
2004
-
2003
$435,000
The Gallery
$1,693
Median Price / ft2
Past 12 months
Past 12 months
2024
-
2023
-
2022
-
2021
$1,409
2020
-
2019
-
2018
$1,407
2017
$1,357
2016
-
2015
-
2014
$2,016
2013
$1,426
2012
$1,007
2011
$977
2010
$960
2009
$953
2008
$1,571
2007
-
2006
-
2005
$1,279
2004
-
2003
$621
The Gallery
$983,998
Median Price
Past 12 months
Past 12 months
2024
-
2023
-
2022
-
2021
$605,859
2020
-
2019
-
2018
$678,000
2017
$604,000
2016
-
2015
-
2014
$1,411,000
2013
$995,000
2012
$577,500
2011
$539,000
2010
$485,000
2009
$624,500
2008
$1,100,000
2007
-
2006
-
2005
$895,000
2004
-
2003
$435,000
The Gallery
$1,333
Avg. Price / ft2
Past 12 months
Past 12 months
2024
-
2023
-
2022
-
2021
-
2020
-
2019
-
2018
$1,571
2017
$1,325
2016
$1,483
2015
-
2014
$895
2013
-
2012
-
2011
$887
2010
$1,242
2009
-
2008
$1,248
2007
-
2006
-
2005
-
2004
$818
2003
-
The Gallery
$999,900
Avg. Price
Past 12 months
Past 12 months
2024
-
2023
-
2022
-
2021
-
2020
-
2019
-
2018
$1,100,000
2017
$1,238,258
2016
$890,000
2015
-
2014
$895,000
2013
-
2012
-
2011
$600,000
2010
$745,000
2009
-
2008
$749,000
2007
-
2006
-
2005
-
2004
$581,285
2003
-
The Gallery
$1,333
Median Price / ft2
Past 12 months
Past 12 months
2024
-
2023
-
2022
-
2021
-
2020
-
2019
-
2018
$1,571
2017
$1,325
2016
$1,483
2015
-
2014
$895
2013
-
2012
-
2011
$887
2010
$1,242
2009
-
2008
$1,248
2007
-
2006
-
2005
-
2004
$786
2003
-
The Gallery
$999,900
Median Price
Past 12 months
Past 12 months
2024
-
2023
-
2022
-
2021
-
2020
-
2019
-
2018
$1,100,000
2017
$1,238,258
2016
$890,000
2015
-
2014
$895,000
2013
-
2012
-
2011
$600,000
2010
$745,000
2009
-
2008
$749,000
2007
-
2006
-
2005
-
2004
$549,855
2003
-
The Gallery
N/A
Avg. Price / ft2
Past 12 months
Past 12 months
2024
-
2023
-
2022
-
2021
-
2020
-
2019
-
2018
-
2017
-
2016
-
2015
-
2014
-
2013
-
2012
-
2011
-
2010
-
2009
-
2008
-
2007
-
2006
-
2005
-
2004
-
2003
-
The Gallery
N/A
Avg. Price
Past 12 months
Past 12 months
2024
-
2023
-
2022
-
2021
-
2020
-
2019
-
2018
-
2017
-
2016
-
2015
-
2014
-
2013
-
2012
-
2011
-
2010
-
2009
-
2008
-
2007
-
2006
-
2005
-
2004
-
2003
-
The Gallery
N/A
Median Price / ft2
Past 12 months
Past 12 months
2024
-
2023
-
2022
-
2021
-
2020
-
2019
-
2018
-
2017
-
2016
-
2015
-
2014
-
2013
-
2012
-
2011
-
2010
-
2009
-
2008
-
2007
-
2006
-
2005
-
2004
-
2003
-
The Gallery
N/A
Median Price
Past 12 months
Past 12 months
2024
-
2023
-
2022
-
2021
-
2020
-
2019
-
2018
-
2017
-
2016
-
2015
-
2014
-
2013
-
2012
-
2011
-
2010
-
2009
-
2008
-
2007
-
2006
-
2005
-
2004
-
2003
-
The Gallery
N/A
Avg. Price / ft2
Past 12 months
Past 12 months
2024
-
2023
-
2022
-
2021
-
2020
-
2019
-
2018
-
2017
-
2016
-
2015
-
2014
-
2013
-
2012
-
2011
-
2010
-
2009
-
2008
-
2007
-
2006
-
2005
-
2004
-
2003
-
The Gallery
N/A
Avg. Price
Past 12 months
Past 12 months
2024
-
2023
-
2022
-
2021
-
2020
-
2019
-
2018
-
2017
-
2016
-
2015
-
2014
-
2013
-
2012
-
2011
-
2010
-
2009
-
2008
-
2007
-
2006
-
2005
-
2004
-
2003
-
The Gallery
N/A
Median Price / ft2
Past 12 months
Past 12 months
2024
-
2023
-
2022
-
2021
-
2020
-
2019
-
2018
-
2017
-
2016
-
2015
-
2014
-
2013
-
2012
-
2011
-
2010
-
2009
-
2008
-
2007
-
2006
-
2005
-
2004
-
2003
-
The Gallery
N/A
Median Price
Past 12 months
Past 12 months
2024
-
2023
-
2022
-
2021
-
2020
-
2019
-
2018
-
2017
-
2016
-
2015
-
2014
-
2013
-
2012
-
2011
-
2010
-
2009
-
2008
-
2007
-
2006
-
2005
-
2004
-
2003
-

 6sqft delivers the latest on real estate, architecture, and design, straight from New York City.
