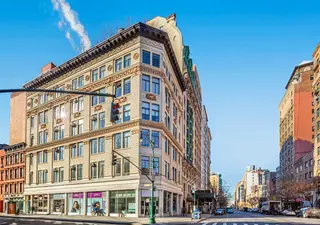
The Park & Tilford, 100 West 72nd Street: Price Comparison
between Columbus Avenue & Amsterdam Avenue Building Profile
The Park & Tilford
$560,000
Avg. Price
Past 12 months
Past 12 months
2024
-
2023
$763,000
2022
$1,408,333
2021
$2,400,000
2020
-
2019
-
2018
-
2017
$755,000
2016
$546,000
2015
$616,250
2014
$590,000
2013
$763,750
2012
$365,000
2011
-
2010
-
2009
$652,500
2008
$646,250
2007
$637,000
2006
$525,000
2005
$655,713
2004
$925,000
2003
$350,000
The Park & Tilford
$560,000
Median Price
Past 12 months
Past 12 months
2024
-
2023
$763,000
2022
$1,150,000
2021
$2,400,000
2020
-
2019
-
2018
-
2017
$755,000
2016
$546,000
2015
$652,500
2014
$590,000
2013
$694,500
2012
$365,000
2011
-
2010
-
2009
$652,500
2008
$646,250
2007
$637,000
2006
$525,000
2005
$485,000
2004
$925,000
2003
$350,000
The Park & Tilford
N/A
Avg. Price
Past 12 months
Past 12 months
2024
-
2023
$763,000
2022
-
2021
-
2020
-
2019
-
2018
-
2017
-
2016
$546,000
2015
$577,500
2014
-
2013
$416,000
2012
$365,000
2011
-
2010
-
2009
$530,000
2008
$550,000
2007
-
2006
-
2005
-
2004
-
2003
-
The Park & Tilford
N/A
Median Price
Past 12 months
Past 12 months
2024
-
2023
$763,000
2022
-
2021
-
2020
-
2019
-
2018
-
2017
-
2016
$546,000
2015
$577,500
2014
-
2013
$416,000
2012
$365,000
2011
-
2010
-
2009
$530,000
2008
$550,000
2007
-
2006
-
2005
-
2004
-
2003
-
The Park & Tilford
$560,000
Avg. Price
Past 12 months
Past 12 months
2024
-
2023
-
2022
-
2021
-
2020
-
2019
-
2018
-
2017
$755,000
2016
-
2015
$630,833
2014
$590,000
2013
$519,000
2012
-
2011
-
2010
-
2009
$775,000
2008
-
2007
-
2006
-
2005
-
2004
-
2003
$350,000
The Park & Tilford
$560,000
Median Price
Past 12 months
Past 12 months
2024
-
2023
-
2022
-
2021
-
2020
-
2019
-
2018
-
2017
$755,000
2016
-
2015
$655,000
2014
$590,000
2013
$519,000
2012
-
2011
-
2010
-
2009
$775,000
2008
-
2007
-
2006
-
2005
-
2004
-
2003
$350,000
The Park & Tilford
N/A
Avg. Price
Past 12 months
Past 12 months
2024
-
2023
-
2022
$1,408,333
2021
-
2020
-
2019
-
2018
-
2017
-
2016
-
2015
$650,000
2014
-
2013
$1,060,000
2012
-
2011
-
2010
-
2009
-
2008
$742,500
2007
$749,000
2006
-
2005
$995,000
2004
-
2003
-
The Park & Tilford
N/A
Median Price
Past 12 months
Past 12 months
2024
-
2023
-
2022
$1,150,000
2021
-
2020
-
2019
-
2018
-
2017
-
2016
-
2015
$650,000
2014
-
2013
$1,060,000
2012
-
2011
-
2010
-
2009
-
2008
$742,500
2007
$749,000
2006
-
2005
$995,000
2004
-
2003
-
The Park & Tilford
N/A
Avg. Price
Past 12 months
Past 12 months
2024
-
2023
-
2022
-
2021
$2,400,000
2020
-
2019
-
2018
-
2017
-
2016
-
2015
-
2014
-
2013
-
2012
-
2011
-
2010
-
2009
-
2008
-
2007
-
2006
-
2005
-
2004
-
2003
-
The Park & Tilford
N/A
Median Price
Past 12 months
Past 12 months
2024
-
2023
-
2022
-
2021
$2,400,000
2020
-
2019
-
2018
-
2017
-
2016
-
2015
-
2014
-
2013
-
2012
-
2011
-
2010
-
2009
-
2008
-
2007
-
2006
-
2005
-
2004
-
2003
-
The Park & Tilford
N/A
Avg. Price
Past 12 months
Past 12 months
2024
-
2023
-
2022
-
2021
-
2020
-
2019
-
2018
-
2017
-
2016
-
2015
-
2014
-
2013
-
2012
-
2011
-
2010
-
2009
-
2008
-
2007
-
2006
-
2005
-
2004
-
2003
-
The Park & Tilford
N/A
Median Price
Past 12 months
Past 12 months
2024
-
2023
-
2022
-
2021
-
2020
-
2019
-
2018
-
2017
-
2016
-
2015
-
2014
-
2013
-
2012
-
2011
-
2010
-
2009
-
2008
-
2007
-
2006
-
2005
-
2004
-
2003
-
The Park & Tilford
N/A
Avg. Price
Past 12 months
Past 12 months
2024
-
2023
-
2022
-
2021
-
2020
-
2019
-
2018
-
2017
-
2016
-
2015
-
2014
-
2013
-
2012
-
2011
-
2010
-
2009
-
2008
-
2007
-
2006
-
2005
-
2004
-
2003
-
The Park & Tilford
N/A
Median Price
Past 12 months
Past 12 months
2024
-
2023
-
2022
-
2021
-
2020
-
2019
-
2018
-
2017
-
2016
-
2015
-
2014
-
2013
-
2012
-
2011
-
2010
-
2009
-
2008
-
2007
-
2006
-
2005
-
2004
-
2003
-