40 West 17th Street: Price Comparison
between Fifth Avenue & Avenue of the Americas Building Profile
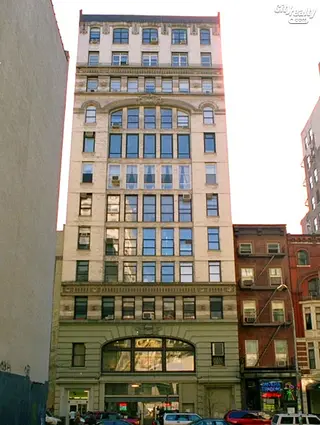
40 West 17th Street
$2,595,000
Avg. Price
Past 12 months
Past 12 months
2024
$1,896,211
2023
-
2022
-
2021
-
2020
-
2019
$3,300,000
2018
$3,181,600
2017
-
2016
$2,483,333
2015
$2,325,000
2014
-
2013
$2,520,169
2012
-
2011
-
2010
-
2009
$1,525,000
2008
$2,035,000
2007
-
2006
-
2005
-
2004
$1,367,500
2003
-
40 West 17th Street
$2,595,000
Median Price
Past 12 months
Past 12 months
2024
$1,896,211
2023
-
2022
-
2021
-
2020
-
2019
$3,300,000
2018
$3,181,600
2017
-
2016
$2,200,000
2015
$2,325,000
2014
-
2013
$2,520,169
2012
-
2011
-
2010
-
2009
$1,525,000
2008
$2,035,000
2007
-
2006
-
2005
-
2004
$1,367,500
2003
-
40 West 17th Street
N/A
Avg. Price
Past 12 months
Past 12 months
2024
-
2023
-
2022
-
2021
-
2020
-
2019
-
2018
-
2017
-
2016
-
2015
-
2014
-
2013
-
2012
-
2011
-
2010
-
2009
-
2008
-
2007
-
2006
-
2005
-
2004
-
2003
-
40 West 17th Street
N/A
Median Price
Past 12 months
Past 12 months
2024
-
2023
-
2022
-
2021
-
2020
-
2019
-
2018
-
2017
-
2016
-
2015
-
2014
-
2013
-
2012
-
2011
-
2010
-
2009
-
2008
-
2007
-
2006
-
2005
-
2004
-
2003
-
40 West 17th Street
N/A
Avg. Price
Past 12 months
Past 12 months
2024
-
2023
-
2022
-
2021
-
2020
-
2019
-
2018
-
2017
-
2016
-
2015
-
2014
-
2013
-
2012
-
2011
-
2010
-
2009
-
2008
-
2007
-
2006
-
2005
-
2004
-
2003
-
40 West 17th Street
N/A
Median Price
Past 12 months
Past 12 months
2024
-
2023
-
2022
-
2021
-
2020
-
2019
-
2018
-
2017
-
2016
-
2015
-
2014
-
2013
-
2012
-
2011
-
2010
-
2009
-
2008
-
2007
-
2006
-
2005
-
2004
-
2003
-
40 West 17th Street
$2,595,000
Avg. Price
Past 12 months
Past 12 months
2024
$1,896,211
2023
-
2022
-
2021
-
2020
-
2019
-
2018
$2,325,000
2017
-
2016
$2,200,000
2015
$2,325,000
2014
-
2013
$2,138,325
2012
-
2011
-
2010
-
2009
$1,525,000
2008
-
2007
-
2006
-
2005
-
2004
$1,435,000
2003
-
40 West 17th Street
$2,595,000
Median Price
Past 12 months
Past 12 months
2024
$1,896,211
2023
-
2022
-
2021
-
2020
-
2019
-
2018
$2,325,000
2017
-
2016
$2,200,000
2015
$2,325,000
2014
-
2013
$2,138,325
2012
-
2011
-
2010
-
2009
$1,525,000
2008
-
2007
-
2006
-
2005
-
2004
$1,435,000
2003
-
40 West 17th Street
N/A
Avg. Price
Past 12 months
Past 12 months
2024
-
2023
-
2022
-
2021
-
2020
-
2019
-
2018
-
2017
-
2016
$2,625,000
2015
-
2014
-
2013
-
2012
-
2011
-
2010
-
2009
-
2008
$2,035,000
2007
-
2006
-
2005
-
2004
$1,300,000
2003
-
40 West 17th Street
N/A
Median Price
Past 12 months
Past 12 months
2024
-
2023
-
2022
-
2021
-
2020
-
2019
-
2018
-
2017
-
2016
$2,625,000
2015
-
2014
-
2013
-
2012
-
2011
-
2010
-
2009
-
2008
$2,035,000
2007
-
2006
-
2005
-
2004
$1,300,000
2003
-
40 West 17th Street
N/A
Avg. Price
Past 12 months
Past 12 months
2024
-
2023
-
2022
-
2021
-
2020
-
2019
$3,300,000
2018
$4,038,200
2017
-
2016
-
2015
-
2014
-
2013
-
2012
-
2011
-
2010
-
2009
-
2008
-
2007
-
2006
-
2005
-
2004
-
2003
-
40 West 17th Street
N/A
Median Price
Past 12 months
Past 12 months
2024
-
2023
-
2022
-
2021
-
2020
-
2019
$3,300,000
2018
$4,038,200
2017
-
2016
-
2015
-
2014
-
2013
-
2012
-
2011
-
2010
-
2009
-
2008
-
2007
-
2006
-
2005
-
2004
-
2003
-
40 West 17th Street
N/A
Avg. Price
Past 12 months
Past 12 months
2024
-
2023
-
2022
-
2021
-
2020
-
2019
-
2018
-
2017
-
2016
-
2015
-
2014
-
2013
-
2012
-
2011
-
2010
-
2009
-
2008
-
2007
-
2006
-
2005
-
2004
-
2003
-
40 West 17th Street
N/A
Median Price
Past 12 months
Past 12 months
2024
-
2023
-
2022
-
2021
-
2020
-
2019
-
2018
-
2017
-
2016
-
2015
-
2014
-
2013
-
2012
-
2011
-
2010
-
2009
-
2008
-
2007
-
2006
-
2005
-
2004
-
2003
-
Chelsea Arms
$1,383
Avg. Price / ft2
Past 12 months
Past 12 months
$863
-
-
-
-
$1,218
-
$1,155
$932
-
$994
$868
$883
$932
-
$822
$1,039
$951
$842
$727
-
-
Chelsea Arms
$772,500
Avg. Price
Past 12 months
Past 12 months
$478,333
$358,000
$375,000
-
-
$670,000
$712,597
$635,000
$621,667
$496,000
$434,500
$459,125
$465,929
$544,000
-
$509,667
$515,900
$437,259
$436,000
$401,600
$425,000
$205,000
Chelsea Arms
$765,000
Median Price
Past 12 months
Past 12 months
$450,000
$358,000
$375,000
-
-
$670,000
$675,000
$635,000
$600,000
$472,000
$439,000
$497,000
$525,000
$540,500
-
$494,000
$567,500
$467,500
$450,000
$407,000
$425,000
$205,000
Chelsea Arms
N/A
Avg. Price / ft2
Past 12 months
Past 12 months
$863
-
-
-
-
-
-
-
-
-
$1,042
-
-
-
-
-
-
-
$842
$684
-
-
Chelsea Arms
N/A
Avg. Price
Past 12 months
Past 12 months
$430,000
$358,000
$375,000
-
-
-
-
-
-
$372,000
$402,000
$312,500
$295,000
-
-
-
$340,000
$235,531
$350,000
$325,000
-
$110,000
Chelsea Arms
N/A
Median Price
Past 12 months
Past 12 months
$430,000
$358,000
$375,000
-
-
-
-
-
-
$372,000
$399,000
$312,500
$295,000
-
-
-
$340,000
$300,000
$350,000
$325,000
-
$110,000
Chelsea Arms
$1,383
Avg. Price / ft2
Past 12 months
Past 12 months
-
-
-
-
-
$1,218
-
$1,155
$932
-
$945
$868
$883
$932
-
$822
$1,039
$951
-
$742
-
-
Chelsea Arms
$772,500
Avg. Price
Past 12 months
Past 12 months
$575,000
-
-
-
-
$670,000
$712,597
$635,000
$621,667
$620,000
$499,500
$508,000
$534,300
$544,000
-
$509,667
$559,875
$523,714
$493,333
$420,750
$425,000
$300,000
Chelsea Arms
$765,000
Median Price
Past 12 months
Past 12 months
$575,000
-
-
-
-
$670,000
$675,000
$635,000
$600,000
$620,000
$499,500
$519,000
$530,000
$540,500
-
$494,000
$578,750
$535,000
$505,000
$421,500
$425,000
$300,000
Chelsea Arms
N/A
Avg. Price / ft2
Past 12 months
Past 12 months
-
-
-
-
-
-
-
-
-
-
-
-
-
-
-
-
-
-
-
-
-
-
Chelsea Arms
N/A
Avg. Price
Past 12 months
Past 12 months
-
-
-
-
-
-
-
-
-
-
-
-
-
-
-
-
-
-
-
-
-
-
Chelsea Arms
N/A
Median Price
Past 12 months
Past 12 months
-
-
-
-
-
-
-
-
-
-
-
-
-
-
-
-
-
-
-
-
-
-
Chelsea Arms
N/A
Avg. Price / ft2
Past 12 months
Past 12 months
-
-
-
-
-
-
-
-
-
-
-
-
-
-
-
-
-
-
-
-
-
-
Chelsea Arms
N/A
Avg. Price
Past 12 months
Past 12 months
-
-
-
-
-
-
-
-
-
-
-
-
-
-
-
-
-
-
-
-
-
-
Chelsea Arms
N/A
Median Price
Past 12 months
Past 12 months
-
-
-
-
-
-
-
-
-
-
-
-
-
-
-
-
-
-
-
-
-
-
London Terrace Towers
$1,249
Avg. Price / ft2
Past 12 months
Past 12 months
$1,040
-
$1,469
$1,169
$1,195
$1,241
$1,123
$1,252
$1,329
$1,159
$1,032
$1,000
$992
$664
$1,230
$1,190
$1,112
$979
$950
$1,217
$816
$595
London Terrace Towers
$1,335,459
Avg. Price
Past 12 months
Past 12 months
$577,500
$605,000
$1,108,816
$597,166
$733,250
$1,086,167
$833,073
$1,170,643
$1,303,500
$1,086,500
$802,718
$786,821
$992,462
$924,000
$621,667
$934,044
$659,375
$574,167
$656,233
$618,906
$473,784
$368,501
London Terrace Towers
$643,750
Median Price
Past 12 months
Past 12 months
$570,000
$605,000
$850,000
$562,500
$733,250
$623,500
$674,250
$640,500
$1,045,000
$597,000
$545,000
$510,750
$550,000
$459,000
$465,000
$537,500
$575,500
$528,000
$520,000
$587,500
$370,000
$305,000
London Terrace Towers
$1,174
Avg. Price / ft2
Past 12 months
Past 12 months
$1,311
-
$1,850
$1,185
$1,195
$1,217
$1,285
$1,252
-
$1,127
$1,032
$948
$1,065
$833
$1,230
$881
$1,309
$1,019
$1,056
$1,317
$816
$584
London Terrace Towers
$604,250
Avg. Price
Past 12 months
Past 12 months
$534,583
$605,000
$815,667
$566,563
$733,250
$589,000
$730,563
$1,136,826
$2,022,500
$563,800
$791,100
$504,761
$531,500
$458,000
$621,667
$488,429
$607,563
$509,200
$610,100
$539,500
$335,000
$303,093
London Terrace Towers
$600,000
Median Price
Past 12 months
Past 12 months
$537,500
$605,000
$618,250
$560,000
$733,250
$595,000
$653,000
$638,000
$2,022,500
$595,000
$545,000
$474,000
$479,500
$458,000
$465,000
$405,000
$565,750
$480,000
$539,000
$455,000
$329,500
$282,837
London Terrace Towers
$1,323
Avg. Price / ft2
Past 12 months
Past 12 months
-
-
-
-
-
$927
$1,236
-
$1,329
$1,409
-
$1,389
$1,000
$494
-
$862
$1,094
-
$1,008
$917
-
$610
London Terrace Towers
$835,000
Avg. Price
Past 12 months
Past 12 months
-
-
$550,000
-
-
$625,000
$1,153,000
$1,475,000
$824,167
$1,550,000
$485,000
$1,250,000
$550,000
$452,500
-
$418,000
$665,000
-
$868,333
$550,000
-
$515,671
London Terrace Towers
$762,500
Median Price
Past 12 months
Past 12 months
-
-
$550,000
-
-
$625,000
$1,075,000
$1,475,000
$712,500
$1,550,000
$485,000
$1,250,000
$550,000
$452,500
-
$418,000
$665,000
-
$845,000
$550,000
-
$555,091
London Terrace Towers
N/A
Avg. Price / ft2
Past 12 months
Past 12 months
-
-
$996
$995
-
$1,944
-
-
-
-
-
-
-
-
-
$2,444
-
$899
-
-
-
-
London Terrace Towers
N/A
Avg. Price
Past 12 months
Past 12 months
-
-
$1,663,991
$995,000
-
$3,500,000
-
-
-
-
$1,225,000
-
$1,225,000
-
-
$4,400,000
$1,150,000
$899,000
-
-
-
-
London Terrace Towers
N/A
Median Price
Past 12 months
Past 12 months
-
-
$1,663,991
$995,000
-
$3,500,000
-
-
-
-
$1,225,000
-
$1,225,000
-
-
$4,400,000
$1,150,000
$899,000
-
-
-
-
London Terrace Towers
N/A
Avg. Price / ft2
Past 12 months
Past 12 months
$499
-
$507
-
-
-
$414
-
-
-
-
-
$546
-
-
-
$341
-
$307
-
-
-
London Terrace Towers
$6,900,000
Avg. Price
Past 12 months
Past 12 months
$835,000
-
$1,712,500
-
-
-
$693,381
-
-
$5,850,000
-
-
$915,000
-
-
$1,500,000
$572,000
-
$515,000
-
-
-
London Terrace Towers
$6,900,000
Median Price
Past 12 months
Past 12 months
$835,000
-
$1,712,500
-
-
-
$693,381
-
-
$5,850,000
-
-
$915,000
-
-
$1,500,000
$572,000
-
$515,000
-
-
-
London Terrace Towers
N/A
Avg. Price / ft2
Past 12 months
Past 12 months
-
-
-
-
-
-
-
-
-
-
-
$872
-
-
-
-
-
-
-
-
-
-
London Terrace Towers
N/A
Avg. Price
Past 12 months
Past 12 months
-
-
-
-
-
-
-
-
-
-
-
$2,399,000
-
-
-
-
-
-
-
-
-
-
London Terrace Towers
N/A
Median Price
Past 12 months
Past 12 months
-
-
-
-
-
-
-
-
-
-
-
$2,399,000
-
-
-
-
-
-
-
-
-
-
London Terrace Towers
N/A
Avg. Price / ft2
Past 12 months
Past 12 months
-
-
-
-
-
-
-
-
-
-
-
-
-
-
-
-
-
-
-
-
-
-
London Terrace Towers
N/A
Avg. Price
Past 12 months
Past 12 months
-
-
-
-
-
-
-
-
-
-
-
-
-
-
-
-
-
-
-
-
-
-
London Terrace Towers
N/A
Median Price
Past 12 months
Past 12 months
-
-
-
-
-
-
-
-
-
-
-
-
-
-
-
-
-
-
-
-
-
-
130 West 17th Street
$1,139
Avg. Price / ft2
Past 12 months
Past 12 months
-
-
$1,218
$819
-
$1,250
-
-
-
-
$1,490
$910
$1,349
-
$720
$337
$1,326
-
-
-
-
$789
130 West 17th Street
$1,797,500
Avg. Price
Past 12 months
Past 12 months
-
-
$2,232,500
$1,027,500
-
$3,250,000
-
-
-
$1,900,000
$2,495,000
$2,365,471
$2,218,750
-
$1,800,000
$875,000
$2,105,000
$1,250,000
$1,792,500
$1,481,250
-
$1,290,750
130 West 17th Street
$1,797,500
Median Price
Past 12 months
Past 12 months
-
-
$2,232,500
$1,027,500
-
$3,250,000
-
-
-
$1,900,000
$2,495,000
$2,365,471
$2,218,750
-
$1,800,000
$875,000
$2,105,000
$1,250,000
$1,792,500
$1,481,250
-
$1,290,750
130 West 17th Street
N/A
Avg. Price / ft2
Past 12 months
Past 12 months
-
-
-
-
-
-
-
-
-
-
-
-
-
-
-
-
-
-
-
-
-
-
130 West 17th Street
N/A
Avg. Price
Past 12 months
Past 12 months
-
-
-
-
-
-
-
-
-
-
-
-
-
-
-
-
-
-
-
-
-
-
130 West 17th Street
N/A
Median Price
Past 12 months
Past 12 months
-
-
-
-
-
-
-
-
-
-
-
-
-
-
-
-
-
-
-
-
-
-
130 West 17th Street
N/A
Avg. Price / ft2
Past 12 months
Past 12 months
-
-
$1,333
$819
-
-
-
-
-
-
-
-
-
-
-
-
-
-
-
-
-
-
130 West 17th Street
N/A
Avg. Price
Past 12 months
Past 12 months
-
-
$1,600,000
$1,027,500
-
-
-
-
-
-
-
-
-
-
-
-
$1,360,000
$1,250,000
$1,792,500
$1,481,250
-
-
130 West 17th Street
N/A
Median Price
Past 12 months
Past 12 months
-
-
$1,600,000
$1,027,500
-
-
-
-
-
-
-
-
-
-
-
-
$1,360,000
$1,250,000
$1,792,500
$1,481,250
-
-
130 West 17th Street
$1,139
Avg. Price / ft2
Past 12 months
Past 12 months
-
-
-
-
-
-
-
-
-
-
$1,490
-
-
-
-
-
-
-
-
-
-
-
130 West 17th Street
$1,395,000
Avg. Price
Past 12 months
Past 12 months
-
-
-
-
-
-
-
-
-
$1,900,000
$2,495,000
-
$1,537,500
-
-
-
-
-
-
-
-
$885,000
130 West 17th Street
$1,395,000
Median Price
Past 12 months
Past 12 months
-
-
-
-
-
-
-
-
-
$1,900,000
$2,495,000
-
$1,537,500
-
-
-
-
-
-
-
-
$885,000
130 West 17th Street
N/A
Avg. Price / ft2
Past 12 months
Past 12 months
-
-
$1,102
-
-
$1,250
-
-
-
-
-
$910
$1,349
-
$720
$337
$1,326
-
-
-
-
$789
130 West 17th Street
$2,200,000
Avg. Price
Past 12 months
Past 12 months
-
-
$2,865,000
-
-
$3,250,000
-
-
-
-
-
$2,365,471
$2,900,000
-
$1,800,000
$875,000
$2,850,000
-
-
-
-
$1,696,500
130 West 17th Street
$2,200,000
Median Price
Past 12 months
Past 12 months
-
-
$2,865,000
-
-
$3,250,000
-
-
-
-
-
$2,365,471
$2,900,000
-
$1,800,000
$875,000
$2,850,000
-
-
-
-
$1,696,500
130 West 17th Street
N/A
Avg. Price / ft2
Past 12 months
Past 12 months
-
-
-
-
-
-
-
-
-
-
-
-
-
-
-
-
-
-
-
-
-
-
130 West 17th Street
N/A
Avg. Price
Past 12 months
Past 12 months
-
-
-
-
-
-
-
-
-
-
-
-
-
-
-
-
-
-
-
-
-
-
130 West 17th Street
N/A
Median Price
Past 12 months
Past 12 months
-
-
-
-
-
-
-
-
-
-
-
-
-
-
-
-
-
-
-
-
-
-
130 West 17th Street
N/A
Avg. Price / ft2
Past 12 months
Past 12 months
-
-
-
-
-
-
-
-
-
-
-
-
-
-
-
-
-
-
-
-
-
-
130 West 17th Street
N/A
Avg. Price
Past 12 months
Past 12 months
-
-
-
-
-
-
-
-
-
-
-
-
-
-
-
-
-
-
-
-
-
-
130 West 17th Street
N/A
Median Price
Past 12 months
Past 12 months
-
-
-
-
-
-
-
-
-
-
-
-
-
-
-
-
-
-
-
-
-
-
Chelsea Mews
$1,085
Avg. Price / ft2
Past 12 months
Past 12 months
-
$1,226
$1,103
$998
$1,065
$1,034
$1,200
$1,263
-
$1,295
$1,144
$942
$726
$613
$750
$812
$856
$831
$771
$752
$560
$478
Chelsea Mews
$1,045,625
Avg. Price
Past 12 months
Past 12 months
-
$1,200,833
$962,714
$1,371,667
$1,030,000
$962,500
$928,200
$1,152,500
-
$1,093,583
$1,176,000
$858,571
$571,250
$708,000
$638,000
$652,000
$639,400
$715,167
$634,971
$711,776
$523,533
$460,667
Chelsea Mews
$1,075,000
Median Price
Past 12 months
Past 12 months
-
$1,150,000
$940,000
$1,560,000
$1,030,000
$962,500
$950,000
$1,152,500
-
$1,085,750
$1,225,000
$710,000
$491,250
$615,000
$625,000
$652,000
$720,000
$729,500
$507,000
$715,000
$525,000
$460,000
Chelsea Mews
$1,011
Avg. Price / ft2
Past 12 months
Past 12 months
-
-
$1,007
-
-
-
$1,100
-
-
$1,009
-
$741
$773
$814
$629
-
$842
-
$807
-
$503
$430
Chelsea Mews
$637,500
Avg. Price
Past 12 months
Past 12 months
-
-
$627,500
-
-
-
$626,667
-
-
$570,000
-
$535,000
$450,417
$495,000
$440,000
-
$513,500
-
$498,167
-
$328,333
$285,000
Chelsea Mews
$637,500
Median Price
Past 12 months
Past 12 months
-
-
$627,500
-
-
-
$610,000
-
-
$570,000
-
$535,000
$460,000
$495,000
$440,000
-
$513,500
-
$491,500
-
$330,000
$285,000
Chelsea Mews
$1,313
Avg. Price / ft2
Past 12 months
Past 12 months
-
$1,120
$1,028
$1,100
$1,129
$931
$1,112
$1,208
-
$1,357
$1,000
$974
-
$396
$728
$965
$864
$851
$736
$769
$563
-
Chelsea Mews
$1,100,000
Avg. Price
Past 12 months
Past 12 months
-
$1,065,833
$837,000
$880,000
$960,000
$675,000
$1,004,000
$725,000
-
$1,085,750
$875,000
$743,750
$665,000
$545,000
$586,000
$579,000
$722,500
$601,500
$566,167
$625,848
$478,500
$630,000
Chelsea Mews
$1,050,000
Median Price
Past 12 months
Past 12 months
-
$985,000
$837,000
$880,000
$960,000
$675,000
$975,000
$725,000
-
$1,085,750
$875,000
$705,000
$665,000
$545,000
$582,500
$579,000
$722,500
$601,500
$507,000
$593,000
$510,000
$630,000
Chelsea Mews
$957
Avg. Price / ft2
Past 12 months
Past 12 months
-
$1,438
$1,217
$1,047
$1,000
$1,136
$1,749
$1,317
-
$1,519
$1,180
$995
$583
$750
$844
$659
$853
$817
-
$726
$659
$575
Chelsea Mews
$1,263,333
Avg. Price
Past 12 months
Past 12 months
-
$1,470,833
$1,270,000
$1,675,000
$1,100,000
$1,250,000
$1,191,000
$1,580,000
-
$1,625,000
$1,251,250
$1,250,000
$840,000
$1,050,000
$841,000
$725,000
$725,000
$772,000
-
$900,000
$653,750
$615,000
Chelsea Mews
$1,140,000
Median Price
Past 12 months
Past 12 months
-
$1,537,500
$1,195,000
$1,675,000
$1,100,000
$1,250,000
$1,191,000
$1,580,000
-
$1,625,000
$1,262,500
$1,250,000
$840,000
$1,050,000
$841,000
$725,000
$725,000
$779,500
-
$810,000
$657,500
$615,000
Chelsea Mews
N/A
Avg. Price / ft2
Past 12 months
Past 12 months
-
-
-
$848
-
-
-
-
-
-
-
-
-
$492
-
-
-
-
-
-
$470
-
Chelsea Mews
N/A
Avg. Price
Past 12 months
Past 12 months
-
-
-
$1,560,000
-
-
-
-
-
-
-
-
-
$905,000
-
-
-
-
-
-
$865,000
-
Chelsea Mews
N/A
Median Price
Past 12 months
Past 12 months
-
-
-
$1,560,000
-
-
-
-
-
-
-
-
-
$905,000
-
-
-
-
-
-
$865,000
-
Chelsea Mews
N/A
Avg. Price / ft2
Past 12 months
Past 12 months
-
-
-
-
-
-
-
-
-
-
-
-
-
-
-
-
-
-
-
-
-
-
Chelsea Mews
N/A
Avg. Price
Past 12 months
Past 12 months
-
-
-
-
-
-
-
-
-
-
-
-
-
-
-
-
-
-
-
-
-
-
Chelsea Mews
N/A
Median Price
Past 12 months
Past 12 months
-
-
-
-
-
-
-
-
-
-
-
-
-
-
-
-
-
-
-
-
-
-
Chelsea Mews
N/A
Avg. Price / ft2
Past 12 months
Past 12 months
-
-
-
-
-
-
-
-
-
-
-
-
-
-
-
-
-
-
-
-
-
-
Chelsea Mews
N/A
Avg. Price
Past 12 months
Past 12 months
-
-
-
-
-
-
-
-
-
-
-
-
-
-
-
-
-
-
-
-
-
-
Chelsea Mews
N/A
Median Price
Past 12 months
Past 12 months
-
-
-
-
-
-
-
-
-
-
-
-
-
-
-
-
-
-
-
-
-
-
The Piermont
$1,047
Avg. Price / ft2
Past 12 months
Past 12 months
$1,060
$1,081
$1,173
$963
$1,168
$1,084
$1,208
$1,188
$1,416
$1,038
$1,034
$1,033
$931
$814
$898
$913
$1,033
$888
$855
$821
$688
$545
The Piermont
$506,739
Avg. Price
Past 12 months
Past 12 months
$546,418
$454,500
$1,072,250
$569,333
$638,333
$498,143
$834,200
$541,643
$587,889
$576,250
$483,931
$484,636
$424,417
$401,967
$397,125
$445,000
$475,000
$444,050
$401,000
$396,750
$329,438
$330,083
The Piermont
$449,000
Median Price
Past 12 months
Past 12 months
$550,000
$434,500
$772,500
$565,000
$585,000
$486,000
$825,000
$505,000
$565,000
$505,000
$495,000
$470,000
$402,250
$393,400
$398,500
$445,000
$490,000
$414,500
$370,000
$420,000
$327,500
$355,250
The Piermont
$1,120
Avg. Price / ft2
Past 12 months
Past 12 months
$1,080
$1,081
$1,228
$796
$1,238
$1,084
$1,242
$1,188
-
$1,038
$878
$1,012
$931
$814
$864
$913
$1,009
$875
$855
$756
$717
$675
The Piermont
$465,362
Avg. Price
Past 12 months
Past 12 months
$550,223
$454,500
$524,500
$398,000
$572,500
$498,143
$590,000
$523,583
$513,000
$407,500
$372,500
$447,850
$396,900
$401,967
$362,833
$480,000
$464,000
$380,625
$401,000
$374,800
$312,214
$270,000
The Piermont
$447,000
Median Price
Past 12 months
Past 12 months
$565,000
$434,500
$524,500
$398,000
$572,500
$486,000
$590,000
$490,000
$530,000
$407,500
$372,500
$449,500
$383,500
$393,400
$337,000
$480,000
$490,000
$392,500
$370,000
$359,000
$325,000
$270,000
The Piermont
$944
Avg. Price / ft2
Past 12 months
Past 12 months
$1,019
-
-
$1,130
$1,027
-
$1,173
-
$1,416
-
$1,190
$1,137
-
-
$1,000
-
$1,156
$930
-
$887
$600
$480
The Piermont
$755,000
Avg. Price
Past 12 months
Past 12 months
$535,000
-
-
$655,000
$770,000
-
$895,250
$650,000
$681,500
$745,000
$595,363
$852,500
$562,000
-
$500,000
$410,000
$520,000
$697,750
-
$433,333
$450,000
$360,125
The Piermont
$755,000
Median Price
Past 12 months
Past 12 months
$535,000
-
-
$655,000
$770,000
-
$852,500
$650,000
$600,500
$745,000
$595,363
$852,500
$562,000
-
$500,000
$410,000
$520,000
$697,750
-
$420,000
$450,000
$360,125
The Piermont
N/A
Avg. Price / ft2
Past 12 months
Past 12 months
-
-
$859
-
-
-
-
-
-
-
-
-
-
-
-
-
-
-
-
-
-
-
The Piermont
N/A
Avg. Price
Past 12 months
Past 12 months
-
-
$945,000
-
-
-
-
-
-
-
-
-
-
-
-
-
-
-
-
-
-
-
The Piermont
N/A
Median Price
Past 12 months
Past 12 months
-
-
$945,000
-
-
-
-
-
-
-
-
-
-
-
-
-
-
-
-
-
-
-
The Piermont
N/A
Avg. Price / ft2
Past 12 months
Past 12 months
-
-
-
-
-
-
-
-
-
-
-
-
-
-
-
-
-
-
-
-
-
-
The Piermont
N/A
Avg. Price
Past 12 months
Past 12 months
-
-
-
-
-
-
-
-
-
-
-
-
-
-
-
-
$485,000
-
-
-
-
-
The Piermont
N/A
Median Price
Past 12 months
Past 12 months
-
-
-
-
-
-
-
-
-
-
-
-
-
-
-
-
$485,000
-
-
-
-
-
The Piermont
N/A
Avg. Price / ft2
Past 12 months
Past 12 months
-
-
$1,378
-
-
-
-
-
-
-
-
-
-
-
-
-
-
-
-
-
-
-
The Piermont
N/A
Avg. Price
Past 12 months
Past 12 months
-
-
$2,295,000
-
-
-
-
-
-
-
-
-
-
-
-
-
-
-
-
-
-
-
The Piermont
N/A
Median Price
Past 12 months
Past 12 months
-
-
$2,295,000
-
-
-
-
-
-
-
-
-
-
-
-
-
-
-
-
-
-
-
The Piermont
N/A
Avg. Price / ft2
Past 12 months
Past 12 months
-
-
-
-
-
-
-
-
-
-
-
-
-
-
-
-
-
-
-
-
-
-
The Piermont
N/A
Avg. Price
Past 12 months
Past 12 months
-
-
-
-
-
-
-
-
-
-
-
-
-
-
-
-
-
-
-
-
-
-
The Piermont
N/A
Median Price
Past 12 months
Past 12 months
-
-
-
-
-
-
-
-
-
-
-
-
-
-
-
-
-
-
-
-
-
-
Kensington House
$937
Avg. Price / ft2
Past 12 months
Past 12 months
$1,075
$1,185
$1,059
$1,012
$1,091
$1,075
$1,026
$1,222
$1,070
$878
$984
$964
$758
$781
$810
$468
$951
$794
$778
$915
$570
$493
Kensington House
$546,667
Avg. Price
Past 12 months
Past 12 months
$546,667
$1,185,000
$499,750
$614,000
$600,000
$590,425
$508,900
$713,250
$672,209
$511,875
$575,771
$522,000
$367,250
$571,500
$394,000
$222,066
$468,250
$487,996
$441,667
$501,917
$262,500
$233,642
Kensington House
$515,000
Median Price
Past 12 months
Past 12 months
$557,500
$1,185,000
$499,750
$560,000
$600,000
$513,625
$505,000
$595,000
$520,000
$477,500
$503,000
$475,000
$369,500
$410,000
$390,000
$222,066
$464,000
$418,241
$385,000
$423,752
$267,500
$220,000
Kensington House
$937
Avg. Price / ft2
Past 12 months
Past 12 months
$1,069
-
$1,059
$1,009
$1,091
$995
$1,026
$1,188
$1,070
$878
$993
$916
$758
$781
$810
$468
$951
$794
$770
$915
$570
$493
Kensington House
$486,000
Avg. Price
Past 12 months
Past 12 months
$546,000
-
$499,750
$511,250
$600,000
$499,906
$508,900
$564,156
$511,511
$474,286
$490,100
$464,000
$367,250
$392,500
$394,000
$222,066
$478,333
$405,661
$375,000
$435,376
$262,500
$231,500
Kensington House
$510,000
Median Price
Past 12 months
Past 12 months
$565,000
-
$499,750
$512,500
$600,000
$509,313
$505,000
$582,500
$501,000
$460,000
$490,500
$457,500
$369,500
$390,000
$390,000
$222,066
$490,000
$389,000
$375,000
$423,752
$267,500
$220,000
Kensington House
N/A
Avg. Price / ft2
Past 12 months
Past 12 months
$1,104
$1,185
-
$1,025
-
$1,314
-
$1,355
-
-
$967
$1,200
-
-
-
-
-
-
$793
-
-
-
Kensington House
$850,000
Avg. Price
Past 12 months
Past 12 months
$550,000
$1,185,000
-
$1,025,000
-
$952,500
-
$1,110,833
-
$775,000
$725,000
$870,000
-
-
-
-
-
$735,000
$575,000
$955,000
-
-
Kensington House
$850,000
Median Price
Past 12 months
Past 12 months
$550,000
$1,185,000
-
$1,025,000
-
$952,500
-
$1,050,000
-
$775,000
$725,000
$870,000
-
-
-
-
-
$735,000
$575,000
$955,000
-
-
Kensington House
N/A
Avg. Price / ft2
Past 12 months
Past 12 months
-
-
-
-
-
-
-
-
-
-
-
-
-
-
-
-
-
-
-
-
-
-
Kensington House
N/A
Avg. Price
Past 12 months
Past 12 months
-
-
-
-
-
-
-
-
$1,315,000
-
-
-
-
-
-
-
-
-
-
-
-
-
Kensington House
N/A
Median Price
Past 12 months
Past 12 months
-
-
-
-
-
-
-
-
$1,315,000
-
-
-
-
-
-
-
-
-
-
-
-
-
Kensington House
N/A
Avg. Price / ft2
Past 12 months
Past 12 months
-
-
-
-
-
-
-
-
-
-
-
-
-
-
-
-
-
-
-
-
-
-
Kensington House
N/A
Avg. Price
Past 12 months
Past 12 months
-
-
-
-
-
-
-
-
-
-
-
-
-
-
-
-
-
-
-
-
-
-
Kensington House
N/A
Median Price
Past 12 months
Past 12 months
-
-
-
-
-
-
-
-
-
-
-
-
-
-
-
-
-
-
-
-
-
-
Kensington House
N/A
Avg. Price / ft2
Past 12 months
Past 12 months
-
-
-
-
-
-
-
-
-
-
-
-
-
-
-
-
-
-
-
-
-
-
Kensington House
N/A
Avg. Price
Past 12 months
Past 12 months
-
-
-
-
-
-
-
-
-
-
-
-
-
-
-
-
-
-
-
-
-
-
Kensington House
N/A
Median Price
Past 12 months
Past 12 months
-
-
-
-
-
-
-
-
-
-
-
-
-
-
-
-
-
-
-
-
-
-
Gilsey House
N/A
Avg. Price / ft2
Past 12 months
Past 12 months
$1,081
-
$966
$1,039
-
-
$886
-
-
$1,300
$1,270
$933
$838
$743
$761
-
-
-
$795
$597
$509
$538
Gilsey House
N/A
Avg. Price
Past 12 months
Past 12 months
$4,585,000
-
$2,000,000
$2,425,000
-
-
$2,494,333
-
$2,000,000
$3,645,000
$2,300,000
$1,900,000
$1,675,500
$1,927,567
$1,486,250
-
$1,250,000
-
$1,470,000
$1,266,000
$1,087,250
$913,000
Gilsey House
N/A
Median Price
Past 12 months
Past 12 months
$4,585,000
-
$2,000,000
$2,425,000
-
-
$2,550,000
-
$2,000,000
$2,865,000
$2,300,000
$1,900,000
$1,675,500
$1,357,700
$1,522,500
-
$1,250,000
-
$1,470,000
$1,300,000
$1,062,000
$913,000
Gilsey House
N/A
Avg. Price / ft2
Past 12 months
Past 12 months
-
-
-
-
-
-
-
-
-
-
-
-
-
-
-
-
-
-
-
-
-
-
Gilsey House
N/A
Avg. Price
Past 12 months
Past 12 months
-
-
-
-
-
-
-
-
-
-
-
-
-
-
-
-
-
-
-
-
-
-
Gilsey House
N/A
Median Price
Past 12 months
Past 12 months
-
-
-
-
-
-
-
-
-
-
-
-
-
-
-
-
-
-
-
-
-
-
Gilsey House
N/A
Avg. Price / ft2
Past 12 months
Past 12 months
-
-
-
-
-
-
-
-
-
$1,191
-
-
-
-
-
-
-
-
-
-
-
-
Gilsey House
N/A
Avg. Price
Past 12 months
Past 12 months
-
-
-
-
-
-
-
-
-
$2,450,000
-
-
-
-
-
-
-
-
-
-
-
-
Gilsey House
N/A
Median Price
Past 12 months
Past 12 months
-
-
-
-
-
-
-
-
-
$2,450,000
-
-
-
-
-
-
-
-
-
-
-
-
Gilsey House
N/A
Avg. Price / ft2
Past 12 months
Past 12 months
-
-
$966
-
-
-
$772
-
-
$1,433
$1,270
$933
$838
-
$761
-
-
-
$795
$575
$539
$538
Gilsey House
N/A
Avg. Price
Past 12 months
Past 12 months
-
-
$2,000,000
-
-
-
$2,275,000
-
$2,000,000
$2,865,000
$2,300,000
$1,900,000
$1,675,500
$1,316,350
$1,486,250
-
$1,250,000
-
$1,470,000
$1,149,000
$1,062,000
$913,000
Gilsey House
N/A
Median Price
Past 12 months
Past 12 months
-
-
$2,000,000
-
-
-
$2,275,000
-
$2,000,000
$2,865,000
$2,300,000
$1,900,000
$1,675,500
$1,316,350
$1,522,500
-
$1,250,000
-
$1,470,000
$1,149,000
$1,062,000
$913,000
Gilsey House
N/A
Avg. Price / ft2
Past 12 months
Past 12 months
-
-
-
$1,039
-
-
-
-
-
$1,088
-
-
-
-
-
-
-
-
-
$642
$450
-
Gilsey House
N/A
Avg. Price
Past 12 months
Past 12 months
-
-
-
$2,425,000
-
-
-
-
-
$3,265,000
-
-
-
-
-
-
-
-
-
$1,500,000
$1,350,000
-
Gilsey House
N/A
Median Price
Past 12 months
Past 12 months
-
-
-
$2,425,000
-
-
-
-
-
$3,265,000
-
-
-
-
-
-
-
-
-
$1,500,000
$1,350,000
-
Gilsey House
N/A
Avg. Price / ft2
Past 12 months
Past 12 months
$1,081
-
-
-
-
-
$1,000
-
-
-
-
-
-
$743
-
-
-
-
-
-
-
-
Gilsey House
N/A
Avg. Price
Past 12 months
Past 12 months
$4,585,000
-
-
-
-
-
$2,933,000
-
-
$2,650,000
-
-
-
$3,150,000
-
-
-
-
-
-
-
-
Gilsey House
N/A
Median Price
Past 12 months
Past 12 months
$4,585,000
-
-
-
-
-
$2,933,000
-
-
$2,650,000
-
-
-
$3,150,000
-
-
-
-
-
-
-
-
Gilsey House
N/A
Avg. Price / ft2
Past 12 months
Past 12 months
-
-
-
-
-
-
-
-
-
$1,488
-
-
-
-
-
-
-
-
-
-
-
-
Gilsey House
N/A
Avg. Price
Past 12 months
Past 12 months
-
-
-
-
-
-
-
-
-
$6,995,000
-
-
-
-
-
-
-
-
-
-
-
-
Gilsey House
N/A
Median Price
Past 12 months
Past 12 months
-
-
-
-
-
-
-
-
-
$6,995,000
-
-
-
-
-
-
-
-
-
-
-
-
Chelsea Gardens
N/A
Avg. Price / ft2
Past 12 months
Past 12 months
$1,284
$1,175
$1,183
$1,197
$1,075
$994
$1,106
$1,452
$1,773
$1,773
$1,159
$1,143
$819
$777
$884
$838
$988
$895
$901
$865
$719
$370
Chelsea Gardens
$1,250,000
Avg. Price
Past 12 months
Past 12 months
$870,000
$789,375
$818,750
$828,000
$776,667
$497,000
$701,875
$1,113,125
$1,364,000
$1,067,500
$805,833
$722,000
$591,429
$460,626
$637,400
$644,000
$638,750
$714,000
$717,500
$589,600
$559,278
$499,850
Chelsea Gardens
$1,250,000
Median Price
Past 12 months
Past 12 months
$870,000
$789,375
$787,500
$879,000
$855,000
$497,000
$697,000
$1,162,500
$1,387,500
$1,067,500
$895,000
$720,000
$655,000
$397,500
$760,000
$655,000
$638,750
$650,000
$717,500
$655,000
$515,000
$499,850
Chelsea Gardens
N/A
Avg. Price / ft2
Past 12 months
Past 12 months
-
-
$1,114
$1,250
$850
$994
$1,152
-
$2,180
$2,100
$920
$1,158
$806
$772
$812
$760
$889
$847
-
$827
$760
-
Chelsea Gardens
N/A
Avg. Price
Past 12 months
Past 12 months
-
$580,000
$567,500
$625,000
$425,000
$497,000
$599,000
$592,500
$1,090,000
$1,050,000
$447,500
$541,667
$396,667
$385,783
$405,750
$395,000
$462,500
$432,500
-
$389,000
$380,000
-
Chelsea Gardens
N/A
Median Price
Past 12 months
Past 12 months
-
$580,000
$567,500
$625,000
$425,000
$497,000
$599,000
$592,500
$1,090,000
$1,050,000
$447,500
$455,000
$435,000
$388,250
$405,750
$395,000
$462,500
$432,500
-
$389,000
$380,000
-
Chelsea Gardens
N/A
Avg. Price / ft2
Past 12 months
Past 12 months
$1,284
$1,175
$1,320
$1,170
$1,188
-
$1,060
$1,452
$1,569
$1,447
$1,219
$1,113
$854
$800
$932
$873
$1,087
$942
$901
$884
$658
-
Chelsea Gardens
N/A
Avg. Price
Past 12 months
Past 12 months
$870,000
$998,750
$1,070,000
$929,500
$952,500
-
$795,000
$1,162,500
$1,387,500
$1,085,000
$985,000
$835,000
$683,333
$760,000
$791,833
$655,000
$815,000
$802,500
$717,500
$685,000
$532,643
-
Chelsea Gardens
N/A
Median Price
Past 12 months
Past 12 months
$870,000
$998,750
$1,070,000
$929,500
$952,500
-
$795,000
$1,162,500
$1,387,500
$1,085,000
$940,000
$835,000
$675,000
$760,000
$807,500
$655,000
$815,000
$802,500
$717,500
$685,000
$515,000
-
Chelsea Gardens
N/A
Avg. Price / ft2
Past 12 months
Past 12 months
-
-
-
-
-
-
-
-
-
-
-
-
$750
-
-
$882
-
-
-
-
$925
$370
Chelsea Gardens
$1,250,000
Avg. Price
Past 12 months
Past 12 months
-
-
-
-
-
-
$1,260,000
$1,535,000
$1,591,000
-
-
$1,150,000
$900,000
-
-
$882,000
-
$1,100,000
-
$800,000
$925,000
$499,850
Chelsea Gardens
$1,250,000
Median Price
Past 12 months
Past 12 months
-
-
-
-
-
-
$1,260,000
$1,535,000
$1,591,000
-
-
$1,150,000
$900,000
-
-
$882,000
-
$1,100,000
-
$800,000
$925,000
$499,850
Chelsea Gardens
N/A
Avg. Price / ft2
Past 12 months
Past 12 months
-
-
-
-
-
-
-
-
-
-
-
-
-
-
-
-
-
-
-
-
-
-
Chelsea Gardens
N/A
Avg. Price
Past 12 months
Past 12 months
-
-
-
-
-
-
-
-
-
-
-
-
-
-
-
-
-
-
-
-
-
-
Chelsea Gardens
N/A
Median Price
Past 12 months
Past 12 months
-
-
-
-
-
-
-
-
-
-
-
-
-
-
-
-
-
-
-
-
-
-
Chelsea Gardens
N/A
Avg. Price / ft2
Past 12 months
Past 12 months
-
-
-
-
-
-
-
-
-
-
-
-
-
-
-
-
-
-
-
-
-
-
Chelsea Gardens
N/A
Avg. Price
Past 12 months
Past 12 months
-
-
-
-
-
-
-
-
-
-
-
-
-
-
-
-
-
-
-
-
-
-
Chelsea Gardens
N/A
Median Price
Past 12 months
Past 12 months
-
-
-
-
-
-
-
-
-
-
-
-
-
-
-
-
-
-
-
-
-
-
17 West 17th Street
N/A
Avg. Price / ft2
Past 12 months
Past 12 months
-
-
-
$1,130
-
-
-
-
-
$1,402
$1,652
-
$1,450
-
-
-
-
-
-
-
-
-
17 West 17th Street
N/A
Avg. Price
Past 12 months
Past 12 months
-
-
-
$5,200,000
-
-
-
-
-
$6,450,000
$7,600,000
-
$5,800,000
-
-
-
-
-
-
-
-
-
17 West 17th Street
N/A
Median Price
Past 12 months
Past 12 months
-
-
-
$5,200,000
-
-
-
-
-
$6,450,000
$7,600,000
-
$5,800,000
-
-
-
-
-
-
-
-
-
17 West 17th Street
N/A
Avg. Price / ft2
Past 12 months
Past 12 months
-
-
-
-
-
-
-
-
-
-
-
-
-
-
-
-
-
-
-
-
-
-
17 West 17th Street
N/A
Avg. Price
Past 12 months
Past 12 months
-
-
-
-
-
-
-
-
-
-
-
-
-
-
-
-
-
-
-
-
-
-
17 West 17th Street
N/A
Median Price
Past 12 months
Past 12 months
-
-
-
-
-
-
-
-
-
-
-
-
-
-
-
-
-
-
-
-
-
-
17 West 17th Street
N/A
Avg. Price / ft2
Past 12 months
Past 12 months
-
-
-
-
-
-
-
-
-
-
$1,652
-
$1,450
-
-
-
-
-
-
-
-
-
17 West 17th Street
N/A
Avg. Price
Past 12 months
Past 12 months
-
-
-
-
-
-
-
-
-
-
$7,600,000
-
$5,800,000
-
-
-
-
-
-
-
-
-
17 West 17th Street
N/A
Median Price
Past 12 months
Past 12 months
-
-
-
-
-
-
-
-
-
-
$7,600,000
-
$5,800,000
-
-
-
-
-
-
-
-
-
17 West 17th Street
N/A
Avg. Price / ft2
Past 12 months
Past 12 months
-
-
-
$1,130
-
-
-
-
-
$1,402
-
-
-
-
-
-
-
-
-
-
-
-
17 West 17th Street
N/A
Avg. Price
Past 12 months
Past 12 months
-
-
-
$5,200,000
-
-
-
-
-
$6,450,000
-
-
-
-
-
-
-
-
-
-
-
-
17 West 17th Street
N/A
Median Price
Past 12 months
Past 12 months
-
-
-
$5,200,000
-
-
-
-
-
$6,450,000
-
-
-
-
-
-
-
-
-
-
-
-
121 West 17th Street
N/A
Avg. Price / ft2
Past 12 months
Past 12 months
-
-
-
$1,212
-
-
-
-
-
$1,342
-
$1,123
$1,180
-
$931
-
-
-
$1,055
$1,031
-
-
121 West 17th Street
N/A
Avg. Price
Past 12 months
Past 12 months
-
$1,535,000
-
$1,575,000
-
-
$1,625,000
-
-
$1,510,000
-
$1,287,889
$1,180,000
-
$1,210,000
-
-
-
$1,309,200
$1,650,000
-
-
121 West 17th Street
N/A
Median Price
Past 12 months
Past 12 months
-
$1,535,000
-
$1,575,000
-
-
$1,625,000
-
-
$1,510,000
-
$1,287,889
$1,180,000
-
$1,210,000
-
-
-
$1,309,200
$1,650,000
-
-
121 West 17th Street
N/A
Avg. Price / ft2
Past 12 months
Past 12 months
-
-
-
-
-
-
-
-
-
-
-
-
-
-
-
-
-
-
-
-
-
-
121 West 17th Street
N/A
Avg. Price
Past 12 months
Past 12 months
-
-
-
-
-
-
-
-
-
-
-
-
-
-
-
-
-
-
-
-
-
-
121 West 17th Street
N/A
Median Price
Past 12 months
Past 12 months
-
-
-
-
-
-
-
-
-
-
-
-
-
-
-
-
-
-
-
-
-
-
121 West 17th Street
N/A
Avg. Price / ft2
Past 12 months
Past 12 months
-
-
-
$1,212
-
-
-
-
-
$1,342
-
$1,123
$1,180
-
$931
-
-
-
$1,265
-
-
-
121 West 17th Street
N/A
Avg. Price
Past 12 months
Past 12 months
-
-
-
$1,575,000
-
-
$1,625,000
-
-
$1,510,000
-
$1,287,889
$1,180,000
-
$1,210,000
-
-
-
$1,265,000
-
-
-
121 West 17th Street
N/A
Median Price
Past 12 months
Past 12 months
-
-
-
$1,575,000
-
-
$1,625,000
-
-
$1,510,000
-
$1,287,889
$1,180,000
-
$1,210,000
-
-
-
$1,265,000
-
-
-
121 West 17th Street
N/A
Avg. Price / ft2
Past 12 months
Past 12 months
-
-
-
-
-
-
-
-
-
-
-
-
-
-
-
-
-
-
$846
$1,031
-
-
121 West 17th Street
N/A
Avg. Price
Past 12 months
Past 12 months
-
-
-
-
-
-
-
-
-
-
-
-
-
-
-
-
-
-
$1,353,400
$1,650,000
-
-
121 West 17th Street
N/A
Median Price
Past 12 months
Past 12 months
-
-
-
-
-
-
-
-
-
-
-
-
-
-
-
-
-
-
$1,353,400
$1,650,000
-
-
121 West 17th Street
N/A
Avg. Price / ft2
Past 12 months
Past 12 months
-
-
-
-
-
-
-
-
-
-
-
-
-
-
-
-
-
-
-
-
-
-
121 West 17th Street
N/A
Avg. Price
Past 12 months
Past 12 months
-
$1,535,000
-
-
-
-
-
-
-
-
-
-
-
-
-
-
-
-
-
-
-
-
121 West 17th Street
N/A
Median Price
Past 12 months
Past 12 months
-
$1,535,000
-
-
-
-
-
-
-
-
-
-
-
-
-
-
-
-
-
-
-
-
121 West 17th Street
N/A
Avg. Price / ft2
Past 12 months
Past 12 months
-
-
-
-
-
-
-
-
-
-
-
-
-
-
-
-
-
-
-
-
-
-
121 West 17th Street
N/A
Avg. Price
Past 12 months
Past 12 months
-
-
-
-
-
-
-
-
-
-
-
-
-
-
-
-
-
-
-
-
-
-
121 West 17th Street
N/A
Median Price
Past 12 months
Past 12 months
-
-
-
-
-
-
-
-
-
-
-
-
-
-
-
-
-
-
-
-
-
-
121 West 17th Street
N/A
Avg. Price / ft2
Past 12 months
Past 12 months
-
-
-
-
-
-
-
-
-
-
-
-
-
-
-
-
-
-
-
-
-
-
121 West 17th Street
N/A
Avg. Price
Past 12 months
Past 12 months
-
-
-
-
-
-
-
-
-
-
-
-
-
-
-
-
-
-
-
-
-
-
121 West 17th Street
N/A
Median Price
Past 12 months
Past 12 months
-
-
-
-
-
-
-
-
-
-
-
-
-
-
-
-
-
-
-
-
-
-


