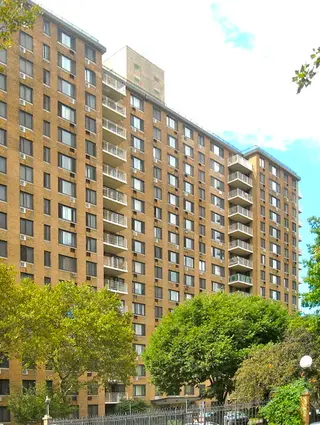
Willoughby Walk, 195 Willoughby Avenue: Price Comparison
between Ryerson Avenue & Grand Street Building Profile
Willoughby Walk
$503,167
Avg. Price
Past 12 months
Past 12 months
2024
$999,000
2023
-
2022
$540,429
2021
$525,600
2020
$482,500
2019
$503,500
2018
$392,000
2017
$455,167
2016
$485,722
2015
$470,000
2014
$423,929
2013
$325,000
2012
-
2011
-
2010
-
2009
$229,250
2008
$360,269
2007
$351,400
2006
$327,250
2005
$250,875
2004
$138,333
2003
$192,800
Willoughby Walk
$512,000
Median Price
Past 12 months
Past 12 months
2024
$999,000
2023
-
2022
$510,000
2021
$488,000
2020
$297,500
2019
$450,000
2018
$392,000
2017
$440,000
2016
$485,000
2015
$420,000
2014
$362,000
2013
$325,000
2012
-
2011
-
2010
-
2009
$226,500
2008
$422,500
2007
$300,000
2006
$287,500
2005
$225,000
2004
$128,500
2003
$196,500
Willoughby Walk
N/A
Avg. Price
Past 12 months
Past 12 months
2024
-
2023
-
2022
$344,000
2021
$305,000
2020
$286,250
2019
$291,667
2018
$299,000
2017
$300,000
2016
$273,500
2015
$240,000
2014
$226,625
2013
-
2012
-
2011
-
2010
-
2009
$165,000
2008
$205,808
2007
$205,100
2006
$199,000
2005
$185,167
2004
$106,750
2003
-
Willoughby Walk
N/A
Median Price
Past 12 months
Past 12 months
2024
-
2023
-
2022
$344,000
2021
$305,000
2020
$286,250
2019
$295,000
2018
$299,000
2017
$300,000
2016
$273,500
2015
$240,000
2014
$226,625
2013
-
2012
-
2011
-
2010
-
2009
$165,000
2008
$205,808
2007
$205,100
2006
$199,000
2005
$188,000
2004
$106,750
2003
-
Willoughby Walk
$536,000
Avg. Price
Past 12 months
Past 12 months
2024
-
2023
-
2022
$563,750
2021
$507,667
2020
-
2019
$600,500
2018
$485,000
2017
$532,750
2016
$456,125
2015
$420,000
2014
$367,500
2013
$325,000
2012
-
2011
-
2010
-
2009
$284,500
2008
-
2007
$284,700
2006
$287,500
2005
$230,000
2004
$154,125
2003
$122,500
Willoughby Walk
$527,000
Median Price
Past 12 months
Past 12 months
2024
-
2023
-
2022
$525,000
2021
$488,000
2020
-
2019
$600,500
2018
$485,000
2017
$532,750
2016
$464,750
2015
$420,000
2014
$352,500
2013
$325,000
2012
-
2011
-
2010
-
2009
$284,500
2008
-
2007
$295,000
2006
$287,500
2005
$215,000
2004
$160,000
2003
$122,500
Willoughby Walk
N/A
Avg. Price
Past 12 months
Past 12 months
2024
$999,000
2023
-
2022
$840,000
2021
$800,000
2020
$875,000
2019
$945,000
2018
-
2017
-
2016
$666,667
2015
$750,000
2014
$399,633
2013
-
2012
-
2011
-
2010
-
2009
-
2008
$438,333
2007
$427,500
2006
-
2005
$358,333
2004
-
2003
$235,500
Willoughby Walk
N/A
Median Price
Past 12 months
Past 12 months
2024
$999,000
2023
-
2022
$840,000
2021
$800,000
2020
$875,000
2019
$945,000
2018
-
2017
-
2016
$700,000
2015
$750,000
2014
$359,000
2013
-
2012
-
2011
-
2010
-
2009
-
2008
$440,000
2007
$427,500
2006
-
2005
$380,000
2004
-
2003
$235,500
Willoughby Walk
N/A
Avg. Price
Past 12 months
Past 12 months
2024
-
2023
-
2022
-
2021
-
2020
-
2019
-
2018
-
2017
-
2016
-
2015
-
2014
$655,000
2013
-
2012
-
2011
-
2010
-
2009
-
2008
-
2007
$542,500
2006
$535,000
2005
-
2004
-
2003
-
Willoughby Walk
N/A
Median Price
Past 12 months
Past 12 months
2024
-
2023
-
2022
-
2021
-
2020
-
2019
-
2018
-
2017
-
2016
-
2015
-
2014
$665,000
2013
-
2012
-
2011
-
2010
-
2009
-
2008
-
2007
$542,500
2006
$535,000
2005
-
2004
-
2003
-
Willoughby Walk
N/A
Avg. Price
Past 12 months
Past 12 months
2024
-
2023
-
2022
-
2021
-
2020
-
2019
-
2018
-
2017
-
2016
-
2015
-
2014
-
2013
-
2012
-
2011
-
2010
-
2009
-
2008
-
2007
-
2006
-
2005
-
2004
-
2003
-
Willoughby Walk
N/A
Median Price
Past 12 months
Past 12 months
2024
-
2023
-
2022
-
2021
-
2020
-
2019
-
2018
-
2017
-
2016
-
2015
-
2014
-
2013
-
2012
-
2011
-
2010
-
2009
-
2008
-
2007
-
2006
-
2005
-
2004
-
2003
-
Willoughby Walk
N/A
Avg. Price
Past 12 months
Past 12 months
2024
-
2023
-
2022
-
2021
-
2020
-
2019
-
2018
-
2017
-
2016
-
2015
-
2014
-
2013
-
2012
-
2011
-
2010
-
2009
-
2008
-
2007
-
2006
-
2005
-
2004
-
2003
-
Willoughby Walk
N/A
Median Price
Past 12 months
Past 12 months
2024
-
2023
-
2022
-
2021
-
2020
-
2019
-
2018
-
2017
-
2016
-
2015
-
2014
-
2013
-
2012
-
2011
-
2010
-
2009
-
2008
-
2007
-
2006
-
2005
-
2004
-
2003
-
Copper House
N/A
Avg. Price / ft2
Past 12 months
Past 12 months
-
-
-
$1,040
-
-
-
-
$841
-
-
-
-
-
-
-
-
-
-
-
-
-
Copper House
N/A
Avg. Price
Past 12 months
Past 12 months
-
-
-
$1,725,000
-
-
-
-
$1,263,695
-
-
-
-
-
-
-
-
-
-
-
-
-
Copper House
N/A
Median Price
Past 12 months
Past 12 months
-
-
-
$1,725,000
-
-
-
-
$1,333,908
-
-
-
-
-
-
-
-
-
-
-
-
-
Copper House
N/A
Avg. Price / ft2
Past 12 months
Past 12 months
-
-
-
-
-
-
-
-
-
-
-
-
-
-
-
-
-
-
-
-
-
-
Copper House
N/A
Avg. Price
Past 12 months
Past 12 months
-
-
-
-
-
-
-
-
-
-
-
-
-
-
-
-
-
-
-
-
-
-
Copper House
N/A
Median Price
Past 12 months
Past 12 months
-
-
-
-
-
-
-
-
-
-
-
-
-
-
-
-
-
-
-
-
-
-
Copper House
N/A
Avg. Price / ft2
Past 12 months
Past 12 months
-
-
-
-
-
-
-
-
$819
-
-
-
-
-
-
-
-
-
-
-
-
-
Copper House
N/A
Avg. Price
Past 12 months
Past 12 months
-
-
-
-
-
-
-
-
$1,162,403
-
-
-
-
-
-
-
-
-
-
-
-
-
Copper House
N/A
Median Price
Past 12 months
Past 12 months
-
-
-
-
-
-
-
-
$1,153,169
-
-
-
-
-
-
-
-
-
-
-
-
-
Copper House
N/A
Avg. Price / ft2
Past 12 months
Past 12 months
-
-
-
$1,040
-
-
-
-
$884
-
-
-
-
-
-
-
-
-
-
-
-
-
Copper House
N/A
Avg. Price
Past 12 months
Past 12 months
-
-
-
$1,725,000
-
-
-
-
$1,466,281
-
-
-
-
-
-
-
-
-
-
-
-
-
Copper House
N/A
Median Price
Past 12 months
Past 12 months
-
-
-
$1,725,000
-
-
-
-
$1,466,281
-
-
-
-
-
-
-
-
-
-
-
-
-
Copper House
N/A
Avg. Price / ft2
Past 12 months
Past 12 months
-
-
-
-
-
-
-
-
-
-
-
-
-
-
-
-
-
-
-
-
-
-
Copper House
N/A
Avg. Price
Past 12 months
Past 12 months
-
-
-
-
-
-
-
-
-
-
-
-
-
-
-
-
-
-
-
-
-
-
Copper House
N/A
Median Price
Past 12 months
Past 12 months
-
-
-
-
-
-
-
-
-
-
-
-
-
-
-
-
-
-
-
-
-
-
Copper House
N/A
Avg. Price / ft2
Past 12 months
Past 12 months
-
-
-
-
-
-
-
-
-
-
-
-
-
-
-
-
-
-
-
-
-
-
Copper House
N/A
Avg. Price
Past 12 months
Past 12 months
-
-
-
-
-
-
-
-
-
-
-
-
-
-
-
-
-
-
-
-
-
-
Copper House
N/A
Median Price
Past 12 months
Past 12 months
-
-
-
-
-
-
-
-
-
-
-
-
-
-
-
-
-
-
-
-
-
-
Clinton Hill Coops
N/A
Avg. Price / ft2
Past 12 months
Past 12 months
$956
$932
$1,041
$874
-
$842
$889
$794
$705
$705
$563
-
-
-
-
-
$395
$451
$412
$349
$217
$207
Clinton Hill Coops
N/A
Avg. Price
Past 12 months
Past 12 months
$847,500
$875,500
$823,333
$699,000
-
$705,800
$764,667
$635,000
$529,271
$574,400
$488,455
-
-
-
-
$365,417
$312,800
$372,857
$347,296
$294,250
$201,320
$161,817
Clinton Hill Coops
N/A
Median Price
Past 12 months
Past 12 months
$847,500
$875,500
$860,000
$699,000
-
$660,000
$699,000
$635,000
$544,063
$550,000
$485,000
-
-
-
-
$335,000
$358,000
$365,000
$360,000
$297,500
$192,650
$166,450
Clinton Hill Coops
N/A
Avg. Price / ft2
Past 12 months
Past 12 months
-
-
-
-
-
-
-
-
-
-
-
-
-
-
-
-
-
-
-
-
-
-
Clinton Hill Coops
N/A
Avg. Price
Past 12 months
Past 12 months
-
-
-
-
-
-
-
-
-
-
$350,000
-
-
-
-
-
-
-
-
-
-
-
Clinton Hill Coops
N/A
Median Price
Past 12 months
Past 12 months
-
-
-
-
-
-
-
-
-
-
$350,000
-
-
-
-
-
-
-
-
-
-
-
Clinton Hill Coops
N/A
Avg. Price / ft2
Past 12 months
Past 12 months
$994
-
$1,102
-
-
$849
$879
-
$705
$699
$587
-
-
-
-
-
$395
$394
$403
$379
$225
$207
Clinton Hill Coops
N/A
Avg. Price
Past 12 months
Past 12 months
$795,000
-
$867,500
-
-
$676,667
$692,000
-
$529,271
$575,000
$469,000
-
-
-
-
$321,250
$298,500
$371,000
$340,000
$307,333
$180,050
$166,250
Clinton Hill Coops
N/A
Median Price
Past 12 months
Past 12 months
$795,000
-
$867,500
-
-
$660,000
$692,000
-
$544,063
$575,000
$467,000
-
-
-
-
$321,250
$324,000
$355,000
$340,000
$300,000
$192,650
$168,000
Clinton Hill Coops
N/A
Avg. Price / ft2
Past 12 months
Past 12 months
$918
$932
$919
$874
-
$831
$910
$794
-
$709
$539
-
-
-
-
-
-
$507
$430
$334
$209
$207
Clinton Hill Coops
N/A
Avg. Price
Past 12 months
Past 12 months
$900,000
$875,500
$735,000
$699,000
-
$749,500
$910,000
$635,000
-
$574,000
$552,250
-
-
-
-
$405,000
$370,000
$380,000
$439,500
$297,500
$188,000
$165,900
Clinton Hill Coops
N/A
Median Price
Past 12 months
Past 12 months
$900,000
$875,500
$735,000
$699,000
-
$749,500
$910,000
$635,000
-
$550,000
$572,500
-
-
-
-
$415,000
$370,000
$380,000
$439,500
$297,500
$188,000
$165,900
Clinton Hill Coops
N/A
Avg. Price / ft2
Past 12 months
Past 12 months
-
-
-
-
-
-
-
-
-
-
-
-
-
-
-
-
-
-
-
-
-
-
Clinton Hill Coops
N/A
Avg. Price
Past 12 months
Past 12 months
-
-
-
-
-
-
-
-
-
-
-
-
-
-
-
-
-
-
-
-
-
-
Clinton Hill Coops
N/A
Median Price
Past 12 months
Past 12 months
-
-
-
-
-
-
-
-
-
-
-
-
-
-
-
-
-
-
-
-
-
-
Clinton Hill Coops
N/A
Avg. Price / ft2
Past 12 months
Past 12 months
-
-
-
-
-
-
-
-
-
-
-
-
-
-
-
-
-
-
-
-
-
-
Clinton Hill Coops
N/A
Avg. Price
Past 12 months
Past 12 months
-
-
-
-
-
-
-
-
-
-
-
-
-
-
-
-
-
-
-
-
-
-
Clinton Hill Coops
N/A
Median Price
Past 12 months
Past 12 months
-
-
-
-
-
-
-
-
-
-
-
-
-
-
-
-
-
-
-
-
-
-
Clinton Hill Cooperatives
N/A
Avg. Price / ft2
Past 12 months
Past 12 months
$1,200
-
-
-
$988
-
-
$833
-
-
-
-
-
$662
-
$692
-
-
$559
-
-
-
Clinton Hill Cooperatives
N/A
Avg. Price
Past 12 months
Past 12 months
$1,195,000
-
-
-
$1,185,000
-
-
$999,000
-
-
-
-
-
$645,000
-
$830,126
-
-
$545,000
-
-
-
Clinton Hill Cooperatives
N/A
Median Price
Past 12 months
Past 12 months
$1,195,000
-
-
-
$1,185,000
-
-
$999,000
-
-
-
-
-
$645,000
-
$830,126
-
-
$545,000
-
-
-
Clinton Hill Cooperatives
N/A
Avg. Price / ft2
Past 12 months
Past 12 months
-
-
-
-
-
-
-
-
-
-
-
-
-
-
-
-
-
-
-
-
-
-
Clinton Hill Cooperatives
N/A
Avg. Price
Past 12 months
Past 12 months
-
-
-
-
-
-
-
-
-
-
-
-
-
-
-
-
-
-
-
-
-
-
Clinton Hill Cooperatives
N/A
Median Price
Past 12 months
Past 12 months
-
-
-
-
-
-
-
-
-
-
-
-
-
-
-
-
-
-
-
-
-
-
Clinton Hill Cooperatives
N/A
Avg. Price / ft2
Past 12 months
Past 12 months
-
-
-
-
$988
-
-
$833
-
-
-
-
-
-
-
$692
-
-
-
-
-
-
Clinton Hill Cooperatives
N/A
Avg. Price
Past 12 months
Past 12 months
-
-
-
-
$1,185,000
-
-
$999,000
-
-
-
-
-
-
-
$830,126
-
-
-
-
-
-
Clinton Hill Cooperatives
N/A
Median Price
Past 12 months
Past 12 months
-
-
-
-
$1,185,000
-
-
$999,000
-
-
-
-
-
-
-
$830,126
-
-
-
-
-
-
Clinton Hill Cooperatives
N/A
Avg. Price / ft2
Past 12 months
Past 12 months
$1,200
-
-
-
-
-
-
-
-
-
-
-
-
$662
-
-
-
-
$559
-
-
-
Clinton Hill Cooperatives
N/A
Avg. Price
Past 12 months
Past 12 months
$1,195,000
-
-
-
-
-
-
-
-
-
-
-
-
$645,000
-
-
-
-
$545,000
-
-
-
Clinton Hill Cooperatives
N/A
Median Price
Past 12 months
Past 12 months
$1,195,000
-
-
-
-
-
-
-
-
-
-
-
-
$645,000
-
-
-
-
$545,000
-
-
-
Clinton Hill Cooperatives
N/A
Avg. Price / ft2
Past 12 months
Past 12 months
-
-
-
-
-
-
-
-
-
-
-
-
-
-
-
-
-
-
-
-
-
-
Clinton Hill Cooperatives
N/A
Avg. Price
Past 12 months
Past 12 months
-
-
-
-
-
-
-
-
-
-
-
-
-
-
-
-
-
-
-
-
-
-
Clinton Hill Cooperatives
N/A
Median Price
Past 12 months
Past 12 months
-
-
-
-
-
-
-
-
-
-
-
-
-
-
-
-
-
-
-
-
-
-
Clinton Hill Cooperatives
N/A
Avg. Price / ft2
Past 12 months
Past 12 months
-
-
-
-
-
-
-
-
-
-
-
-
-
-
-
-
-
-
-
-
-
-
Clinton Hill Cooperatives
N/A
Avg. Price
Past 12 months
Past 12 months
-
-
-
-
-
-
-
-
-
-
-
-
-
-
-
-
-
-
-
-
-
-
Clinton Hill Cooperatives
N/A
Median Price
Past 12 months
Past 12 months
-
-
-
-
-
-
-
-
-
-
-
-
-
-
-
-
-
-
-
-
-
-
Clinton Hill Co-ops
$1,035
Avg. Price / ft2
Past 12 months
Past 12 months
$1,240
$929
$898
$818
$828
$829
$810
$831
$726
$677
$576
$546
$573
-
$580
$420
$462
$411
$391
$361
$274
$164
Clinton Hill Co-ops
$837,171
Avg. Price
Past 12 months
Past 12 months
$800,000
$746,194
$702,500
$661,556
$647,500
$650,374
$615,502
$634,171
$567,824
$538,736
$446,835
$469,502
$458,738
-
$435,000
$322,664
$334,156
$349,456
$312,676
$291,484
$213,663
$133,662
Clinton Hill Co-ops
$785,000
Median Price
Past 12 months
Past 12 months
$800,000
$725,000
$717,500
$670,000
$640,000
$635,000
$610,000
$647,500
$568,000
$526,000
$450,000
$451,870
$458,738
-
$435,000
$335,000
$335,000
$345,000
$305,000
$297,593
$222,000
$145,000
Clinton Hill Co-ops
N/A
Avg. Price / ft2
Past 12 months
Past 12 months
-
-
$704
-
-
-
-
-
-
-
-
-
-
-
-
$365
-
-
-
-
-
-
Clinton Hill Co-ops
N/A
Avg. Price
Past 12 months
Past 12 months
-
-
$405,000
-
-
-
-
-
-
-
-
-
-
-
-
$292,237
-
-
-
-
-
-
Clinton Hill Co-ops
N/A
Median Price
Past 12 months
Past 12 months
-
-
$405,000
-
-
-
-
-
-
-
-
-
-
-
-
$292,237
-
-
-
-
-
-
Clinton Hill Co-ops
$954
Avg. Price / ft2
Past 12 months
Past 12 months
$1,240
$950
$906
$832
$823
$841
$830
$851
$703
$661
$587
$570
$573
-
-
$433
$468
$398
$393
$363
$288
$161
Clinton Hill Co-ops
$717,288
Avg. Price
Past 12 months
Past 12 months
$800,000
$714,286
$686,500
$610,833
$608,750
$614,608
$626,086
$631,005
$531,566
$497,706
$440,284
$443,870
$458,738
-
-
$323,622
$340,192
$314,529
$298,893
$284,069
$219,633
$127,437
Clinton Hill Co-ops
$775,000
Median Price
Past 12 months
Past 12 months
$800,000
$725,000
$717,500
$630,000
$640,250
$625,500
$645,250
$642,500
$524,990
$514,425
$450,000
$443,870
$458,738
-
-
$337,000
$345,000
$325,250
$299,000
$289,000
$227,000
$135,000
Clinton Hill Co-ops
$1,128
Avg. Price / ft2
Past 12 months
Past 12 months
-
$858
$936
$791
$836
$810
$690
$731
$777
$696
$555
$534
-
-
$580
$335
$413
$427
$385
$357
$244
$191
Clinton Hill Co-ops
$872,875
Avg. Price
Past 12 months
Past 12 months
-
$857,875
$855,000
$763,000
$725,000
$707,600
$552,000
$650,000
$676,600
$593,442
$475,750
$482,319
-
-
$435,000
$328,333
$330,000
$399,800
$343,000
$315,454
$214,426
$154,475
Clinton Hill Co-ops
$830,750
Median Price
Past 12 months
Past 12 months
-
$857,875
$910,000
$760,000
$640,000
$718,000
$552,000
$650,000
$651,000
$545,278
$467,500
$475,500
-
-
$435,000
$335,000
$330,000
$390,000
$330,000
$307,000
$215,000
$153,950
Clinton Hill Co-ops
N/A
Avg. Price / ft2
Past 12 months
Past 12 months
-
-
-
-
-
-
-
-
-
-
-
-
-
-
-
-
-
-
-
-
-
-
Clinton Hill Co-ops
N/A
Avg. Price
Past 12 months
Past 12 months
-
-
-
-
-
-
-
-
-
-
-
-
-
-
-
-
-
-
-
-
-
-
Clinton Hill Co-ops
N/A
Median Price
Past 12 months
Past 12 months
-
-
-
-
-
-
-
-
-
-
-
-
-
-
-
-
-
-
-
-
-
-
Clinton Hill Co-ops
N/A
Avg. Price / ft2
Past 12 months
Past 12 months
-
-
-
-
-
-
-
-
-
-
-
-
-
-
-
-
-
-
-
-
-
-
Clinton Hill Co-ops
N/A
Avg. Price
Past 12 months
Past 12 months
-
-
-
-
-
-
-
-
-
-
-
-
-
-
-
-
-
-
-
-
-
-
Clinton Hill Co-ops
N/A
Median Price
Past 12 months
Past 12 months
-
-
-
-
-
-
-
-
-
-
-
-
-
-
-
-
-
-
-
-
-
-
Clinton Mews
$1,018
Avg. Price / ft2
Past 12 months
Past 12 months
-
$1,024
$910
$1,056
$960
$756
$845
$788
$807
$749
$864
$579
$509
$514
-
$372
$475
$504
$874
$461
$382
$308
Clinton Mews
$1,172,500
Avg. Price
Past 12 months
Past 12 months
-
$963,333
$914,883
$971,200
$752,500
$975,000
$742,750
$611,500
$789,167
$670,250
$832,500
$562,000
$480,000
$475,000
-
$404,586
$389,625
$507,232
$746,827
$410,496
$290,000
$299,000
Clinton Mews
$1,172,500
Median Price
Past 12 months
Past 12 months
-
$950,000
$885,000
$885,000
$752,500
$975,000
$730,000
$611,500
$815,000
$680,500
$832,500
$592,500
$515,000
$475,000
-
$404,586
$380,000
$503,900
$511,699
$399,000
$290,000
$299,000
Clinton Mews
N/A
Avg. Price / ft2
Past 12 months
Past 12 months
-
-
-
-
-
-
-
-
-
-
-
-
-
-
-
-
-
-
-
-
-
-
Clinton Mews
N/A
Avg. Price
Past 12 months
Past 12 months
-
-
-
-
-
-
-
-
-
-
-
-
-
-
-
-
-
-
-
-
-
-
Clinton Mews
N/A
Median Price
Past 12 months
Past 12 months
-
-
-
-
-
-
-
-
-
-
-
-
-
-
-
-
-
-
-
-
-
-
Clinton Mews
$1,018
Avg. Price / ft2
Past 12 months
Past 12 months
-
$1,023
$1,022
$1,126
$787
-
$845
$788
$813
$726
$905
$561
$523
$514
-
$372
$475
$444
$970
$507
$382
$308
Clinton Mews
$1,070,000
Avg. Price
Past 12 months
Past 12 months
-
$970,000
$930,000
$995,500
$655,000
-
$742,750
$611,500
$761,786
$611,000
$815,000
$446,000
$400,000
$475,000
-
$404,586
$389,625
$494,896
$838,946
$393,976
$290,000
$299,000
Clinton Mews
$1,070,000
Median Price
Past 12 months
Past 12 months
-
$970,000
$930,000
$890,000
$655,000
-
$730,000
$611,500
$745,000
$611,000
$815,000
$446,000
$400,000
$475,000
-
$404,586
$380,000
$515,000
$475,000
$399,000
$290,000
$299,000
Clinton Mews
N/A
Avg. Price / ft2
Past 12 months
Past 12 months
-
$1,027
$686
$776
$1,133
$756
-
-
$786
$772
$824
$589
$502
-
-
-
-
$549
$540
$415
-
-
Clinton Mews
$1,275,000
Avg. Price
Past 12 months
Past 12 months
-
$950,000
$884,650
$874,000
$850,000
$975,000
-
-
$885,000
$729,500
$850,000
$620,000
$520,000
-
-
-
-
$549,542
$573,533
$431,147
-
-
Clinton Mews
$1,275,000
Median Price
Past 12 months
Past 12 months
-
$950,000
$884,650
$874,000
$850,000
$975,000
-
-
$885,000
$729,500
$850,000
$622,500
$520,000
-
-
-
-
$552,130
$541,689
$437,294
-
-
Clinton Mews
N/A
Avg. Price / ft2
Past 12 months
Past 12 months
-
-
-
-
-
-
-
-
-
-
-
-
-
-
-
-
-
-
-
-
-
-
Clinton Mews
N/A
Avg. Price
Past 12 months
Past 12 months
-
-
-
-
-
-
-
-
-
-
-
-
-
-
-
-
-
-
-
-
-
-
Clinton Mews
N/A
Median Price
Past 12 months
Past 12 months
-
-
-
-
-
-
-
-
-
-
-
-
-
-
-
-
-
-
-
-
-
-
Clinton Mews
N/A
Avg. Price / ft2
Past 12 months
Past 12 months
-
-
-
-
-
-
-
-
-
-
-
-
-
-
-
-
-
-
-
-
-
-
Clinton Mews
N/A
Avg. Price
Past 12 months
Past 12 months
-
-
-
-
-
-
-
-
-
-
-
-
-
-
-
-
-
-
-
-
-
-
Clinton Mews
N/A
Median Price
Past 12 months
Past 12 months
-
-
-
-
-
-
-
-
-
-
-
-
-
-
-
-
-
-
-
-
-
-
Clinton Hill Coops II
$894
Avg. Price / ft2
Past 12 months
Past 12 months
-
-
$848
-
$693
$723
-
$710
$752
$635
$580
-
-
-
-
-
$447
-
-
$355
$308
$198
Clinton Hill Coops II
$715,000
Avg. Price
Past 12 months
Past 12 months
-
-
$715,500
-
$520,000
$550,000
-
$550,000
$521,250
$541,667
$491,875
-
-
-
-
$269,000
$335,000
-
$272,333
$308,750
$206,250
$147,000
Clinton Hill Coops II
$715,000
Median Price
Past 12 months
Past 12 months
-
-
$715,500
-
$520,000
$555,000
-
$550,000
$497,500
$470,000
$496,250
-
-
-
-
$269,000
$335,000
-
$247,000
$315,000
$225,000
$148,000
Clinton Hill Coops II
N/A
Avg. Price / ft2
Past 12 months
Past 12 months
-
-
-
-
-
-
-
-
-
-
-
-
-
-
-
-
-
-
-
-
-
-
Clinton Hill Coops II
N/A
Avg. Price
Past 12 months
Past 12 months
-
-
-
-
-
-
-
-
-
-
-
-
-
-
-
-
-
-
-
-
-
-
Clinton Hill Coops II
N/A
Median Price
Past 12 months
Past 12 months
-
-
-
-
-
-
-
-
-
-
-
-
-
-
-
-
-
-
-
-
-
-
Clinton Hill Coops II
$894
Avg. Price / ft2
Past 12 months
Past 12 months
-
-
$935
-
$693
$723
-
$710
$752
$627
$565
-
-
-
-
-
$447
-
-
$371
$308
$198
Clinton Hill Coops II
$715,000
Avg. Price
Past 12 months
Past 12 months
-
-
$701,000
-
$520,000
$550,000
-
$550,000
$521,250
$470,000
$408,000
-
-
-
-
-
$335,000
-
$247,000
$272,500
$187,500
$147,000
Clinton Hill Coops II
$715,000
Median Price
Past 12 months
Past 12 months
-
-
$701,000
-
$520,000
$555,000
-
$550,000
$497,500
$470,000
$408,000
-
-
-
-
-
$335,000
-
$247,000
$272,500
$187,500
$148,000
Clinton Hill Coops II
N/A
Avg. Price / ft2
Past 12 months
Past 12 months
-
-
$760
-
-
-
-
-
-
$652
$596
-
-
-
-
-
-
-
-
$324
-
-
Clinton Hill Coops II
N/A
Avg. Price
Past 12 months
Past 12 months
-
-
$730,000
-
-
-
-
-
-
$685,000
$575,750
-
-
-
-
-
-
-
-
$345,000
-
-
Clinton Hill Coops II
N/A
Median Price
Past 12 months
Past 12 months
-
-
$730,000
-
-
-
-
-
-
$685,000
$575,750
-
-
-
-
-
-
-
-
$345,000
-
-
Clinton Hill Coops II
N/A
Avg. Price / ft2
Past 12 months
Past 12 months
-
-
-
-
-
-
-
-
-
-
-
-
-
-
-
-
-
-
-
-
-
-
Clinton Hill Coops II
N/A
Avg. Price
Past 12 months
Past 12 months
-
-
-
-
-
-
-
-
-
-
-
-
-
-
-
-
-
-
-
-
-
-
Clinton Hill Coops II
N/A
Median Price
Past 12 months
Past 12 months
-
-
-
-
-
-
-
-
-
-
-
-
-
-
-
-
-
-
-
-
-
-
Clinton Hill Coops II
N/A
Avg. Price / ft2
Past 12 months
Past 12 months
-
-
-
-
-
-
-
-
-
-
-
-
-
-
-
-
-
-
-
-
-
-
Clinton Hill Coops II
N/A
Avg. Price
Past 12 months
Past 12 months
-
-
-
-
-
-
-
-
-
-
-
-
-
-
-
-
-
-
-
-
-
-
Clinton Hill Coops II
N/A
Median Price
Past 12 months
Past 12 months
-
-
-
-
-
-
-
-
-
-
-
-
-
-
-
-
-
-
-
-
-
-