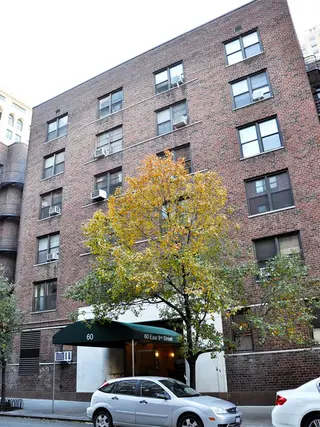
The Hamilton, 60 East 9th Street: Price Comparison
between Broadway & University Place Building Profile
The Hamilton
$728,938
Avg. Price
Past 12 months
Past 12 months
2024
$932,000
2023
$677,250
2022
$635,929
2021
$805,167
2020
$638,071
2019
$697,222
2018
$641,800
2017
$896,822
2016
$946,701
2015
$810,594
2014
$930,625
2013
$546,939
2012
$574,538
2011
$660,667
2010
$683,239
2009
$513,750
2008
$543,875
2007
$459,800
2006
$494,657
2005
$493,749
2004
$351,357
2003
$331,143
The Hamilton
$561,750
Median Price
Past 12 months
Past 12 months
2024
$835,000
2023
$737,500
2022
$542,000
2021
$814,500
2020
$489,000
2019
$785,000
2018
$540,000
2017
$805,000
2016
$857,500
2015
$807,005
2014
$745,000
2013
$415,000
2012
$569,000
2011
$702,500
2010
$645,000
2009
$477,500
2008
$485,000
2007
$396,000
2006
$420,000
2005
$474,998
2004
$330,000
2003
$360,000
The Hamilton
$728,300
Avg. Price
Past 12 months
Past 12 months
2024
$515,000
2023
$473,750
2022
$481,000
2021
$540,000
2020
$464,667
2019
$588,333
2018
$480,600
2017
-
2016
$472,500
2015
$427,500
2014
$891,667
2013
$365,583
2012
$367,500
2011
$435,000
2010
-
2009
$422,500
2008
$403,750
2007
$424,000
2006
$391,400
2005
$369,998
2004
$222,500
2003
$231,833
The Hamilton
$548,500
Median Price
Past 12 months
Past 12 months
2024
$515,000
2023
$482,500
2022
$515,000
2021
$540,000
2020
$475,000
2019
$425,000
2018
$492,000
2017
-
2016
$472,500
2015
$407,500
2014
$785,000
2013
$378,667
2012
$370,000
2011
$435,000
2010
-
2009
$422,500
2008
$410,000
2007
$350,000
2006
$412,800
2005
$369,998
2004
$222,500
2003
$242,500
The Hamilton
$730,000
Avg. Price
Past 12 months
Past 12 months
2024
$792,500
2023
$757,000
2022
$765,333
2021
$764,667
2020
$768,125
2019
$751,667
2018
$806,667
2017
$805,000
2016
$873,500
2015
$773,500
2014
$632,500
2013
$638,800
2012
$594,143
2011
$705,800
2010
$640,000
2009
$605,000
2008
$684,000
2007
$543,333
2006
$547,500
2005
$617,500
2004
$352,400
2003
$377,500
The Hamilton
$650,000
Median Price
Past 12 months
Past 12 months
2024
$792,500
2023
$780,000
2022
$705,000
2021
$799,000
2020
$850,000
2019
$805,000
2018
$900,000
2017
$805,000
2016
$857,500
2015
$723,000
2014
$632,500
2013
$645,000
2012
$605,000
2011
$730,000
2010
$640,000
2009
$605,000
2008
$690,500
2007
$545,000
2006
$547,500
2005
$617,500
2004
$330,000
2003
$365,000
The Hamilton
N/A
Avg. Price
Past 12 months
Past 12 months
2024
$1,280,000
2023
$845,000
2022
$712,500
2021
$998,500
2020
-
2019
-
2018
$797,500
2017
$942,733
2016
$1,153,568
2015
$856,243
2014
$1,168,333
2013
$970,000
2012
$870,000
2011
-
2010
$769,716
2009
-
2008
-
2007
-
2006
$802,000
2005
-
2004
$475,000
2003
$490,000
The Hamilton
N/A
Median Price
Past 12 months
Past 12 months
2024
$1,280,000
2023
$845,000
2022
$712,500
2021
$998,500
2020
-
2019
-
2018
$797,500
2017
$895,000
2016
$1,285,703
2015
$819,691
2014
$1,200,000
2013
$970,000
2012
$870,000
2011
-
2010
$769,716
2009
-
2008
-
2007
-
2006
$802,000
2005
-
2004
$475,000
2003
$490,000
The Hamilton
N/A
Avg. Price
Past 12 months
Past 12 months
2024
-
2023
-
2022
-
2021
-
2020
-
2019
-
2018
-
2017
-
2016
-
2015
$1,900,000
2014
-
2013
-
2012
-
2011
-
2010
-
2009
-
2008
-
2007
-
2006
-
2005
-
2004
-
2003
-
The Hamilton
N/A
Median Price
Past 12 months
Past 12 months
2024
-
2023
-
2022
-
2021
-
2020
-
2019
-
2018
-
2017
-
2016
-
2015
$1,900,000
2014
-
2013
-
2012
-
2011
-
2010
-
2009
-
2008
-
2007
-
2006
-
2005
-
2004
-
2003
-
The Hamilton
N/A
Avg. Price
Past 12 months
Past 12 months
2024
-
2023
-
2022
-
2021
-
2020
-
2019
-
2018
-
2017
-
2016
-
2015
-
2014
-
2013
-
2012
-
2011
-
2010
-
2009
-
2008
-
2007
-
2006
-
2005
-
2004
-
2003
-
The Hamilton
N/A
Median Price
Past 12 months
Past 12 months
2024
-
2023
-
2022
-
2021
-
2020
-
2019
-
2018
-
2017
-
2016
-
2015
-
2014
-
2013
-
2012
-
2011
-
2010
-
2009
-
2008
-
2007
-
2006
-
2005
-
2004
-
2003
-
The Hamilton
N/A
Avg. Price
Past 12 months
Past 12 months
2024
-
2023
-
2022
-
2021
-
2020
-
2019
-
2018
-
2017
-
2016
-
2015
-
2014
-
2013
-
2012
-
2011
-
2010
-
2009
-
2008
-
2007
-
2006
-
2005
-
2004
-
2003
-
The Hamilton
N/A
Median Price
Past 12 months
Past 12 months
2024
-
2023
-
2022
-
2021
-
2020
-
2019
-
2018
-
2017
-
2016
-
2015
-
2014
-
2013
-
2012
-
2011
-
2010
-
2009
-
2008
-
2007
-
2006
-
2005
-
2004
-
2003
-
644 Broadway
N/A
Avg. Price / ft2
Past 12 months
Past 12 months
-
-
$1,188
$1,369
$1,022
-
-
-
$1,196
-
$1,425
$1,018
-
-
-
$1,015
-
$771
-
$870
$761
-
644 Broadway
N/A
Avg. Price
Past 12 months
Past 12 months
-
-
$3,450,000
$3,691,667
$2,350,000
-
-
-
$2,750,000
-
$1,995,000
$2,850,000
-
-
-
$3,428,333
-
$3,000,000
-
$2,000,000
$1,065,000
$1,550,000
644 Broadway
N/A
Median Price
Past 12 months
Past 12 months
-
-
$3,450,000
$3,200,000
$2,350,000
-
-
-
$2,750,000
-
$1,995,000
$2,850,000
-
-
-
$3,435,000
-
$3,000,000
-
$2,000,000
$1,065,000
$1,550,000
644 Broadway
N/A
Avg. Price / ft2
Past 12 months
Past 12 months
-
-
-
-
-
-
-
-
-
-
-
-
-
-
-
-
-
-
-
-
-
-
644 Broadway
N/A
Avg. Price
Past 12 months
Past 12 months
-
-
-
-
-
-
-
-
-
-
-
-
-
-
-
-
-
-
-
-
-
-
644 Broadway
N/A
Median Price
Past 12 months
Past 12 months
-
-
-
-
-
-
-
-
-
-
-
-
-
-
-
-
-
-
-
-
-
-
644 Broadway
N/A
Avg. Price / ft2
Past 12 months
Past 12 months
-
-
-
$1,502
$1,022
-
-
-
$1,196
-
$1,425
$1,018
-
-
-
$1,015
-
-
-
$870
$761
-
644 Broadway
N/A
Avg. Price
Past 12 months
Past 12 months
-
-
-
$3,937,500
$2,350,000
-
-
-
$2,750,000
-
$1,995,000
$2,850,000
-
-
-
$3,450,000
-
-
-
$2,000,000
$1,065,000
$1,550,000
644 Broadway
N/A
Median Price
Past 12 months
Past 12 months
-
-
-
$3,937,500
$2,350,000
-
-
-
$2,750,000
-
$1,995,000
$2,850,000
-
-
-
$3,450,000
-
-
-
$2,000,000
$1,065,000
$1,550,000
644 Broadway
N/A
Avg. Price / ft2
Past 12 months
Past 12 months
-
-
$1,188
$1,102
-
-
-
-
-
-
-
-
-
-
-
$1,171
-
$771
-
-
-
-
644 Broadway
N/A
Avg. Price
Past 12 months
Past 12 months
-
-
$3,450,000
$3,200,000
-
-
-
-
-
-
-
-
-
-
-
$3,400,000
-
$3,000,000
-
-
-
-
644 Broadway
N/A
Median Price
Past 12 months
Past 12 months
-
-
$3,450,000
$3,200,000
-
-
-
-
-
-
-
-
-
-
-
$3,400,000
-
$3,000,000
-
-
-
-
644 Broadway
N/A
Avg. Price / ft2
Past 12 months
Past 12 months
-
-
-
-
-
-
-
-
-
-
-
-
-
-
-
$859
-
-
-
-
-
-
644 Broadway
N/A
Avg. Price
Past 12 months
Past 12 months
-
-
-
-
-
-
-
-
-
-
-
-
-
-
-
$3,435,000
-
-
-
-
-
-
644 Broadway
N/A
Median Price
Past 12 months
Past 12 months
-
-
-
-
-
-
-
-
-
-
-
-
-
-
-
$3,435,000
-
-
-
-
-
-
644 Broadway
N/A
Avg. Price / ft2
Past 12 months
Past 12 months
-
-
-
-
-
-
-
-
-
-
-
-
-
-
-
-
-
-
-
-
-
-
644 Broadway
N/A
Avg. Price
Past 12 months
Past 12 months
-
-
-
-
-
-
-
-
-
-
-
-
-
-
-
-
-
-
-
-
-
-
644 Broadway
N/A
Median Price
Past 12 months
Past 12 months
-
-
-
-
-
-
-
-
-
-
-
-
-
-
-
-
-
-
-
-
-
-
25 Minetta Lane
N/A
Avg. Price / ft2
Past 12 months
Past 12 months
$1,528
-
$1,366
$930
-
$2,768
-
-
$1,201
-
-
$923
$910
$873
$1,059
$1,200
$952
$896
$1,047
$901
-
$578
25 Minetta Lane
$766,667
Avg. Price
Past 12 months
Past 12 months
$947,500
$817,500
$740,000
$465,000
-
$1,915,000
$1,215,000
$840,000
$721,333
$587,283
$551,823
$488,000
$633,795
$513,333
$900,000
$723,400
$593,133
$907,500
$607,500
$704,235
-
$359,833
25 Minetta Lane
$775,000
Median Price
Past 12 months
Past 12 months
$947,500
$817,500
$740,000
$465,000
-
$2,100,000
$1,215,000
$840,000
$630,000
$587,283
$551,823
$470,000
$529,781
$515,000
$900,000
$720,000
$504,400
$907,500
$607,500
$735,000
-
$377,500
25 Minetta Lane
N/A
Avg. Price / ft2
Past 12 months
Past 12 months
$1,590
-
$1,366
$930
-
-
-
-
$1,070
-
-
$923
$910
$879
-
-
$841
$733
-
$744
-
-
25 Minetta Lane
$725,000
Avg. Price
Past 12 months
Past 12 months
$795,000
$640,000
$740,000
$465,000
-
-
-
-
$535,000
$587,283
-
$488,000
$489,320
$457,500
-
-
$464,700
$440,000
-
$445,589
-
-
25 Minetta Lane
$725,000
Median Price
Past 12 months
Past 12 months
$795,000
$640,000
$740,000
$465,000
-
-
-
-
$535,000
$587,283
-
$470,000
$486,250
$457,500
-
-
$464,700
$440,000
-
$445,589
-
-
25 Minetta Lane
N/A
Avg. Price / ft2
Past 12 months
Past 12 months
$1,467
-
-
-
-
$1,588
-
-
$1,332
-
-
-
-
$862
$1,059
$1,200
$1,063
-
$1,047
$1,059
-
$578
25 Minetta Lane
$850,000
Avg. Price
Past 12 months
Past 12 months
$1,100,000
$995,000
-
-
-
$1,350,000
$1,215,000
$840,000
$814,500
-
-
-
$826,428
$625,000
$900,000
$723,400
$850,000
-
$607,500
$876,667
-
$359,833
25 Minetta Lane
$850,000
Median Price
Past 12 months
Past 12 months
$1,100,000
$995,000
-
-
-
$1,350,000
$1,215,000
$840,000
$814,500
-
-
-
$849,626
$625,000
$900,000
$720,000
$850,000
-
$607,500
$900,000
-
$377,500
25 Minetta Lane
N/A
Avg. Price / ft2
Past 12 months
Past 12 months
-
-
-
-
-
$3,358
-
-
-
-
-
-
-
-
-
-
-
$1,058
-
-
-
-
25 Minetta Lane
N/A
Avg. Price
Past 12 months
Past 12 months
-
-
-
-
-
$2,197,500
-
-
-
-
-
-
-
-
-
-
-
$1,375,000
-
-
-
-
25 Minetta Lane
N/A
Median Price
Past 12 months
Past 12 months
-
-
-
-
-
$2,197,500
-
-
-
-
-
-
-
-
-
-
-
$1,375,000
-
-
-
-
25 Minetta Lane
N/A
Avg. Price / ft2
Past 12 months
Past 12 months
-
-
-
-
-
-
-
-
-
-
-
-
-
-
-
-
-
-
-
-
-
-
25 Minetta Lane
N/A
Avg. Price
Past 12 months
Past 12 months
-
-
-
-
-
-
-
-
-
-
-
-
-
-
-
-
-
-
-
-
-
-
25 Minetta Lane
N/A
Median Price
Past 12 months
Past 12 months
-
-
-
-
-
-
-
-
-
-
-
-
-
-
-
-
-
-
-
-
-
-
25 Minetta Lane
N/A
Avg. Price / ft2
Past 12 months
Past 12 months
-
-
-
-
-
-
-
-
-
-
-
-
-
-
-
-
-
-
-
-
-
-
25 Minetta Lane
N/A
Avg. Price
Past 12 months
Past 12 months
-
-
-
-
-
-
-
-
-
-
-
-
-
-
-
-
-
-
-
-
-
-
25 Minetta Lane
N/A
Median Price
Past 12 months
Past 12 months
-
-
-
-
-
-
-
-
-
-
-
-
-
-
-
-
-
-
-
-
-
-
840 Broadway
N/A
Avg. Price / ft2
Past 12 months
Past 12 months
$1,008
-
-
-
$1,383
-
$1,400
-
-
-
-
-
-
-
-
-
-
-
-
-
-
-
840 Broadway
N/A
Avg. Price
Past 12 months
Past 12 months
$3,025,000
-
-
-
$4,150,000
-
$4,200,000
-
-
-
-
-
-
-
-
-
$3,850,000
$3,200,000
-
-
-
-
840 Broadway
N/A
Median Price
Past 12 months
Past 12 months
$3,025,000
-
-
-
$4,150,000
-
$4,200,000
-
-
-
-
-
-
-
-
-
$3,850,000
$3,200,000
-
-
-
-
840 Broadway
N/A
Avg. Price / ft2
Past 12 months
Past 12 months
-
-
-
-
-
-
-
-
-
-
-
-
-
-
-
-
-
-
-
-
-
-
840 Broadway
N/A
Avg. Price
Past 12 months
Past 12 months
-
-
-
-
-
-
-
-
-
-
-
-
-
-
-
-
-
-
-
-
-
-
840 Broadway
N/A
Median Price
Past 12 months
Past 12 months
-
-
-
-
-
-
-
-
-
-
-
-
-
-
-
-
-
-
-
-
-
-
840 Broadway
N/A
Avg. Price / ft2
Past 12 months
Past 12 months
$1,008
-
-
-
-
-
-
-
-
-
-
-
-
-
-
-
-
-
-
-
-
-
840 Broadway
N/A
Avg. Price
Past 12 months
Past 12 months
$3,025,000
-
-
-
-
-
-
-
-
-
-
-
-
-
-
-
-
-
-
-
-
-
840 Broadway
N/A
Median Price
Past 12 months
Past 12 months
$3,025,000
-
-
-
-
-
-
-
-
-
-
-
-
-
-
-
-
-
-
-
-
-
840 Broadway
N/A
Avg. Price / ft2
Past 12 months
Past 12 months
-
-
-
-
$1,383
-
$1,400
-
-
-
-
-
-
-
-
-
-
-
-
-
-
-
840 Broadway
N/A
Avg. Price
Past 12 months
Past 12 months
-
-
-
-
$4,150,000
-
$4,200,000
-
-
-
-
-
-
-
-
-
-
-
-
-
-
-
840 Broadway
N/A
Median Price
Past 12 months
Past 12 months
-
-
-
-
$4,150,000
-
$4,200,000
-
-
-
-
-
-
-
-
-
-
-
-
-
-
-
840 Broadway
N/A
Avg. Price / ft2
Past 12 months
Past 12 months
-
-
-
-
-
-
-
-
-
-
-
-
-
-
-
-
-
-
-
-
-
-
840 Broadway
N/A
Avg. Price
Past 12 months
Past 12 months
-
-
-
-
-
-
-
-
-
-
-
-
-
-
-
-
-
-
-
-
-
-
840 Broadway
N/A
Median Price
Past 12 months
Past 12 months
-
-
-
-
-
-
-
-
-
-
-
-
-
-
-
-
-
-
-
-
-
-
840 Broadway
N/A
Avg. Price / ft2
Past 12 months
Past 12 months
-
-
-
-
-
-
-
-
-
-
-
-
-
-
-
-
-
-
-
-
-
-
840 Broadway
N/A
Avg. Price
Past 12 months
Past 12 months
-
-
-
-
-
-
-
-
-
-
-
-
-
-
-
-
-
-
-
-
-
-
840 Broadway
N/A
Median Price
Past 12 months
Past 12 months
-
-
-
-
-
-
-
-
-
-
-
-
-
-
-
-
-
-
-
-
-
-
290 Sixth Avenue
N/A
Avg. Price / ft2
Past 12 months
Past 12 months
-
-
-
-
-
-
$1,268
-
$1,284
$1,409
-
$1,100
$960
$1,012
$949
-
-
$645
$761
$880
-
$493
290 Sixth Avenue
N/A
Avg. Price
Past 12 months
Past 12 months
-
-
-
-
-
-
$1,240,000
$931,500
$906,000
$2,395,000
$620,000
$1,176,667
$694,000
$821,833
$759,000
$725,000
-
$620,000
$590,000
$566,000
-
$397,500
290 Sixth Avenue
N/A
Median Price
Past 12 months
Past 12 months
-
-
-
-
-
-
$1,255,000
$905,000
$924,000
$2,395,000
$620,000
$760,000
$705,500
$772,000
$759,000
$725,000
-
$635,000
$590,000
$567,000
-
$397,500
290 Sixth Avenue
N/A
Avg. Price / ft2
Past 12 months
Past 12 months
-
-
-
-
-
-
-
-
-
-
-
-
-
-
-
-
-
-
-
$880
-
-
290 Sixth Avenue
N/A
Avg. Price
Past 12 months
Past 12 months
-
-
-
-
-
-
-
-
-
-
-
-
$715,000
-
-
-
-
-
-
$440,000
-
-
290 Sixth Avenue
N/A
Median Price
Past 12 months
Past 12 months
-
-
-
-
-
-
-
-
-
-
-
-
$715,000
-
-
-
-
-
-
$440,000
-
-
290 Sixth Avenue
N/A
Avg. Price / ft2
Past 12 months
Past 12 months
-
-
-
-
-
-
-
-
-
-
-
-
$960
-
$949
-
-
$645
-
-
-
$493
290 Sixth Avenue
N/A
Avg. Price
Past 12 months
Past 12 months
-
-
-
-
-
-
$790,000
$970,000
$861,500
-
$620,000
$720,000
$687,000
$665,000
$759,000
$725,000
-
$620,000
-
$608,000
-
$397,500
290 Sixth Avenue
N/A
Median Price
Past 12 months
Past 12 months
-
-
-
-
-
-
$790,000
$924,000
$861,500
-
$620,000
$720,000
$696,000
$665,000
$759,000
$725,000
-
$635,000
-
$593,000
-
$397,500
290 Sixth Avenue
N/A
Avg. Price / ft2
Past 12 months
Past 12 months
-
-
-
-
-
-
$1,268
-
$1,284
-
-
$993
-
$1,012
-
-
-
-
$761
-
-
-
290 Sixth Avenue
N/A
Avg. Price
Past 12 months
Past 12 months
-
-
-
-
-
-
$1,465,000
$816,000
$995,000
-
-
$760,000
-
$900,250
-
-
-
-
$590,000
-
-
-
290 Sixth Avenue
N/A
Median Price
Past 12 months
Past 12 months
-
-
-
-
-
-
$1,465,000
$816,000
$995,000
-
-
$760,000
-
$900,250
-
-
-
-
$590,000
-
-
-
290 Sixth Avenue
N/A
Avg. Price / ft2
Past 12 months
Past 12 months
-
-
-
-
-
-
-
-
-
$1,409
-
$1,206
-
-
-
-
-
-
-
-
-
-
290 Sixth Avenue
N/A
Avg. Price
Past 12 months
Past 12 months
-
-
-
-
-
-
-
-
-
$2,395,000
-
$2,050,000
-
-
-
-
-
-
-
-
-
-
290 Sixth Avenue
N/A
Median Price
Past 12 months
Past 12 months
-
-
-
-
-
-
-
-
-
$2,395,000
-
$2,050,000
-
-
-
-
-
-
-
-
-
-
290 Sixth Avenue
N/A
Avg. Price / ft2
Past 12 months
Past 12 months
-
-
-
-
-
-
-
-
-
-
-
-
-
-
-
-
-
-
-
-
-
-
290 Sixth Avenue
N/A
Avg. Price
Past 12 months
Past 12 months
-
-
-
-
-
-
-
-
-
-
-
-
-
-
-
-
-
-
-
-
-
-
290 Sixth Avenue
N/A
Median Price
Past 12 months
Past 12 months
-
-
-
-
-
-
-
-
-
-
-
-
-
-
-
-
-
-
-
-
-
-
290 Sixth Avenue
N/A
Avg. Price / ft2
Past 12 months
Past 12 months
-
-
-
-
-
-
-
-
-
-
-
-
-
-
-
-
-
-
-
-
-
-
290 Sixth Avenue
N/A
Avg. Price
Past 12 months
Past 12 months
-
-
-
-
-
-
-
-
-
-
-
-
-
-
-
-
-
-
-
-
-
-
290 Sixth Avenue
N/A
Median Price
Past 12 months
Past 12 months
-
-
-
-
-
-
-
-
-
-
-
-
-
-
-
-
-
-
-
-
-
-
Parker Towne House
N/A
Avg. Price / ft2
Past 12 months
Past 12 months
$1,370
-
$1,848
$1,345
$1,254
$1,875
$1,381
$1,519
-
$1,275
$1,334
$1,049
$945
$972
$922
$799
$1,360
$733
$819
$636
$612
$592
Parker Towne House
$2,400,000
Avg. Price
Past 12 months
Past 12 months
$1,112,750
$1,001,250
$1,200,125
$1,005,000
$914,167
$1,850,000
$1,307,500
$994,364
$1,184,494
$960,086
$1,385,750
$577,000
$671,251
$989,000
$710,333
$433,083
$1,299,875
$480,667
$603,913
$555,029
$411,350
$503,689
Parker Towne House
$2,400,000
Median Price
Past 12 months
Past 12 months
$650,500
$640,000
$1,225,000
$680,000
$610,000
$1,850,000
$1,550,000
$775,000
$705,000
$660,000
$1,075,000
$577,000
$463,000
$1,070,000
$430,000
$442,000
$790,000
$456,000
$457,565
$475,000
$350,000
$569,000
Parker Towne House
N/A
Avg. Price / ft2
Past 12 months
Past 12 months
$1,370
-
$1,182
$1,082
$1,215
-
$1,243
$1,293
-
$1,199
$1,171
$1,049
$945
$944
$852
$799
$988
$829
$756
$794
$612
$491
Parker Towne House
N/A
Avg. Price
Past 12 months
Past 12 months
$633,667
$467,500
$650,000
$595,000
$608,750
-
$643,750
$718,001
$576,741
$617,800
$563,333
$577,000
$425,100
$425,000
$427,500
$438,364
$395,000
$434,500
$369,000
$370,000
$339,071
$238,940
Parker Towne House
N/A
Median Price
Past 12 months
Past 12 months
$601,000
$467,500
$650,000
$595,000
$608,750
-
$643,750
$739,253
$576,741
$617,800
$550,000
$577,000
$449,000
$425,000
$427,500
$449,000
$395,000
$434,500
$375,000
$370,000
$335,000
$270,000
Parker Towne House
N/A
Avg. Price / ft2
Past 12 months
Past 12 months
-
-
$2,400
-
-
-
-
$1,867
-
-
-
-
-
$1,070
-
-
-
$637
-
$611
-
-
Parker Towne House
N/A
Avg. Price
Past 12 months
Past 12 months
-
$795,000
$1,800,000
-
-
-
-
$1,195,000
-
$800,000
$1,550,000
-
-
$1,070,000
-
-
-
$573,000
-
$667,550
$600,000
$602,000
Parker Towne House
N/A
Median Price
Past 12 months
Past 12 months
-
$795,000
$1,800,000
-
-
-
-
$1,250,000
-
$800,000
$1,550,000
-
-
$1,070,000
-
-
-
$573,000
-
$660,100
$600,000
$602,000
Parker Towne House
N/A
Avg. Price / ft2
Past 12 months
Past 12 months
-
-
$1,963
$1,872
$1,293
$1,875
$1,520
$1,850
-
$1,350
$1,824
-
-
$937
$1,063
-
$1,484
-
$925
$528
-
$692
Parker Towne House
$2,400,000
Avg. Price
Past 12 months
Past 12 months
-
$2,275,000
$1,962,500
$1,825,000
$1,525,000
$1,850,000
$1,750,000
$1,850,000
$2,400,000
$1,925,000
$2,537,250
-
$1,160,000
$1,150,000
$1,276,000
-
$2,204,750
-
$944,750
$475,000
-
$802,500
Parker Towne House
$2,400,000
Median Price
Past 12 months
Past 12 months
-
$2,275,000
$1,962,500
$1,825,000
$1,525,000
$1,850,000
$1,700,000
$1,850,000
$2,400,000
$1,925,000
$2,537,250
-
$1,160,000
$1,195,000
$1,276,000
-
$2,096,000
-
$942,000
$475,000
-
$802,500
Parker Towne House
N/A
Avg. Price / ft2
Past 12 months
Past 12 months
-
-
-
-
-
-
-
-
-
-
-
-
-
-
-
-
-
-
-
-
-
-
Parker Towne House
N/A
Avg. Price
Past 12 months
Past 12 months
-
-
-
-
-
-
-
-
-
-
-
-
-
-
-
-
-
-
-
-
-
-
Parker Towne House
N/A
Median Price
Past 12 months
Past 12 months
-
-
-
-
-
-
-
-
-
-
-
-
-
-
-
-
-
-
-
-
-
-
Parker Towne House
N/A
Avg. Price / ft2
Past 12 months
Past 12 months
-
-
-
-
-
-
-
-
-
-
-
-
-
-
-
-
-
-
-
-
-
-
Parker Towne House
N/A
Avg. Price
Past 12 months
Past 12 months
$2,550,000
-
-
-
-
-
-
-
-
-
-
-
-
-
-
-
-
-
-
-
-
-
Parker Towne House
N/A
Median Price
Past 12 months
Past 12 months
$2,550,000
-
-
-
-
-
-
-
-
-
-
-
-
-
-
-
-
-
-
-
-
-
Parker Towne House
N/A
Avg. Price / ft2
Past 12 months
Past 12 months
-
-
-
-
-
-
-
-
-
-
-
-
-
-
-
-
-
-
-
-
-
-
Parker Towne House
N/A
Avg. Price
Past 12 months
Past 12 months
-
-
-
-
-
-
-
-
-
-
-
-
-
-
-
-
-
-
-
-
-
-
Parker Towne House
N/A
Median Price
Past 12 months
Past 12 months
-
-
-
-
-
-
-
-
-
-
-
-
-
-
-
-
-
-
-
-
-
-
54 East 8th Street
N/A
Avg. Price / ft2
Past 12 months
Past 12 months
$998
$759
$895
$986
$1,040
$1,008
$1,077
$824
$954
$925
$876
$711
$700
$725
$808
-
$777
$793
-
$628
$490
$428
54 East 8th Street
$501,256
Avg. Price
Past 12 months
Past 12 months
$485,000
$480,375
$541,500
$533,500
$542,000
$592,500
$470,286
$514,643
$482,500
$643,167
$456,448
$443,400
$462,519
$414,875
$536,250
-
$410,250
$453,129
$692,410
$429,450
$291,420
$238,600
54 East 8th Street
$417,500
Median Price
Past 12 months
Past 12 months
$475,000
$517,500
$483,750
$577,500
$520,000
$592,500
$440,000
$490,000
$392,500
$712,000
$383,000
$412,500
$455,075
$435,000
$536,250
-
$339,501
$364,014
$692,410
$410,000
$233,000
$180,000
54 East 8th Street
N/A
Avg. Price / ft2
Past 12 months
Past 12 months
$956
-
$951
$1,081
$1,258
$1,233
$1,160
$861
$975
$979
$889
$773
$766
$725
$814
-
$783
$854
-
$658
$476
$429
54 East 8th Street
$358,760
Avg. Price
Past 12 months
Past 12 months
$405,000
$457,167
$430,000
$437,500
$475,000
$555,000
$452,000
$435,625
$384,000
$385,000
$368,200
$337,000
$317,500
$306,250
$350,000
-
$329,667
$329,206
-
$278,333
$212,667
$178,500
54 East 8th Street
$385,000
Median Price
Past 12 months
Past 12 months
$405,000
$485,000
$428,750
$437,500
$500,000
$555,000
$426,000
$432,500
$385,000
$385,000
$380,000
$345,000
$317,500
$306,250
$350,000
-
$323,500
$323,000
-
$275,000
$210,000
$178,500
54 East 8th Street
N/A
Avg. Price / ft2
Past 12 months
Past 12 months
$1,040
$759
$807
$797
$823
$783
$829
$787
$927
$912
$807
$652
$625
-
-
-
$627
$699
-
$605
$557
-
54 East 8th Street
N/A
Avg. Price
Past 12 months
Past 12 months
$565,000
$550,000
$650,000
$597,500
$642,500
$630,000
$580,000
$620,000
$545,000
$712,000
$603,527
$514,667
$455,038
$523,500
-
-
$505,000
$489,000
-
$459,083
$390,100
$275,000
54 East 8th Street
N/A
Median Price
Past 12 months
Past 12 months
$565,000
$550,000
$650,000
$605,000
$642,500
$630,000
$580,000
$595,000
$545,000
$712,000
$600,581
$529,000
$455,075
$523,500
-
-
$505,000
$489,000
-
$454,750
$390,100
$275,000
54 East 8th Street
N/A
Avg. Price / ft2
Past 12 months
Past 12 months
-
-
$925
-
-
-
-
-
$944
$842
-
$579
$672
-
$803
-
$888
$767
-
-
$452
$425
54 East 8th Street
$715,000
Avg. Price
Past 12 months
Past 12 months
-
-
$879,000
-
-
-
-
-
$850,000
$832,500
-
$602,500
$622,500
-
$722,500
-
$799,000
$690,000
$692,410
-
$429,000
$382,500
54 East 8th Street
$715,000
Median Price
Past 12 months
Past 12 months
-
-
$879,000
-
-
-
-
-
$850,000
$832,500
-
$602,500
$622,500
-
$722,500
-
$799,000
$690,000
$692,410
-
$429,000
$382,500
54 East 8th Street
N/A
Avg. Price / ft2
Past 12 months
Past 12 months
-
-
-
-
-
-
-
-
-
-
-
-
-
-
-
-
-
-
-
-
-
-
54 East 8th Street
N/A
Avg. Price
Past 12 months
Past 12 months
-
-
-
-
-
-
-
-
-
-
-
-
-
-
-
-
-
$800,000
-
$705,000
-
-
54 East 8th Street
N/A
Median Price
Past 12 months
Past 12 months
-
-
-
-
-
-
-
-
-
-
-
-
-
-
-
-
-
$800,000
-
$705,000
-
-
54 East 8th Street
N/A
Avg. Price / ft2
Past 12 months
Past 12 months
-
-
-
-
-
-
-
-
-
-
-
-
-
-
-
-
-
-
-
-
-
-
54 East 8th Street
N/A
Avg. Price
Past 12 months
Past 12 months
-
-
-
-
-
-
-
-
-
-
-
-
-
-
-
-
-
-
-
-
-
-
54 East 8th Street
N/A
Median Price
Past 12 months
Past 12 months
-
-
-
-
-
-
-
-
-
-
-
-
-
-
-
-
-
-
-
-
-
-
54 East 8th Street
N/A
Avg. Price / ft2
Past 12 months
Past 12 months
-
-
-
-
-
-
-
-
-
-
-
-
-
-
-
-
-
-
-
-
-
-
54 East 8th Street
N/A
Avg. Price
Past 12 months
Past 12 months
-
-
-
-
-
-
-
-
-
-
-
-
-
-
-
-
-
-
-
-
-
-
54 East 8th Street
N/A
Median Price
Past 12 months
Past 12 months
-
-
-
-
-
-
-
-
-
-
-
-
-
-
-
-
-
-
-
-
-
-
133 Mercer Street
N/A
Avg. Price / ft2
Past 12 months
Past 12 months
-
-
-
-
-
-
-
-
$1,808
-
-
-
$914
-
-
-
-
$1,168
-
$1,000
-
-
133 Mercer Street
N/A
Avg. Price
Past 12 months
Past 12 months
-
-
-
-
-
-
-
-
$2,800,000
-
-
-
$1,750,000
-
-
-
-
$1,985,000
-
$1,750,000
-
-
133 Mercer Street
N/A
Median Price
Past 12 months
Past 12 months
-
-
-
-
-
-
-
-
$3,000,000
-
-
-
$1,750,000
-
-
-
-
$1,985,000
-
$1,750,000
-
-
133 Mercer Street
N/A
Avg. Price / ft2
Past 12 months
Past 12 months
-
-
-
-
-
-
-
-
-
-
-
-
-
-
-
-
-
-
-
-
-
-
133 Mercer Street
N/A
Avg. Price
Past 12 months
Past 12 months
-
-
-
-
-
-
-
-
-
-
-
-
-
-
-
-
-
-
-
-
-
-
133 Mercer Street
N/A
Median Price
Past 12 months
Past 12 months
-
-
-
-
-
-
-
-
-
-
-
-
-
-
-
-
-
-
-
-
-
-
133 Mercer Street
N/A
Avg. Price / ft2
Past 12 months
Past 12 months
-
-
-
-
-
-
-
-
$1,808
-
-
-
$914
-
-
-
-
-
-
$1,000
-
-
133 Mercer Street
N/A
Avg. Price
Past 12 months
Past 12 months
-
-
-
-
-
-
-
-
$2,800,000
-
-
-
$1,750,000
-
-
-
-
-
-
$1,750,000
-
-
133 Mercer Street
N/A
Median Price
Past 12 months
Past 12 months
-
-
-
-
-
-
-
-
$3,000,000
-
-
-
$1,750,000
-
-
-
-
-
-
$1,750,000
-
-
133 Mercer Street
N/A
Avg. Price / ft2
Past 12 months
Past 12 months
-
-
-
-
-
-
-
-
-
-
-
-
-
-
-
-
-
$1,168
-
-
-
-
133 Mercer Street
N/A
Avg. Price
Past 12 months
Past 12 months
-
-
-
-
-
-
-
-
-
-
-
-
-
-
-
-
-
$1,985,000
-
-
-
-
133 Mercer Street
N/A
Median Price
Past 12 months
Past 12 months
-
-
-
-
-
-
-
-
-
-
-
-
-
-
-
-
-
$1,985,000
-
-
-
-
133 Mercer Street
N/A
Avg. Price / ft2
Past 12 months
Past 12 months
-
-
-
-
-
-
-
-
-
-
-
-
-
-
-
-
-
-
-
-
-
-
133 Mercer Street
N/A
Avg. Price
Past 12 months
Past 12 months
-
-
-
-
-
-
-
-
-
-
-
-
-
-
-
-
-
-
-
-
-
-
133 Mercer Street
N/A
Median Price
Past 12 months
Past 12 months
-
-
-
-
-
-
-
-
-
-
-
-
-
-
-
-
-
-
-
-
-
-
133 Mercer Street
N/A
Avg. Price / ft2
Past 12 months
Past 12 months
-
-
-
-
-
-
-
-
-
-
-
-
-
-
-
-
-
-
-
-
-
-
133 Mercer Street
N/A
Avg. Price
Past 12 months
Past 12 months
-
-
-
-
-
-
-
-
-
-
-
-
-
-
-
-
-
-
-
-
-
-
133 Mercer Street
N/A
Median Price
Past 12 months
Past 12 months
-
-
-
-
-
-
-
-
-
-
-
-
-
-
-
-
-
-
-
-
-
-
The Atrium
$878
Avg. Price / ft2
Past 12 months
Past 12 months
-
-
-
-
-
-
$1,116
-
$1,304
-
$863
-
$822
$917
-
-
-
-
-
-
-
$600
The Atrium
$587,500
Avg. Price
Past 12 months
Past 12 months
$1,546,667
-
-
-
-
-
$731,000
$460,750
$630,000
$577,500
$509,800
$610,000
$370,000
$550,000
-
-
-
$350,000
-
-
$380,000
$269,375
The Atrium
$587,500
Median Price
Past 12 months
Past 12 months
$1,650,000
-
-
-
-
-
$731,000
$460,750
$630,000
$577,500
$537,500
$610,000
$370,000
$550,000
-
-
-
$350,000
-
-
$380,000
$261,250
The Atrium
N/A
Avg. Price / ft2
Past 12 months
Past 12 months
-
-
-
-
-
-
-
-
-
-
$821
-
$822
-
-
-
-
-
-
-
-
-
The Atrium
$525,000
Avg. Price
Past 12 months
Past 12 months
-
-
-
-
-
-
-
$460,750
-
-
$349,000
-
$370,000
-
-
-
-
-
-
-
-
$207,500
The Atrium
$525,000
Median Price
Past 12 months
Past 12 months
-
-
-
-
-
-
-
$460,750
-
-
$349,000
-
$370,000
-
-
-
-
-
-
-
-
$207,500
The Atrium
$878
Avg. Price / ft2
Past 12 months
Past 12 months
-
-
-
-
-
-
$1,116
-
$1,304
-
$905
-
-
$917
-
-
-
-
-
-
-
$600
The Atrium
$650,000
Avg. Price
Past 12 months
Past 12 months
$995,000
-
-
-
-
-
$731,000
-
$630,000
$675,000
$562,500
-
-
$550,000
-
-
-
-
-
-
$380,000
$290,000
The Atrium
$650,000
Median Price
Past 12 months
Past 12 months
$995,000
-
-
-
-
-
$731,000
-
$630,000
$675,000
$562,500
-
-
$550,000
-
-
-
-
-
-
$380,000
$315,000
The Atrium
N/A
Avg. Price / ft2
Past 12 months
Past 12 months
-
-
-
-
-
-
-
-
-
-
-
-
-
-
-
-
-
-
-
-
-
-
The Atrium
N/A
Avg. Price
Past 12 months
Past 12 months
-
-
-
-
-
-
-
-
-
-
-
$610,000
-
-
-
-
-
$350,000
-
-
-
-
The Atrium
N/A
Median Price
Past 12 months
Past 12 months
-
-
-
-
-
-
-
-
-
-
-
$610,000
-
-
-
-
-
$350,000
-
-
-
-
The Atrium
N/A
Avg. Price / ft2
Past 12 months
Past 12 months
-
-
-
-
-
-
-
-
-
-
-
-
-
-
-
-
-
-
-
-
-
-
The Atrium
N/A
Avg. Price
Past 12 months
Past 12 months
-
-
-
-
-
-
-
-
-
-
-
-
-
-
-
-
-
-
-
-
-
-
The Atrium
N/A
Median Price
Past 12 months
Past 12 months
-
-
-
-
-
-
-
-
-
-
-
-
-
-
-
-
-
-
-
-
-
-
The Atrium
N/A
Avg. Price / ft2
Past 12 months
Past 12 months
-
-
-
-
-
-
-
-
-
-
-
-
-
-
-
-
-
-
-
-
-
-
The Atrium
N/A
Avg. Price
Past 12 months
Past 12 months
-
-
-
-
-
-
-
-
-
-
-
-
-
-
-
-
-
-
-
-
-
-
The Atrium
N/A
Median Price
Past 12 months
Past 12 months
-
-
-
-
-
-
-
-
-
-
-
-
-
-
-
-
-
-
-
-
-
-
211 Thompson Street
$939
Avg. Price / ft2
Past 12 months
Past 12 months
$1,294
$1,193
$1,249
$1,471
$1,017
-
$859
$998
-
$1,061
-
$659
$780
$808
$911
$802
-
$692
$802
$767
$692
$684
211 Thompson Street
$754,373
Avg. Price
Past 12 months
Past 12 months
$700,000
$665,000
$862,800
$691,667
$802,439
$675,000
$587,500
$619,821
$667,571
$686,925
$642,000
$504,714
$486,625
$407,000
$508,333
$447,917
$542,500
$467,539
$506,875
$369,625
$435,750
$332,583
211 Thompson Street
$787,500
Median Price
Past 12 months
Past 12 months
$715,000
$667,500
$849,000
$685,000
$802,439
$675,000
$567,500
$625,000
$705,000
$731,604
$740,000
$469,000
$508,500
$355,000
$495,000
$463,750
$542,500
$450,000
$511,250
$345,000
$405,500
$298,250
211 Thompson Street
N/A
Avg. Price / ft2
Past 12 months
Past 12 months
-
-
-
$1,471
-
-
-
$998
-
-
-
-
-
$778
-
$847
-
-
-
$767
$527
-
211 Thompson Street
$465,000
Avg. Price
Past 12 months
Past 12 months
$490,000
$492,500
-
$625,000
-
-
$502,500
$475,917
$543,000
$427,140
$395,000
$415,667
$346,500
$341,667
-
$342,500
-
$407,000
$385,000
$340,286
$237,000
$238,500
211 Thompson Street
$465,000
Median Price
Past 12 months
Past 12 months
$490,000
$492,500
-
$625,000
-
-
$502,500
$479,750
$535,000
$427,140
$395,000
$400,000
$346,500
$350,000
-
$342,500
-
$407,000
$385,000
$345,000
$237,000
$239,000
211 Thompson Street
$939
Avg. Price / ft2
Past 12 months
Past 12 months
$1,294
$1,193
$1,249
-
$1,017
-
$859
-
-
$1,061
-
$659
$780
$839
$911
$757
-
$692
$802
-
$747
$684
211 Thompson Street
$795,711
Avg. Price
Past 12 months
Past 12 months
$805,000
$837,500
$862,800
$725,000
$655,000
$675,000
$672,500
$727,750
$761,000
$724,037
$703,750
$571,500
$626,750
$505,000
$508,333
$500,625
$542,500
$537,500
$547,500
$575,000
$487,800
$426,667
211 Thompson Street
$810,000
Median Price
Past 12 months
Past 12 months
$805,000
$837,500
$849,000
$725,000
$655,000
$675,000
$672,500
$732,500
$745,000
$739,000
$744,500
$552,500
$626,750
$505,000
$495,000
$520,000
$542,500
$552,500
$620,000
$575,000
$510,000
$465,000
211 Thompson Street
N/A
Avg. Price / ft2
Past 12 months
Past 12 months
-
-
-
-
-
-
-
-
-
-
-
-
-
-
-
-
-
-
-
-
-
-
211 Thompson Street
N/A
Avg. Price
Past 12 months
Past 12 months
-
-
-
-
-
-
-
-
-
-
-
-
-
-
-
-
-
-
-
-
-
-
211 Thompson Street
N/A
Median Price
Past 12 months
Past 12 months
-
-
-
-
-
-
-
-
-
-
-
-
-
-
-
-
-
-
-
-
-
-
211 Thompson Street
N/A
Avg. Price / ft2
Past 12 months
Past 12 months
-
-
-
-
-
-
-
-
-
-
-
-
-
-
-
-
-
-
-
-
-
-
211 Thompson Street
N/A
Avg. Price
Past 12 months
Past 12 months
-
-
-
-
$949,878
-
-
-
-
-
-
-
-
-
-
-
-
-
-
-
-
-
211 Thompson Street
N/A
Median Price
Past 12 months
Past 12 months
-
-
-
-
$949,878
-
-
-
-
-
-
-
-
-
-
-
-
-
-
-
-
-
211 Thompson Street
N/A
Avg. Price / ft2
Past 12 months
Past 12 months
-
-
-
-
-
-
-
-
-
-
-
-
-
-
-
-
-
-
-
-
-
-
211 Thompson Street
N/A
Avg. Price
Past 12 months
Past 12 months
-
-
-
-
-
-
-
-
-
-
-
-
-
-
-
-
-
-
-
-
-
-
211 Thompson Street
N/A
Median Price
Past 12 months
Past 12 months
-
-
-
-
-
-
-
-
-
-
-
-
-
-
-
-
-
-
-
-
-
-
211 Thompson Street
N/A
Avg. Price / ft2
Past 12 months
Past 12 months
-
-
-
-
-
-
-
-
-
-
-
-
-
-
-
-
-
-
-
-
-
-
211 Thompson Street
N/A
Avg. Price
Past 12 months
Past 12 months
-
-
-
-
-
-
-
-
-
-
-
-
-
-
-
-
-
-
-
-
-
-
211 Thompson Street
N/A
Median Price
Past 12 months
Past 12 months
-
-
-
-
-
-
-
-
-
-
-
-
-
-
-
-
-
-
-
-
-
-
200 Mercer Street
$1,110
Avg. Price / ft2
Past 12 months
Past 12 months
-
$1,193
-
-
-
$1,208
-
$677
$1,104
$1,255
$990
-
$1,029
$650
$915
$680
-
$1,009
$894
$855
$730
$676
200 Mercer Street
$4,325,000
Avg. Price
Past 12 months
Past 12 months
-
$3,341,625
-
-
-
$2,900,000
$2,995,000
$1,825,000
$2,320,000
$2,950,000
$2,863,333
-
$2,701,000
$1,495,000
$2,150,000
$1,967,500
-
$2,233,333
$2,100,000
$2,335,000
$1,410,000
$1,285,000
200 Mercer Street
$4,050,000
Median Price
Past 12 months
Past 12 months
-
$3,341,625
-
-
-
$2,900,000
$2,995,000
$1,825,000
$2,320,000
$2,950,000
$3,115,000
-
$2,253,000
$1,495,000
$2,150,000
$1,967,500
-
$1,900,000
$2,100,000
$2,335,000
$1,410,000
$1,285,000
200 Mercer Street
N/A
Avg. Price / ft2
Past 12 months
Past 12 months
-
-
-
-
-
-
-
-
-
-
-
-
-
-
-
-
-
-
-
-
-
-
200 Mercer Street
N/A
Avg. Price
Past 12 months
Past 12 months
-
-
-
-
-
-
-
-
-
-
-
-
-
-
-
-
-
-
-
-
-
-
200 Mercer Street
N/A
Median Price
Past 12 months
Past 12 months
-
-
-
-
-
-
-
-
-
-
-
-
-
-
-
-
-
-
-
-
-
-
200 Mercer Street
N/A
Avg. Price / ft2
Past 12 months
Past 12 months
-
-
-
-
-
-
-
-
-
-
-
-
-
-
-
$611
-
$1,000
-
-
-
-
200 Mercer Street
N/A
Avg. Price
Past 12 months
Past 12 months
-
-
-
-
-
-
-
$1,550,000
-
-
-
-
-
-
-
$1,160,000
-
$1,900,000
-
-
-
-
200 Mercer Street
N/A
Median Price
Past 12 months
Past 12 months
-
-
-
-
-
-
-
$1,550,000
-
-
-
-
-
-
-
$1,160,000
-
$1,900,000
-
-
-
-
200 Mercer Street
$1,042
Avg. Price / ft2
Past 12 months
Past 12 months
-
$1,473
-
-
-
$1,208
-
$677
$1,104
$1,255
$990
-
$887
$650
$915
-
-
-
$894
-
-
$676
200 Mercer Street
$4,837,500
Avg. Price
Past 12 months
Past 12 months
-
$3,308,250
-
-
-
$2,900,000
$2,995,000
$2,100,000
$2,320,000
$2,950,000
$2,863,333
-
$2,064,000
$1,495,000
$2,150,000
-
-
-
$2,100,000
$2,275,000
$995,000
$1,285,000
200 Mercer Street
$4,837,500
Median Price
Past 12 months
Past 12 months
-
$3,308,250
-
-
-
$2,900,000
$2,995,000
$2,100,000
$2,320,000
$2,950,000
$3,115,000
-
$2,064,000
$1,495,000
$2,150,000
-
-
-
$2,100,000
$2,275,000
$995,000
$1,285,000
200 Mercer Street
$1,179
Avg. Price / ft2
Past 12 months
Past 12 months
-
$912
-
-
-
-
-
-
-
-
-
-
-
-
-
$750
-
$1,018
-
$855
$730
-
200 Mercer Street
$3,300,000
Avg. Price
Past 12 months
Past 12 months
-
$3,375,000
-
-
-
-
-
-
-
-
-
-
-
-
-
$2,775,000
-
$2,400,000
-
$2,395,000
$1,825,000
-
200 Mercer Street
$3,300,000
Median Price
Past 12 months
Past 12 months
-
$3,375,000
-
-
-
-
-
-
-
-
-
-
-
-
-
$2,775,000
-
$2,400,000
-
$2,395,000
$1,825,000
-
200 Mercer Street
N/A
Avg. Price / ft2
Past 12 months
Past 12 months
-
-
-
-
-
-
-
-
-
-
-
-
$1,314
-
-
-
-
-
-
-
-
-
200 Mercer Street
N/A
Avg. Price
Past 12 months
Past 12 months
-
-
-
-
-
-
-
-
-
-
-
-
$3,975,000
-
-
-
-
-
-
-
-
-
200 Mercer Street
N/A
Median Price
Past 12 months
Past 12 months
-
-
-
-
-
-
-
-
-
-
-
-
$3,975,000
-
-
-
-
-
-
-
-
-
200 Mercer Street
N/A
Avg. Price / ft2
Past 12 months
Past 12 months
-
-
-
-
-
-
-
-
-
-
-
-
-
-
-
-
-
-
-
-
-
-
200 Mercer Street
N/A
Avg. Price
Past 12 months
Past 12 months
-
-
-
-
-
-
-
-
-
-
-
-
-
-
-
-
-
-
-
-
-
-
200 Mercer Street
N/A
Median Price
Past 12 months
Past 12 months
-
-
-
-
-
-
-
-
-
-
-
-
-
-
-
-
-
-
-
-
-
-


