230 East 71st Street: Price Comparison
between Third Avenue & Second Avenue Building Profile
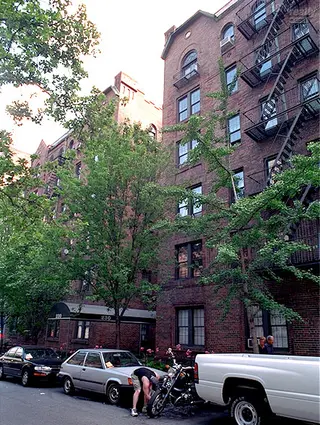
230 East 71st Street
N/A
Avg. Price
Past 12 months
Past 12 months
2024
-
2023
$698,333
2022
$578,000
2021
$640,000
2020
$597,500
2019
$605,000
2018
$570,625
2017
$591,000
2016
$590,000
2015
$524,017
2014
$416,333
2013
$434,583
2012
-
2011
$397,500
2010
-
2009
$594,500
2008
$507,225
2007
$462,696
2006
$524,978
2005
$505,000
2004
$408,250
2003
$334,000
230 East 71st Street
N/A
Median Price
Past 12 months
Past 12 months
2024
-
2023
$670,000
2022
$580,000
2021
$542,500
2020
$597,500
2019
$605,000
2018
$575,000
2017
$595,000
2016
$590,000
2015
$520,000
2014
$420,000
2013
$416,250
2012
-
2011
$397,500
2010
-
2009
$594,500
2008
$512,450
2007
$475,000
2006
$506,250
2005
$505,000
2004
$417,500
2003
$301,750
230 East 71st Street
N/A
Avg. Price
Past 12 months
Past 12 months
2024
-
2023
-
2022
-
2021
-
2020
-
2019
-
2018
-
2017
-
2016
-
2015
-
2014
-
2013
-
2012
-
2011
-
2010
-
2009
-
2008
-
2007
-
2006
-
2005
-
2004
-
2003
-
230 East 71st Street
N/A
Median Price
Past 12 months
Past 12 months
2024
-
2023
-
2022
-
2021
-
2020
-
2019
-
2018
-
2017
-
2016
-
2015
-
2014
-
2013
-
2012
-
2011
-
2010
-
2009
-
2008
-
2007
-
2006
-
2005
-
2004
-
2003
-
230 East 71st Street
N/A
Avg. Price
Past 12 months
Past 12 months
2024
-
2023
$625,000
2022
$578,000
2021
$538,333
2020
$597,500
2019
$605,000
2018
$570,625
2017
$591,000
2016
$590,000
2015
$524,017
2014
$416,333
2013
$416,875
2012
-
2011
$397,500
2010
-
2009
-
2008
$507,225
2007
$462,696
2006
$469,167
2005
$505,000
2004
$408,250
2003
$290,333
230 East 71st Street
N/A
Median Price
Past 12 months
Past 12 months
2024
-
2023
$625,000
2022
$580,000
2021
$535,000
2020
$597,500
2019
$605,000
2018
$575,000
2017
$595,000
2016
$590,000
2015
$520,000
2014
$420,000
2013
$416,250
2012
-
2011
$397,500
2010
-
2009
-
2008
$512,450
2007
$475,000
2006
$465,000
2005
$505,000
2004
$417,500
2003
$278,500
230 East 71st Street
N/A
Avg. Price
Past 12 months
Past 12 months
2024
-
2023
$735,000
2022
-
2021
-
2020
-
2019
-
2018
-
2017
-
2016
-
2015
-
2014
-
2013
$470,000
2012
-
2011
-
2010
-
2009
$594,500
2008
-
2007
-
2006
$692,410
2005
-
2004
-
2003
$465,000
230 East 71st Street
N/A
Median Price
Past 12 months
Past 12 months
2024
-
2023
$735,000
2022
-
2021
-
2020
-
2019
-
2018
-
2017
-
2016
-
2015
-
2014
-
2013
$470,000
2012
-
2011
-
2010
-
2009
$594,500
2008
-
2007
-
2006
$692,410
2005
-
2004
-
2003
$465,000
230 East 71st Street
N/A
Avg. Price
Past 12 months
Past 12 months
2024
-
2023
-
2022
-
2021
-
2020
-
2019
-
2018
-
2017
-
2016
-
2015
-
2014
-
2013
-
2012
-
2011
-
2010
-
2009
-
2008
-
2007
-
2006
-
2005
-
2004
-
2003
-
230 East 71st Street
N/A
Median Price
Past 12 months
Past 12 months
2024
-
2023
-
2022
-
2021
-
2020
-
2019
-
2018
-
2017
-
2016
-
2015
-
2014
-
2013
-
2012
-
2011
-
2010
-
2009
-
2008
-
2007
-
2006
-
2005
-
2004
-
2003
-
230 East 71st Street
N/A
Avg. Price
Past 12 months
Past 12 months
2024
-
2023
-
2022
-
2021
-
2020
-
2019
-
2018
-
2017
-
2016
-
2015
-
2014
-
2013
-
2012
-
2011
-
2010
-
2009
-
2008
-
2007
-
2006
-
2005
-
2004
-
2003
-
230 East 71st Street
N/A
Median Price
Past 12 months
Past 12 months
2024
-
2023
-
2022
-
2021
-
2020
-
2019
-
2018
-
2017
-
2016
-
2015
-
2014
-
2013
-
2012
-
2011
-
2010
-
2009
-
2008
-
2007
-
2006
-
2005
-
2004
-
2003
-
Townsend House
$903
Avg. Price / ft2
Past 12 months
Past 12 months
$1,161
$771
$884
-
$1,426
$873
$1,484
$1,016
$992
$1,185
$1,416
-
$1,084
$1,000
$940
-
$1,540
$1,025
-
$841
$692
-
Townsend House
$1,400,000
Avg. Price
Past 12 months
Past 12 months
$1,966,429
$1,098,333
$1,217,500
-
$1,905,000
$1,697,500
$1,569,000
$1,600,000
$1,666,250
$1,558,333
$2,005,833
-
$1,872,188
$2,325,000
$1,297,500
-
$2,905,000
$923,000
$1,190,133
$1,676,250
$1,284,000
$1,012,000
Townsend House
$1,400,000
Median Price
Past 12 months
Past 12 months
$1,800,000
$760,000
$1,217,500
-
$1,905,000
$1,697,500
$1,675,000
$1,600,000
$1,927,500
$1,940,000
$2,097,500
-
$1,587,500
$2,325,000
$1,297,500
-
$2,773,950
$625,000
$911,500
$1,405,000
$1,180,000
$985,000
Townsend House
N/A
Avg. Price / ft2
Past 12 months
Past 12 months
-
-
-
-
-
-
-
-
-
-
-
-
-
-
-
-
-
-
-
-
-
-
Townsend House
N/A
Avg. Price
Past 12 months
Past 12 months
-
-
-
-
-
-
-
-
-
-
-
-
-
-
-
-
-
$835,000
-
-
-
-
Townsend House
N/A
Median Price
Past 12 months
Past 12 months
-
-
-
-
-
-
-
-
-
-
-
-
-
-
-
-
-
$835,000
-
-
-
-
Townsend House
N/A
Avg. Price / ft2
Past 12 months
Past 12 months
-
$771
$736
-
-
$873
-
-
$817
-
-
-
-
-
$913
-
-
$732
-
-
-
-
Townsend House
N/A
Avg. Price
Past 12 months
Past 12 months
$1,055,000
$682,500
$810,000
-
$815,000
$685,000
-
-
$625,000
$685,000
-
-
-
-
$1,095,000
-
-
$601,667
$835,200
-
-
$550,000
Townsend House
N/A
Median Price
Past 12 months
Past 12 months
$1,150,000
$682,500
$810,000
-
$815,000
$685,000
-
-
$625,000
$685,000
-
-
-
-
$1,095,000
-
-
$605,000
$835,200
-
-
$550,000
Townsend House
$903
Avg. Price / ft2
Past 12 months
Past 12 months
$1,161
-
$1,032
-
-
-
$1,484
$1,016
$1,167
$1,185
$1,416
-
$1,084
$1,000
$968
-
$1,674
$1,317
-
$841
$692
-
Townsend House
$1,400,000
Avg. Price
Past 12 months
Past 12 months
$1,800,000
$1,930,000
$1,625,000
-
-
-
$1,987,500
$1,600,000
$2,013,333
$1,995,000
$2,005,833
-
$1,612,500
$1,550,000
$1,500,000
-
$2,445,000
$1,975,000
$1,900,000
$1,303,333
$1,142,500
$991,667
Townsend House
$1,400,000
Median Price
Past 12 months
Past 12 months
$1,800,000
$1,930,000
$1,625,000
-
-
-
$1,987,500
$1,600,000
$2,100,000
$1,995,000
$2,097,500
-
$1,587,500
$1,550,000
$1,500,000
-
$2,445,000
$1,975,000
$1,900,000
$1,310,000
$1,165,000
$985,000
Townsend House
N/A
Avg. Price / ft2
Past 12 months
Past 12 months
-
-
-
-
$1,426
-
-
-
-
-
-
-
-
-
-
-
$1,406
-
-
-
-
-
Townsend House
N/A
Avg. Price
Past 12 months
Past 12 months
$3,250,000
-
-
-
$2,995,000
$2,710,000
-
-
-
-
-
-
$2,200,000
$3,100,000
-
-
$2,952,900
-
-
$2,795,000
-
-
Townsend House
N/A
Median Price
Past 12 months
Past 12 months
$3,250,000
-
-
-
$2,995,000
$2,710,000
-
-
-
-
-
-
$2,200,000
$3,100,000
-
-
$2,952,900
-
-
$2,795,000
-
-
Townsend House
N/A
Avg. Price / ft2
Past 12 months
Past 12 months
-
-
-
-
-
-
-
-
-
-
-
-
-
-
-
-
-
-
-
-
-
-
Townsend House
N/A
Avg. Price
Past 12 months
Past 12 months
$3,750,000
-
-
-
-
-
-
-
-
-
-
-
$4,350,000
-
-
-
-
-
-
-
-
-
Townsend House
N/A
Median Price
Past 12 months
Past 12 months
$3,750,000
-
-
-
-
-
-
-
-
-
-
-
$4,350,000
-
-
-
-
-
-
-
-
-
Townsend House
N/A
Avg. Price / ft2
Past 12 months
Past 12 months
-
-
-
-
-
-
-
-
-
-
-
-
-
-
-
-
-
-
-
-
-
-
Townsend House
N/A
Avg. Price
Past 12 months
Past 12 months
-
-
-
-
-
-
-
-
-
-
-
-
-
-
-
-
-
-
-
-
-
-
Townsend House
N/A
Median Price
Past 12 months
Past 12 months
-
-
-
-
-
-
-
-
-
-
-
-
-
-
-
-
-
-
-
-
-
-