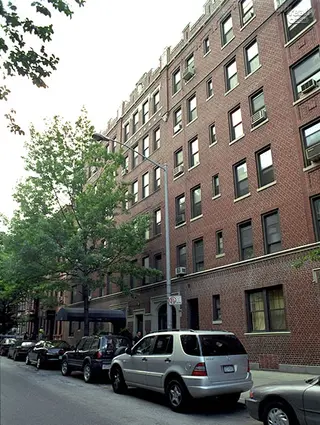
The Sequoia, 345 East 77th Street: Price Comparison
between Second Avenue & First Avenue Building Profile
The Sequoia
$302,600
Avg. Price
Past 12 months
Past 12 months
2024
$516,875
2023
-
2022
-
2021
$386,667
2020
-
2019
$545,000
2018
$638,135
2017
$446,833
2016
$530,279
2015
$461,000
2014
$920,000
2013
$440,000
2012
$393,500
2011
$372,917
2010
-
2009
$448,167
2008
$369,833
2007
$475,000
2006
$423,938
2005
$491,000
2004
$266,643
2003
$245,000
The Sequoia
$302,600
Median Price
Past 12 months
Past 12 months
2024
$515,000
2023
-
2022
-
2021
$400,000
2020
-
2019
$545,000
2018
$531,250
2017
$507,500
2016
$597,338
2015
$452,000
2014
$920,000
2013
$440,000
2012
$339,500
2011
$363,333
2010
-
2009
$424,500
2008
$442,000
2007
$500,000
2006
$412,500
2005
$395,000
2004
$280,000
2003
$245,000
The Sequoia
$301,000
Avg. Price
Past 12 months
Past 12 months
2024
-
2023
-
2022
-
2021
$295,000
2020
-
2019
-
2018
-
2017
$318,000
2016
$280,000
2015
-
2014
-
2013
-
2012
$221,000
2011
$222,500
2010
-
2009
-
2008
$225,000
2007
-
2006
$265,000
2005
-
2004
$222,500
2003
-
The Sequoia
$301,000
Median Price
Past 12 months
Past 12 months
2024
-
2023
-
2022
-
2021
$295,000
2020
-
2019
-
2018
-
2017
$318,000
2016
$280,000
2015
-
2014
-
2013
-
2012
$221,000
2011
$222,500
2010
-
2009
-
2008
$225,000
2007
-
2006
$265,000
2005
-
2004
$222,500
2003
-
The Sequoia
$304,200
Avg. Price
Past 12 months
Past 12 months
2024
$516,875
2023
-
2022
-
2021
$432,500
2020
-
2019
$545,000
2018
$522,400
2017
$511,250
2016
$602,225
2015
$461,000
2014
-
2013
$440,000
2012
$339,500
2011
$491,666
2010
-
2009
$422,250
2008
$442,250
2007
$475,000
2006
$421,800
2005
$377,500
2004
$284,300
2003
$245,000
The Sequoia
$304,200
Median Price
Past 12 months
Past 12 months
2024
$515,000
2023
-
2022
-
2021
$432,500
2020
-
2019
$545,000
2018
$525,000
2017
$511,250
2016
$599,000
2015
$452,000
2014
-
2013
$440,000
2012
$339,500
2011
$491,666
2010
-
2009
$422,250
2008
$442,250
2007
$500,000
2006
$415,000
2005
$376,250
2004
$299,000
2003
$245,000
The Sequoia
N/A
Avg. Price
Past 12 months
Past 12 months
2024
-
2023
-
2022
-
2021
-
2020
-
2019
-
2018
-
2017
-
2016
$815,000
2015
-
2014
$845,000
2013
-
2012
$620,000
2011
$555,000
2010
-
2009
$500,000
2008
-
2007
-
2006
$635,000
2005
$718,000
2004
-
2003
-
The Sequoia
N/A
Median Price
Past 12 months
Past 12 months
2024
-
2023
-
2022
-
2021
-
2020
-
2019
-
2018
-
2017
-
2016
$815,000
2015
-
2014
$845,000
2013
-
2012
$620,000
2011
$555,000
2010
-
2009
$500,000
2008
-
2007
-
2006
$635,000
2005
$718,000
2004
-
2003
-
The Sequoia
N/A
Avg. Price
Past 12 months
Past 12 months
2024
-
2023
-
2022
-
2021
-
2020
-
2019
-
2018
$1,216,809
2017
-
2016
-
2015
-
2014
-
2013
-
2012
-
2011
-
2010
-
2009
-
2008
-
2007
-
2006
-
2005
-
2004
-
2003
-
The Sequoia
N/A
Median Price
Past 12 months
Past 12 months
2024
-
2023
-
2022
-
2021
-
2020
-
2019
-
2018
$1,216,809
2017
-
2016
-
2015
-
2014
-
2013
-
2012
-
2011
-
2010
-
2009
-
2008
-
2007
-
2006
-
2005
-
2004
-
2003
-
The Sequoia
N/A
Avg. Price
Past 12 months
Past 12 months
2024
-
2023
-
2022
-
2021
-
2020
-
2019
-
2018
-
2017
-
2016
-
2015
-
2014
-
2013
-
2012
-
2011
-
2010
-
2009
-
2008
-
2007
-
2006
-
2005
-
2004
-
2003
-
The Sequoia
N/A
Median Price
Past 12 months
Past 12 months
2024
-
2023
-
2022
-
2021
-
2020
-
2019
-
2018
-
2017
-
2016
-
2015
-
2014
-
2013
-
2012
-
2011
-
2010
-
2009
-
2008
-
2007
-
2006
-
2005
-
2004
-
2003
-
The Sequoia
N/A
Avg. Price
Past 12 months
Past 12 months
2024
-
2023
-
2022
-
2021
-
2020
-
2019
-
2018
-
2017
-
2016
-
2015
-
2014
-
2013
-
2012
-
2011
-
2010
-
2009
-
2008
-
2007
-
2006
-
2005
-
2004
-
2003
-
The Sequoia
N/A
Median Price
Past 12 months
Past 12 months
2024
-
2023
-
2022
-
2021
-
2020
-
2019
-
2018
-
2017
-
2016
-
2015
-
2014
-
2013
-
2012
-
2011
-
2010
-
2009
-
2008
-
2007
-
2006
-
2005
-
2004
-
2003
-