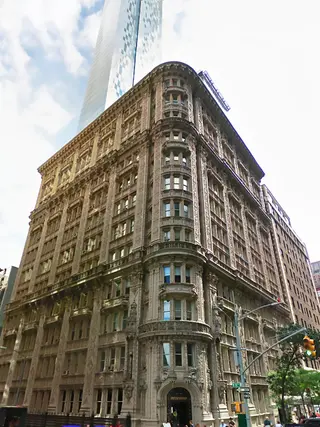
The Alwyn Court, 180 West 58th Street: Price Comparison
at The Southeast corner of Seventh Avenue Building Profile
The Alwyn Court
$1,793,750
Avg. Price
Past 12 months
Past 12 months
2024
$1,397,500
2023
$1,412,500
2022
$2,103,333
2021
$1,462,500
2020
-
2019
-
2018
$1,622,500
2017
$2,227,500
2016
$1,311,053
2015
$2,975,000
2014
$1,961,250
2013
$1,521,833
2012
$1,687,500
2011
$2,000,000
2010
-
2009
$1,375,000
2008
$1,891,667
2007
$1,360,333
2006
$1,675,000
2005
$1,170,000
2004
$1,661,667
2003
$1,440,000
The Alwyn Court
$1,793,750
Median Price
Past 12 months
Past 12 months
2024
$1,397,500
2023
$1,412,500
2022
$1,999,999
2021
$1,462,500
2020
-
2019
-
2018
$1,255,000
2017
$2,150,000
2016
$1,100,000
2015
$2,425,000
2014
$1,872,500
2013
$1,332,500
2012
$1,687,500
2011
$2,000,000
2010
-
2009
$1,375,000
2008
$2,200,000
2007
$1,300,000
2006
$1,675,000
2005
$1,080,000
2004
$1,560,000
2003
$1,440,000
The Alwyn Court
N/A
Avg. Price
Past 12 months
Past 12 months
2024
-
2023
-
2022
-
2021
-
2020
-
2019
-
2018
-
2017
$3,395,000
2016
-
2015
-
2014
-
2013
-
2012
-
2011
-
2010
-
2009
-
2008
-
2007
-
2006
-
2005
-
2004
-
2003
-
The Alwyn Court
N/A
Median Price
Past 12 months
Past 12 months
2024
-
2023
-
2022
-
2021
-
2020
-
2019
-
2018
-
2017
$3,395,000
2016
-
2015
-
2014
-
2013
-
2012
-
2011
-
2010
-
2009
-
2008
-
2007
-
2006
-
2005
-
2004
-
2003
-
The Alwyn Court
$1,075,000
Avg. Price
Past 12 months
Past 12 months
2024
$935,000
2023
$925,000
2022
$1,110,000
2021
-
2020
-
2019
-
2018
$1,163,333
2017
$1,307,500
2016
$1,056,580
2015
$1,150,000
2014
$1,375,000
2013
-
2012
$1,500,000
2011
-
2010
-
2009
$1,375,000
2008
$1,125,000
2007
$1,149,500
2006
-
2005
$938,333
2004
-
2003
-
The Alwyn Court
$1,075,000
Median Price
Past 12 months
Past 12 months
2024
$935,000
2023
$925,000
2022
$1,110,000
2021
-
2020
-
2019
-
2018
$1,010,000
2017
$1,307,500
2016
$1,056,580
2015
$1,150,000
2014
$1,375,000
2013
-
2012
$1,500,000
2011
-
2010
-
2009
$1,375,000
2008
$1,125,000
2007
$1,149,500
2006
-
2005
$885,000
2004
-
2003
-
The Alwyn Court
$2,512,500
Avg. Price
Past 12 months
Past 12 months
2024
$1,860,000
2023
$1,900,000
2022
$1,999,999
2021
$1,462,500
2020
-
2019
-
2018
-
2017
$2,900,000
2016
$1,820,000
2015
$2,425,000
2014
$2,547,500
2013
$1,521,833
2012
$1,875,000
2011
$2,000,000
2010
-
2009
-
2008
$2,275,000
2007
$1,782,000
2006
$1,675,000
2005
$1,517,500
2004
$1,661,667
2003
$1,440,000
The Alwyn Court
$2,512,500
Median Price
Past 12 months
Past 12 months
2024
$1,860,000
2023
$1,900,000
2022
$1,999,999
2021
$1,462,500
2020
-
2019
-
2018
-
2017
$2,900,000
2016
$1,820,000
2015
$2,425,000
2014
$2,547,500
2013
$1,332,500
2012
$1,875,000
2011
$2,000,000
2010
-
2009
-
2008
$2,275,000
2007
$1,782,000
2006
$1,675,000
2005
$1,517,500
2004
$1,560,000
2003
$1,440,000
The Alwyn Court
N/A
Avg. Price
Past 12 months
Past 12 months
2024
-
2023
-
2022
-
2021
-
2020
-
2019
-
2018
$3,000,000
2017
-
2016
-
2015
$5,350,000
2014
-
2013
-
2012
-
2011
-
2010
-
2009
-
2008
-
2007
-
2006
-
2005
-
2004
-
2003
-
The Alwyn Court
N/A
Median Price
Past 12 months
Past 12 months
2024
-
2023
-
2022
-
2021
-
2020
-
2019
-
2018
$3,000,000
2017
-
2016
-
2015
$5,350,000
2014
-
2013
-
2012
-
2011
-
2010
-
2009
-
2008
-
2007
-
2006
-
2005
-
2004
-
2003
-
The Alwyn Court
N/A
Avg. Price
Past 12 months
Past 12 months
2024
-
2023
-
2022
$3,200,000
2021
-
2020
-
2019
-
2018
-
2017
-
2016
-
2015
-
2014
-
2013
-
2012
-
2011
-
2010
-
2009
-
2008
-
2007
-
2006
-
2005
-
2004
-
2003
-
The Alwyn Court
N/A
Median Price
Past 12 months
Past 12 months
2024
-
2023
-
2022
$3,200,000
2021
-
2020
-
2019
-
2018
-
2017
-
2016
-
2015
-
2014
-
2013
-
2012
-
2011
-
2010
-
2009
-
2008
-
2007
-
2006
-
2005
-
2004
-
2003
-
The Alwyn Court
N/A
Avg. Price
Past 12 months
Past 12 months
2024
-
2023
-
2022
-
2021
-
2020
-
2019
-
2018
-
2017
-
2016
-
2015
-
2014
-
2013
-
2012
-
2011
-
2010
-
2009
-
2008
-
2007
-
2006
-
2005
-
2004
-
2003
-
The Alwyn Court
N/A
Median Price
Past 12 months
Past 12 months
2024
-
2023
-
2022
-
2021
-
2020
-
2019
-
2018
-
2017
-
2016
-
2015
-
2014
-
2013
-
2012
-
2011
-
2010
-
2009
-
2008
-
2007
-
2006
-
2005
-
2004
-
2003
-
Berkeley House
N/A
Avg. Price / ft2
Past 12 months
Past 12 months
-
-
$1,940
$1,347
-
$2,287
$1,769
$1,767
-
$1,152
$998
$1,214
$855
$1,287
$1,007
$912
-
$1,655
$796
$873
$634
-
Berkeley House
$2,135,000
Avg. Price
Past 12 months
Past 12 months
$820,000
$1,363,750
$873,000
$995,000
-
$3,750,000
$1,330,857
$1,950,000
$1,850,000
$1,580,714
$1,187,875
$945,227
$1,293,750
$1,292,000
$983,778
$526,925
$921,888
$2,547,500
$643,333
$672,794
$778,361
$273,830
Berkeley House
$2,135,000
Median Price
Past 12 months
Past 12 months
$820,000
$692,500
$873,000
$995,000
-
$3,750,000
$807,000
$1,950,000
$1,850,000
$1,940,000
$763,750
$700,000
$590,000
$1,100,000
$1,071,335
$526,925
$921,888
$2,547,500
$610,000
$523,677
$772,500
$273,830
Berkeley House
N/A
Avg. Price / ft2
Past 12 months
Past 12 months
-
-
$1,940
$1,224
-
-
$1,793
$1,767
-
-
$998
-
-
-
-
-
-
-
-
$833
$514
-
Berkeley House
N/A
Avg. Price
Past 12 months
Past 12 months
-
-
$873,000
$520,000
-
-
$659,000
$795,000
-
$650,000
$568,250
$456,667
$425,000
-
$380,000
-
-
-
-
$387,500
$218,445
$194,045
Berkeley House
N/A
Median Price
Past 12 months
Past 12 months
-
-
$873,000
$520,000
-
-
$750,000
$795,000
-
$650,000
$568,250
$455,000
$425,000
-
$380,000
-
-
-
-
$387,500
$218,445
$194,045
Berkeley House
N/A
Avg. Price / ft2
Past 12 months
Past 12 months
-
-
-
$1,470
-
-
$1,031
-
-
$1,152
-
$1,000
$855
$1,046
-
$912
-
-
$796
$676
-
-
Berkeley House
$820,000
Avg. Price
Past 12 months
Past 12 months
$820,000
$617,500
-
$1,470,000
-
-
$1,246,333
-
$1,200,000
$1,037,500
$815,000
$728,125
$705,000
$971,250
$1,035,000
$526,925
$921,888
-
$643,333
$541,177
$1,350,000
$353,615
Berkeley House
$820,000
Median Price
Past 12 months
Past 12 months
$820,000
$617,500
-
$1,470,000
-
-
$840,000
-
$1,200,000
$1,037,500
$815,000
$692,500
$705,000
$971,250
$1,075,000
$526,925
$921,888
-
$610,000
$541,177
$1,350,000
$353,615
Berkeley House
N/A
Avg. Price / ft2
Past 12 months
Past 12 months
-
-
-
-
-
$2,287
$2,483
-
-
-
-
$1,429
-
$1,771
$1,007
-
-
$1,655
-
$1,307
$754
-
Berkeley House
$3,450,000
Avg. Price
Past 12 months
Past 12 months
-
$3,475,000
-
-
-
$3,750,000
$3,600,000
$3,105,000
$2,500,000
$2,085,000
$2,800,000
$1,786,667
$3,620,000
$2,567,500
$1,208,835
-
-
$2,547,500
-
$1,895,000
$905,000
-
Berkeley House
$3,450,000
Median Price
Past 12 months
Past 12 months
-
$3,475,000
-
-
-
$3,750,000
$3,600,000
$3,105,000
$2,500,000
$2,037,500
$2,800,000
$1,700,000
$3,620,000
$2,567,500
$1,208,835
-
-
$2,547,500
-
$1,895,000
$905,000
-
Berkeley House
N/A
Avg. Price / ft2
Past 12 months
Past 12 months
-
-
-
-
-
-
-
-
-
-
-
-
-
-
-
-
-
-
-
-
-
-
Berkeley House
N/A
Avg. Price
Past 12 months
Past 12 months
-
-
-
-
-
-
-
-
-
-
-
-
-
-
-
-
-
-
-
-
-
-
Berkeley House
N/A
Median Price
Past 12 months
Past 12 months
-
-
-
-
-
-
-
-
-
-
-
-
-
-
-
-
-
-
-
-
-
-
Berkeley House
N/A
Avg. Price / ft2
Past 12 months
Past 12 months
-
-
-
-
-
-
-
-
-
-
-
-
-
-
-
-
-
-
-
-
-
-
Berkeley House
N/A
Avg. Price
Past 12 months
Past 12 months
-
-
-
-
-
-
-
-
-
-
-
-
-
-
-
-
-
-
-
-
-
-
Berkeley House
N/A
Median Price
Past 12 months
Past 12 months
-
-
-
-
-
-
-
-
-
-
-
-
-
-
-
-
-
-
-
-
-
-
135 West 58th Street
N/A
Avg. Price / ft2
Past 12 months
Past 12 months
$853
-
$900
$664
-
$884
-
$1,046
$810
-
-
-
-
$668
-
-
-
$764
-
-
-
-
135 West 58th Street
$1,415,000
Avg. Price
Past 12 months
Past 12 months
$546,000
-
$675,000
$365,000
-
$442,000
$649,000
$642,000
$570,000
-
-
$420,000
-
$398,750
-
$490,990
$463,300
$420,000
$735,000
-
$387,500
-
135 West 58th Street
$1,415,000
Median Price
Past 12 months
Past 12 months
$546,000
-
$675,000
$365,000
-
$442,000
$649,000
$692,500
$570,000
-
-
$420,000
-
$398,750
-
$490,990
$485,000
$420,000
$705,000
-
$387,500
-
135 West 58th Street
N/A
Avg. Price / ft2
Past 12 months
Past 12 months
-
-
-
-
-
$884
-
-
$810
-
-
-
-
-
-
-
-
-
-
-
-
-
135 West 58th Street
N/A
Avg. Price
Past 12 months
Past 12 months
-
-
-
-
-
$442,000
-
$451,000
$405,000
-
-
$420,000
-
-
-
-
-
-
-
-
-
-
135 West 58th Street
N/A
Median Price
Past 12 months
Past 12 months
-
-
-
-
-
$442,000
-
$451,000
$405,000
-
-
$420,000
-
-
-
-
-
-
-
-
-
-
135 West 58th Street
N/A
Avg. Price / ft2
Past 12 months
Past 12 months
-
-
$900
$664
-
-
-
$1,046
-
-
-
-
-
$668
-
-
-
$764
-
-
-
-
135 West 58th Street
N/A
Avg. Price
Past 12 months
Past 12 months
-
-
$675,000
$365,000
-
-
$649,000
$705,667
$735,000
-
-
-
-
$398,750
-
$490,990
-
$420,000
-
-
-
-
135 West 58th Street
N/A
Median Price
Past 12 months
Past 12 months
-
-
$675,000
$365,000
-
-
$649,000
$720,000
$735,000
-
-
-
-
$398,750
-
$490,990
-
$420,000
-
-
-
-
135 West 58th Street
N/A
Avg. Price / ft2
Past 12 months
Past 12 months
$853
-
-
-
-
-
-
-
-
-
-
-
-
-
-
-
-
-
-
-
-
-
135 West 58th Street
N/A
Avg. Price
Past 12 months
Past 12 months
$725,000
-
-
-
-
-
-
-
-
-
-
-
-
-
-
-
-
-
-
-
-
-
135 West 58th Street
N/A
Median Price
Past 12 months
Past 12 months
$725,000
-
-
-
-
-
-
-
-
-
-
-
-
-
-
-
-
-
-
-
-
-
135 West 58th Street
N/A
Avg. Price / ft2
Past 12 months
Past 12 months
-
-
-
-
-
-
-
-
-
-
-
-
-
-
-
-
-
-
-
-
-
-
135 West 58th Street
$1,415,000
Avg. Price
Past 12 months
Past 12 months
-
-
-
-
-
-
-
-
-
-
-
-
-
-
-
-
-
-
-
-
-
-
135 West 58th Street
$1,415,000
Median Price
Past 12 months
Past 12 months
-
-
-
-
-
-
-
-
-
-
-
-
-
-
-
-
-
-
-
-
-
-
135 West 58th Street
N/A
Avg. Price / ft2
Past 12 months
Past 12 months
-
-
-
-
-
-
-
-
-
-
-
-
-
-
-
-
-
-
-
-
-
-
135 West 58th Street
N/A
Avg. Price
Past 12 months
Past 12 months
-
-
-
-
-
-
-
-
-
-
-
-
-
-
-
-
-
-
-
-
-
-
135 West 58th Street
N/A
Median Price
Past 12 months
Past 12 months
-
-
-
-
-
-
-
-
-
-
-
-
-
-
-
-
-
-
-
-
-
-
The Sherwood
N/A
Avg. Price / ft2
Past 12 months
Past 12 months
$967
-
$886
-
$848
$1,188
-
$1,035
$882
$661
$950
$782
-
$763
-
$600
-
$871
$806
-
$490
$553
The Sherwood
$580,000
Avg. Price
Past 12 months
Past 12 months
$580,000
$727,000
$741,250
-
$1,400,000
$1,900,000
$821,667
$922,500
$1,281,667
$595,000
$685,000
$1,000,833
$784,000
$790,500
-
$540,000
$569,000
$591,333
$733,500
$653,500
$454,833
$561,800
The Sherwood
$580,000
Median Price
Past 12 months
Past 12 months
$580,000
$727,000
$580,000
-
$1,400,000
$1,900,000
$805,000
$922,500
$1,075,000
$595,000
$660,000
$937,500
$784,000
$935,000
-
$540,000
$569,000
$585,000
$784,500
$653,500
$422,500
$627,000
The Sherwood
N/A
Avg. Price / ft2
Past 12 months
Past 12 months
-
-
-
-
-
-
-
-
$689
$661
-
-
-
-
-
-
-
-
-
-
-
-
The Sherwood
N/A
Avg. Price
Past 12 months
Past 12 months
-
-
-
-
-
-
-
-
$620,000
$595,000
-
-
-
-
-
-
-
-
-
-
-
-
The Sherwood
N/A
Median Price
Past 12 months
Past 12 months
-
-
-
-
-
-
-
-
$620,000
$595,000
-
-
-
-
-
-
-
-
-
-
-
-
The Sherwood
N/A
Avg. Price / ft2
Past 12 months
Past 12 months
$967
-
$760
-
-
-
-
$1,035
-
-
$950
$739
-
-
-
$600
-
$871
$820
-
$490
$553
The Sherwood
$580,000
Avg. Price
Past 12 months
Past 12 months
$580,000
$727,000
$566,667
-
-
-
$882,500
$922,500
-
-
$652,500
$1,032,500
$784,000
$437,500
-
$540,000
$569,000
$591,333
$682,500
$722,000
$471,000
$510,667
The Sherwood
$580,000
Median Price
Past 12 months
Past 12 months
$580,000
$727,000
$560,000
-
-
-
$882,500
$922,500
-
-
$652,500
$1,032,500
$784,000
$437,500
-
$540,000
$569,000
$585,000
$682,500
$722,000
$471,000
$600,000
The Sherwood
N/A
Avg. Price / ft2
Past 12 months
Past 12 months
-
-
$1,265
-
-
-
-
-
$1,075
-
-
$825
-
$763
-
-
-
-
$780
-
-
-
The Sherwood
N/A
Avg. Price
Past 12 months
Past 12 months
-
-
$1,265,000
-
-
-
-
-
$1,075,000
-
-
$937,500
-
$967,000
-
-
-
-
$784,500
$585,000
$422,500
$638,500
The Sherwood
N/A
Median Price
Past 12 months
Past 12 months
-
-
$1,265,000
-
-
-
-
-
$1,075,000
-
-
$937,500
-
$967,000
-
-
-
-
$784,500
$585,000
$422,500
$638,500
The Sherwood
N/A
Avg. Price / ft2
Past 12 months
Past 12 months
-
-
-
-
$848
$1,188
-
-
-
-
-
-
-
-
-
-
-
-
-
-
-
-
The Sherwood
N/A
Avg. Price
Past 12 months
Past 12 months
-
-
-
-
$1,400,000
$1,900,000
-
-
$2,150,000
-
-
-
-
-
-
-
-
-
-
-
-
-
The Sherwood
N/A
Median Price
Past 12 months
Past 12 months
-
-
-
-
$1,400,000
$1,900,000
-
-
$2,150,000
-
-
-
-
-
-
-
-
-
-
-
-
-
The Sherwood
N/A
Avg. Price / ft2
Past 12 months
Past 12 months
-
-
-
-
-
-
-
-
-
-
-
-
-
-
-
-
-
-
-
-
-
-
The Sherwood
N/A
Avg. Price
Past 12 months
Past 12 months
-
-
-
-
-
-
-
-
-
-
-
-
-
-
-
-
-
-
-
-
-
-
The Sherwood
N/A
Median Price
Past 12 months
Past 12 months
-
-
-
-
-
-
-
-
-
-
-
-
-
-
-
-
-
-
-
-
-
-
The Sherwood
N/A
Avg. Price / ft2
Past 12 months
Past 12 months
-
-
-
-
-
-
-
-
-
-
-
-
-
-
-
-
-
-
-
-
-
-
The Sherwood
N/A
Avg. Price
Past 12 months
Past 12 months
-
-
-
-
-
-
-
-
-
-
-
-
-
-
-
-
-
-
-
-
-
-
The Sherwood
N/A
Median Price
Past 12 months
Past 12 months
-
-
-
-
-
-
-
-
-
-
-
-
-
-
-
-
-
-
-
-
-
-
27 West 55th Street
N/A
Avg. Price / ft2
Past 12 months
Past 12 months
$841
-
$1,023
$917
-
-
-
-
$955
$1,000
$968
-
-
-
$700
-
-
$917
-
$628
-
-
27 West 55th Street
$760,000
Avg. Price
Past 12 months
Past 12 months
$799,000
-
$798,000
$715,000
$775,000
-
$737,500
$825,000
$797,500
$600,000
$755,000
$758,000
-
$685,000
$595,000
-
-
$550,000
-
$565,000
-
$460,000
27 West 55th Street
$760,000
Median Price
Past 12 months
Past 12 months
$799,000
-
$798,000
$715,000
$775,000
-
$737,500
$825,000
$797,500
$600,000
$755,000
$758,000
-
$685,000
$595,000
-
-
$550,000
-
$565,000
-
$460,000
27 West 55th Street
N/A
Avg. Price / ft2
Past 12 months
Past 12 months
-
-
-
-
-
-
-
-
-
-
-
-
-
-
-
-
-
-
-
-
-
-
27 West 55th Street
N/A
Avg. Price
Past 12 months
Past 12 months
-
-
-
-
-
-
-
-
-
-
-
-
-
-
-
-
-
-
-
-
-
-
27 West 55th Street
N/A
Median Price
Past 12 months
Past 12 months
-
-
-
-
-
-
-
-
-
-
-
-
-
-
-
-
-
-
-
-
-
-
27 West 55th Street
N/A
Avg. Price / ft2
Past 12 months
Past 12 months
$841
-
-
-
-
-
-
-
-
$1,000
-
-
-
-
-
-
-
$917
-
$628
-
-
27 West 55th Street
N/A
Avg. Price
Past 12 months
Past 12 months
$799,000
-
-
-
-
-
$650,000
-
-
$600,000
-
-
-
-
-
-
-
$550,000
-
$455,000
-
-
27 West 55th Street
N/A
Median Price
Past 12 months
Past 12 months
$799,000
-
-
-
-
-
$650,000
-
-
$600,000
-
-
-
-
-
-
-
$550,000
-
$455,000
-
-
27 West 55th Street
N/A
Avg. Price / ft2
Past 12 months
Past 12 months
-
-
$1,023
$917
-
-
-
-
$955
-
$968
-
-
-
$700
-
-
-
-
-
-
-
27 West 55th Street
$760,000
Avg. Price
Past 12 months
Past 12 months
-
-
$798,000
$715,000
$775,000
-
$825,000
$825,000
$797,500
-
$755,000
$758,000
-
$685,000
$595,000
-
-
-
-
$675,000
-
$460,000
27 West 55th Street
$760,000
Median Price
Past 12 months
Past 12 months
-
-
$798,000
$715,000
$775,000
-
$825,000
$825,000
$797,500
-
$755,000
$758,000
-
$685,000
$595,000
-
-
-
-
$675,000
-
$460,000
27 West 55th Street
N/A
Avg. Price / ft2
Past 12 months
Past 12 months
-
-
-
-
-
-
-
-
-
-
-
-
-
-
-
-
-
-
-
-
-
-
27 West 55th Street
N/A
Avg. Price
Past 12 months
Past 12 months
-
-
-
-
-
-
-
-
-
-
-
-
-
-
-
-
-
-
-
-
-
-
27 West 55th Street
N/A
Median Price
Past 12 months
Past 12 months
-
-
-
-
-
-
-
-
-
-
-
-
-
-
-
-
-
-
-
-
-
-
27 West 55th Street
N/A
Avg. Price / ft2
Past 12 months
Past 12 months
-
-
-
-
-
-
-
-
-
-
-
-
-
-
-
-
-
-
-
-
-
-
27 West 55th Street
N/A
Avg. Price
Past 12 months
Past 12 months
-
-
-
-
-
-
-
-
-
-
-
-
-
-
-
-
-
-
-
-
-
-
27 West 55th Street
N/A
Median Price
Past 12 months
Past 12 months
-
-
-
-
-
-
-
-
-
-
-
-
-
-
-
-
-
-
-
-
-
-
Carnegie House
$170
Avg. Price / ft2
Past 12 months
Past 12 months
$284
$206
$329
$324
$214
$335
$586
$615
$659
$730
$731
$711
$603
$620
$597
$623
$727
$647
$732
$562
$475
$415
Carnegie House
$169,333
Avg. Price
Past 12 months
Past 12 months
$329,188
$207,167
$313,000
$240,250
$297,000
$273,286
$466,182
$660,692
$743,667
$717,180
$594,000
$696,231
$578,715
$686,313
$626,950
$570,643
$613,432
$569,326
$764,289
$459,321
$526,036
$335,897
Carnegie House
$169,000
Median Price
Past 12 months
Past 12 months
$306,125
$209,000
$239,000
$206,250
$297,000
$249,000
$380,000
$530,000
$795,000
$575,625
$620,000
$637,500
$465,000
$557,500
$557,500
$512,500
$542,500
$575,000
$580,000
$475,000
$432,500
$330,000
Carnegie House
$148
Avg. Price / ft2
Past 12 months
Past 12 months
-
-
-
$433
-
$349
$656
$659
$633
$687
$737
$695
$570
-
$500
$625
$713
$615
$738
$617
$486
$394
Carnegie House
$89,000
Avg. Price
Past 12 months
Past 12 months
-
-
-
$215,000
-
$201,333
$332,333
$352,500
$365,000
$365,944
$363,167
$307,786
$342,000
-
$325,000
$337,375
$396,313
$423,333
$330,300
$279,000
$235,000
$227,250
Carnegie House
$89,000
Median Price
Past 12 months
Past 12 months
-
-
-
$215,000
-
$249,000
$335,000
$352,500
$365,000
$360,000
$364,500
$307,000
$342,000
-
$325,000
$332,500
$379,500
$430,000
$335,000
$275,000
$230,000
$229,000
Carnegie House
N/A
Avg. Price / ft2
Past 12 months
Past 12 months
$371
$223
$329
$269
-
$222
$534
$573
$625
$666
$723
$642
$592
$553
$576
$618
$740
$623
$615
$515
$439
$437
Carnegie House
N/A
Avg. Price
Past 12 months
Past 12 months
$352,250
$173,250
$313,000
$252,875
-
$192,500
$507,500
$496,500
$482,000
$548,942
$742,167
$599,750
$403,184
$509,600
$498,000
$598,500
$595,000
$535,782
$504,250
$424,094
$390,667
$348,750
Carnegie House
N/A
Median Price
Past 12 months
Past 12 months
$352,250
$170,000
$239,000
$206,250
-
$192,500
$507,500
$522,500
$482,000
$575,000
$714,000
$615,000
$332,290
$495,000
$520,000
$525,000
$625,000
$575,000
$545,000
$470,000
$392,000
$352,500
Carnegie House
$192
Avg. Price / ft2
Past 12 months
Past 12 months
$258
$161
-
-
$214
$519
$492
$648
$682
$815
-
$698
$708
$763
$616
$629
$732
$691
$687
$621
$528
-
Carnegie House
$250,000
Avg. Price
Past 12 months
Past 12 months
$310,000
$250,000
-
-
$297,000
$649,000
$630,000
$896,667
$919,000
$1,030,714
$1,090,000
$835,000
$982,500
$1,003,250
$758,167
$755,000
$994,000
$868,500
$937,900
$677,600
$706,277
-
Carnegie House
$250,000
Median Price
Past 12 months
Past 12 months
$310,000
$250,000
-
-
$297,000
$649,000
$630,000
$925,000
$900,000
$960,000
$1,090,000
$750,000
$982,500
$1,003,250
$759,500
$755,000
$1,050,000
$863,500
$962,500
$675,000
$661,440
-
Carnegie House
N/A
Avg. Price / ft2
Past 12 months
Past 12 months
$137
$200
-
-
-
-
$573
$678
$650
$874
-
$900
$615
$669
$738
$627
-
-
$1,009
-
$542
-
Carnegie House
N/A
Avg. Price
Past 12 months
Past 12 months
$302,250
$300,000
-
-
-
-
$859,000
$965,000
$1,135,000
$1,768,333
-
$1,443,750
$922,000
$936,000
$1,180,000
$940,000
-
-
$1,625,000
-
$975,000
-
Carnegie House
N/A
Median Price
Past 12 months
Past 12 months
$302,250
$300,000
-
-
-
-
$859,000
$965,000
$1,135,000
$1,485,000
-
$1,337,500
$922,000
$936,000
$1,180,000
$940,000
-
-
$1,625,000
-
$975,000
-
Carnegie House
N/A
Avg. Price / ft2
Past 12 months
Past 12 months
-
-
-
-
-
-
-
-
-
-
-
-
$628
-
-
-
-
-
-
-
-
-
Carnegie House
N/A
Avg. Price
Past 12 months
Past 12 months
-
-
-
-
-
-
-
-
-
-
-
-
$1,130,000
-
-
-
-
-
-
-
$1,225,000
-
Carnegie House
N/A
Median Price
Past 12 months
Past 12 months
-
-
-
-
-
-
-
-
-
-
-
-
$1,130,000
-
-
-
-
-
-
-
$1,225,000
-
Carnegie House
N/A
Avg. Price / ft2
Past 12 months
Past 12 months
-
-
-
-
-
-
-
-
-
-
-
-
-
-
-
-
-
-
-
-
-
-
Carnegie House
N/A
Avg. Price
Past 12 months
Past 12 months
-
-
-
-
-
-
-
-
-
-
-
-
-
-
-
-
-
-
-
-
-
-
Carnegie House
N/A
Median Price
Past 12 months
Past 12 months
-
-
-
-
-
-
-
-
-
-
-
-
-
-
-
-
-
-
-
-
-
-
Fred Leighton Building
$341
Avg. Price / ft2
Past 12 months
Past 12 months
-
$1,903
$1,321
-
-
-
$1,884
-
-
-
-
-
$1,786
-
-
-
-
-
-
-
-
-
Fred Leighton Building
$4,237,500
Avg. Price
Past 12 months
Past 12 months
-
$4,852,500
$3,700,000
-
$4,725,000
-
$6,500,000
-
-
-
-
$1,775,000
$6,250,000
-
-
-
-
$3,750,000
$2,085,950
$3,700,000
$2,800,000
-
Fred Leighton Building
$4,975,000
Median Price
Past 12 months
Past 12 months
-
$4,852,500
$3,700,000
-
$4,725,000
-
$6,500,000
-
-
-
-
$1,775,000
$6,250,000
-
-
-
-
$3,750,000
$2,085,950
$3,700,000
$2,800,000
-
Fred Leighton Building
N/A
Avg. Price / ft2
Past 12 months
Past 12 months
-
-
-
-
-
-
-
-
-
-
-
-
-
-
-
-
-
-
-
-
-
-
Fred Leighton Building
N/A
Avg. Price
Past 12 months
Past 12 months
-
-
-
-
-
-
-
-
-
-
-
-
-
-
-
-
-
-
-
-
-
-
Fred Leighton Building
N/A
Median Price
Past 12 months
Past 12 months
-
-
-
-
-
-
-
-
-
-
-
-
-
-
-
-
-
-
-
-
-
-
Fred Leighton Building
N/A
Avg. Price / ft2
Past 12 months
Past 12 months
-
-
-
-
-
-
$1,884
-
-
-
-
-
-
-
-
-
-
-
-
-
-
-
Fred Leighton Building
N/A
Avg. Price
Past 12 months
Past 12 months
-
-
-
-
-
-
$6,500,000
-
-
-
-
-
-
-
-
-
-
-
-
-
$2,800,000
-
Fred Leighton Building
N/A
Median Price
Past 12 months
Past 12 months
-
-
-
-
-
-
$6,500,000
-
-
-
-
-
-
-
-
-
-
-
-
-
$2,800,000
-
Fred Leighton Building
$341
Avg. Price / ft2
Past 12 months
Past 12 months
-
-
$1,321
-
-
-
-
-
-
-
-
-
-
-
-
-
-
-
-
-
-
-
Fred Leighton Building
$4,237,500
Avg. Price
Past 12 months
Past 12 months
-
-
$3,700,000
-
$4,725,000
-
-
-
-
-
-
$1,775,000
-
-
-
-
-
$3,750,000
$2,085,950
$3,700,000
-
-
Fred Leighton Building
$4,975,000
Median Price
Past 12 months
Past 12 months
-
-
$3,700,000
-
$4,725,000
-
-
-
-
-
-
$1,775,000
-
-
-
-
-
$3,750,000
$2,085,950
$3,700,000
-
-
Fred Leighton Building
N/A
Avg. Price / ft2
Past 12 months
Past 12 months
-
$1,903
-
-
-
-
-
-
-
-
-
-
$1,786
-
-
-
-
-
-
-
-
-
Fred Leighton Building
N/A
Avg. Price
Past 12 months
Past 12 months
-
$7,650,000
-
-
-
-
-
-
-
-
-
-
$6,250,000
-
-
-
-
-
-
-
-
-
Fred Leighton Building
N/A
Median Price
Past 12 months
Past 12 months
-
$7,650,000
-
-
-
-
-
-
-
-
-
-
$6,250,000
-
-
-
-
-
-
-
-
-
Fred Leighton Building
N/A
Avg. Price / ft2
Past 12 months
Past 12 months
-
-
-
-
-
-
-
-
-
-
-
-
-
-
-
-
-
-
-
-
-
-
Fred Leighton Building
N/A
Avg. Price
Past 12 months
Past 12 months
-
-
-
-
-
-
-
-
-
-
-
-
-
-
-
-
-
-
-
-
-
-
Fred Leighton Building
N/A
Median Price
Past 12 months
Past 12 months
-
-
-
-
-
-
-
-
-
-
-
-
-
-
-
-
-
-
-
-
-
-
Ablemarle
$629
Avg. Price / ft2
Past 12 months
Past 12 months
$842
-
$1,086
$910
-
-
$782
$1,009
$823
$899
$731
$805
$600
-
-
$723
$833
$790
$790
$665
$597
$419
Ablemarle
$503,333
Avg. Price
Past 12 months
Past 12 months
$786,000
$650,000
$1,195,000
$595,000
-
-
$624,000
$868,800
$593,000
$732,358
$721,000
$611,714
$285,000
$280,000
-
$591,667
$660,833
$518,333
$685,000
$561,786
$450,214
$316,333
Ablemarle
$520,000
Median Price
Past 12 months
Past 12 months
$870,000
$650,000
$1,195,000
$595,000
-
-
$533,000
$725,000
$526,000
$550,000
$625,000
$530,000
$285,000
$280,000
-
$490,000
$528,500
$520,000
$685,000
$525,000
$417,500
$274,000
Ablemarle
N/A
Avg. Price / ft2
Past 12 months
Past 12 months
-
-
-
-
-
-
-
-
-
-
-
-
-
-
-
-
-
-
-
-
-
-
Ablemarle
N/A
Avg. Price
Past 12 months
Past 12 months
-
-
-
-
-
-
-
-
-
-
-
-
-
-
-
-
-
-
-
-
-
-
Ablemarle
N/A
Median Price
Past 12 months
Past 12 months
-
-
-
-
-
-
-
-
-
-
-
-
-
-
-
-
-
-
-
-
-
-
Ablemarle
$629
Avg. Price / ft2
Past 12 months
Past 12 months
$826
-
-
$910
-
-
$751
-
$760
$768
$731
$782
$600
-
-
$706
$813
$790
-
-
$600
$419
Ablemarle
$503,333
Avg. Price
Past 12 months
Past 12 months
$573,000
$650,000
-
$595,000
-
-
$510,333
$657,167
$521,800
$513,597
$656,250
$525,400
$285,000
$280,000
-
$480,000
$521,750
$518,333
$580,000
$470,000
$400,909
$316,333
Ablemarle
$520,000
Median Price
Past 12 months
Past 12 months
$573,000
$650,000
-
$595,000
-
-
$530,000
$706,500
$500,000
$499,000
$585,000
$520,000
$285,000
$280,000
-
$480,000
$521,750
$520,000
$580,000
$479,500
$400,000
$274,000
Ablemarle
N/A
Avg. Price / ft2
Past 12 months
Past 12 months
$851
-
$1,086
-
-
-
$877
$1,009
$949
$964
-
$828
-
-
-
$741
$854
-
$790
$665
$592
-
Ablemarle
N/A
Avg. Price
Past 12 months
Past 12 months
$892,500
-
$1,195,000
-
-
-
$965,000
$1,186,250
$949,000
$1,060,500
$980,000
$827,500
-
-
-
$815,000
$939,000
-
$790,000
$684,167
$631,000
-
Ablemarle
N/A
Median Price
Past 12 months
Past 12 months
$892,500
-
$1,195,000
-
-
-
$965,000
$1,186,250
$949,000
$1,060,500
$980,000
$827,500
-
-
-
$815,000
$939,000
-
$790,000
$665,000
$640,000
-
Ablemarle
N/A
Avg. Price / ft2
Past 12 months
Past 12 months
-
-
-
-
-
-
-
-
-
-
-
-
-
-
-
-
-
-
-
-
-
-
Ablemarle
N/A
Avg. Price
Past 12 months
Past 12 months
-
-
-
-
-
-
-
-
-
-
-
-
-
-
-
-
-
-
-
-
-
-
Ablemarle
N/A
Median Price
Past 12 months
Past 12 months
-
-
-
-
-
-
-
-
-
-
-
-
-
-
-
-
-
-
-
-
-
-
Ablemarle
N/A
Avg. Price / ft2
Past 12 months
Past 12 months
-
-
-
-
-
-
-
-
-
-
-
-
-
-
-
-
-
-
-
-
-
-
Ablemarle
N/A
Avg. Price
Past 12 months
Past 12 months
-
-
-
-
-
-
-
-
-
-
-
-
-
-
-
-
-
-
-
-
-
-
Ablemarle
N/A
Median Price
Past 12 months
Past 12 months
-
-
-
-
-
-
-
-
-
-
-
-
-
-
-
-
-
-
-
-
-
-
The Adlon
$757
Avg. Price / ft2
Past 12 months
Past 12 months
$830
$702
$929
-
-
$1,041
$1,140
$1,106
$846
$966
$968
$812
$673
$717
$740
$692
$921
$768
$758
$653
-
$454
The Adlon
$748,833
Avg. Price
Past 12 months
Past 12 months
$770,667
$630,000
$1,036,250
$1,107,969
-
$1,145,000
$677,500
$886,450
$744,200
$871,864
$838,125
$675,850
$663,750
$664,129
$781,000
$818,333
$741,500
$623,389
$736,230
$550,181
$631,273
$389,646
The Adlon
$566,500
Median Price
Past 12 months
Past 12 months
$685,000
$525,000
$1,085,000
$1,107,969
-
$1,145,000
$677,500
$767,000
$592,000
$896,500
$857,500
$689,250
$665,000
$615,000
$645,000
$750,000
$692,500
$585,000
$686,150
$560,000
$455,000
$333,500
The Adlon
N/A
Avg. Price / ft2
Past 12 months
Past 12 months
-
-
-
-
-
-
-
-
-
-
-
-
-
-
-
-
-
-
-
-
-
-
The Adlon
N/A
Avg. Price
Past 12 months
Past 12 months
-
-
-
-
-
-
-
-
-
-
-
-
-
-
-
-
-
-
-
-
-
-
The Adlon
N/A
Median Price
Past 12 months
Past 12 months
-
-
-
-
-
-
-
-
-
-
-
-
-
-
-
-
-
-
-
-
-
-
The Adlon
$623
Avg. Price / ft2
Past 12 months
Past 12 months
$753
$702
-
-
-
-
$1,140
$1,124
$846
$980
$918
$854
-
$728
$721
-
$855
$768
-
$653
-
$458
The Adlon
$518,250
Avg. Price
Past 12 months
Past 12 months
$527,000
$507,500
$772,500
$1,107,969
-
-
$677,500
$605,333
$557,333
$744,100
$671,000
$608,083
-
$567,750
$505,000
-
$624,750
$550,083
$653,333
$488,150
$631,273
$382,117
The Adlon
$535,000
Median Price
Past 12 months
Past 12 months
$527,000
$507,500
$772,500
$1,107,969
-
-
$677,500
$549,000
$550,000
$699,000
$680,000
$557,500
-
$600,000
$505,000
-
$582,500
$542,000
$525,000
$499,000
$455,000
$331,750
The Adlon
$864
Avg. Price / ft2
Past 12 months
Past 12 months
$823
-
$929
-
-
$1,041
-
$1,088
-
$961
$1,019
$728
$673
$689
$752
$692
$986
-
$758
-
-
$436
The Adlon
$1,210,000
Avg. Price
Past 12 months
Past 12 months
$1,100,000
$875,000
$1,300,000
-
-
$1,145,000
-
$1,094,167
$1,024,500
$1,123,000
$1,116,667
$777,500
$663,750
$912,500
$965,000
$818,333
$975,000
$842,500
$860,575
$689,750
-
$480,000
The Adlon
$1,210,000
Median Price
Past 12 months
Past 12 months
$1,100,000
$875,000
$1,300,000
-
-
$1,145,000
-
$1,087,500
$1,024,500
$1,150,000
$1,050,000
$732,500
$665,000
$912,500
$675,000
$750,000
$975,000
$842,500
$847,000
$684,500
-
$480,000
The Adlon
N/A
Avg. Price / ft2
Past 12 months
Past 12 months
-
-
-
-
-
-
-
-
-
-
-
-
-
-
-
-
-
-
-
-
-
-
The Adlon
N/A
Avg. Price
Past 12 months
Past 12 months
-
-
-
-
-
-
-
$1,950,000
-
-
-
-
-
-
-
-
-
-
-
-
-
-
The Adlon
N/A
Median Price
Past 12 months
Past 12 months
-
-
-
-
-
-
-
$1,950,000
-
-
-
-
-
-
-
-
-
-
-
-
-
-
The Adlon
N/A
Avg. Price / ft2
Past 12 months
Past 12 months
-
-
-
-
-
-
-
-
-
-
-
-
-
-
-
-
-
-
-
-
-
-
The Adlon
N/A
Avg. Price
Past 12 months
Past 12 months
-
-
-
-
-
-
-
-
-
-
-
-
-
-
-
-
-
-
-
-
-
-
The Adlon
N/A
Median Price
Past 12 months
Past 12 months
-
-
-
-
-
-
-
-
-
-
-
-
-
-
-
-
-
-
-
-
-
-
The Adlon
N/A
Avg. Price / ft2
Past 12 months
Past 12 months
-
-
-
-
-
-
-
-
-
-
-
-
-
-
-
-
-
-
-
-
-
-
The Adlon
N/A
Avg. Price
Past 12 months
Past 12 months
-
-
-
-
-
-
-
-
-
-
-
-
-
-
-
-
-
-
-
-
-
-
The Adlon
N/A
Median Price
Past 12 months
Past 12 months
-
-
-
-
-
-
-
-
-
-
-
-
-
-
-
-
-
-
-
-
-
-