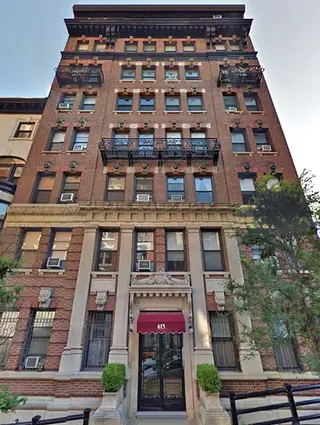
The Huntington, 615 West 113th Street: Price Comparison
between Broadway & Riverside Drive Building Profile
The Huntington
$480,000
Avg. Price
Past 12 months
Past 12 months
2024
$545,833
2023
$401,250
2022
$334,000
2021
$402,500
2020
-
2019
$535,000
2018
$685,000
2017
$467,000
2016
$397,500
2015
$526,500
2014
$394,500
2013
$359,000
2012
$375,000
2011
$345,000
2010
-
2009
$443,500
2008
$377,875
2007
$298,000
2006
-
2005
$369,286
2004
$388,750
2003
-
The Huntington
$515,000
Median Price
Past 12 months
Past 12 months
2024
$545,000
2023
$397,500
2022
$334,000
2021
$402,500
2020
-
2019
$535,000
2018
$685,000
2017
$362,500
2016
$397,500
2015
$495,000
2014
$384,500
2013
$359,000
2012
$375,000
2011
$345,000
2010
-
2009
$439,000
2008
$372,000
2007
$224,000
2006
-
2005
$383,000
2004
$405,000
2003
-
The Huntington
N/A
Avg. Price
Past 12 months
Past 12 months
2024
$315,000
2023
$295,000
2022
$334,000
2021
-
2020
-
2019
-
2018
-
2017
$325,000
2016
$285,000
2015
$304,500
2014
$300,000
2013
-
2012
-
2011
$235,000
2010
-
2009
-
2008
$259,500
2007
$217,000
2006
-
2005
$210,000
2004
-
2003
-
The Huntington
N/A
Median Price
Past 12 months
Past 12 months
2024
$315,000
2023
$295,000
2022
$334,000
2021
-
2020
-
2019
-
2018
-
2017
$325,000
2016
$285,000
2015
$304,500
2014
$300,000
2013
-
2012
-
2011
$235,000
2010
-
2009
-
2008
$259,500
2007
$217,000
2006
-
2005
$210,000
2004
-
2003
-
The Huntington
$570,000
Avg. Price
Past 12 months
Past 12 months
2024
$545,000
2023
$436,667
2022
-
2021
$402,500
2020
-
2019
$535,000
2018
$625,000
2017
$346,500
2016
$510,000
2015
$495,000
2014
$469,000
2013
$359,000
2012
$375,000
2011
$455,000
2010
-
2009
$443,500
2008
$455,000
2007
$460,000
2006
-
2005
$395,833
2004
$381,667
2003
-
The Huntington
$570,000
Median Price
Past 12 months
Past 12 months
2024
$545,000
2023
$500,000
2022
-
2021
$402,500
2020
-
2019
$535,000
2018
$625,000
2017
$346,500
2016
$510,000
2015
$495,000
2014
$469,000
2013
$359,000
2012
$375,000
2011
$455,000
2010
-
2009
$439,000
2008
$455,000
2007
$460,000
2006
-
2005
$398,500
2004
$400,000
2003
-
The Huntington
N/A
Avg. Price
Past 12 months
Past 12 months
2024
$777,500
2023
-
2022
-
2021
-
2020
-
2019
-
2018
$745,000
2017
$850,000
2016
-
2015
$780,000
2014
$599,000
2013
-
2012
-
2011
-
2010
-
2009
-
2008
$537,500
2007
-
2006
-
2005
-
2004
$410,000
2003
-
The Huntington
N/A
Median Price
Past 12 months
Past 12 months
2024
$777,500
2023
-
2022
-
2021
-
2020
-
2019
-
2018
$745,000
2017
$850,000
2016
-
2015
$780,000
2014
$599,000
2013
-
2012
-
2011
-
2010
-
2009
-
2008
$537,500
2007
-
2006
-
2005
-
2004
$410,000
2003
-
The Huntington
N/A
Avg. Price
Past 12 months
Past 12 months
2024
-
2023
-
2022
-
2021
-
2020
-
2019
-
2018
-
2017
-
2016
-
2015
-
2014
-
2013
-
2012
-
2011
-
2010
-
2009
-
2008
-
2007
-
2006
-
2005
-
2004
-
2003
-
The Huntington
N/A
Median Price
Past 12 months
Past 12 months
2024
-
2023
-
2022
-
2021
-
2020
-
2019
-
2018
-
2017
-
2016
-
2015
-
2014
-
2013
-
2012
-
2011
-
2010
-
2009
-
2008
-
2007
-
2006
-
2005
-
2004
-
2003
-
The Huntington
N/A
Avg. Price
Past 12 months
Past 12 months
2024
-
2023
-
2022
-
2021
-
2020
-
2019
-
2018
-
2017
-
2016
-
2015
-
2014
-
2013
-
2012
-
2011
-
2010
-
2009
-
2008
-
2007
-
2006
-
2005
-
2004
-
2003
-
The Huntington
N/A
Median Price
Past 12 months
Past 12 months
2024
-
2023
-
2022
-
2021
-
2020
-
2019
-
2018
-
2017
-
2016
-
2015
-
2014
-
2013
-
2012
-
2011
-
2010
-
2009
-
2008
-
2007
-
2006
-
2005
-
2004
-
2003
-