67 Park Avenue: Price Comparison
at The Northeast corner of East 38th street Building Profile
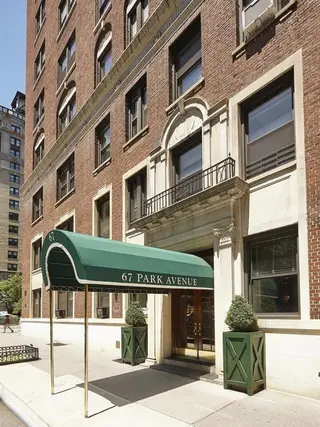
67 Park Avenue
$680,000
Avg. Price
Past 12 months
Past 12 months
2024
$1,060,250
2023
$563,333
2022
$698,750
2021
$655,000
2020
$640,000
2019
$1,022,000
2018
$1,383,750
2017
$1,140,000
2016
$1,327,500
2015
$1,082,500
2014
$1,273,333
2013
$827,667
2012
$2,450,000
2011
$1,050,750
2010
$1,200,000
2009
$505,000
2008
$938,750
2007
$1,279,000
2006
$876,000
2005
$479,200
2004
$494,800
2003
$502,500
67 Park Avenue
$680,000
Median Price
Past 12 months
Past 12 months
2024
$1,063,250
2023
$575,000
2022
$698,750
2021
$655,000
2020
$640,000
2019
$760,000
2018
$1,205,000
2017
$850,000
2016
$1,465,000
2015
$1,082,500
2014
$845,000
2013
$600,500
2012
$2,450,000
2011
$1,111,500
2010
$1,200,000
2009
$505,000
2008
$867,500
2007
$945,000
2006
$752,500
2005
$475,000
2004
$460,000
2003
$502,500
67 Park Avenue
N/A
Avg. Price
Past 12 months
Past 12 months
2024
-
2023
-
2022
-
2021
-
2020
-
2019
-
2018
-
2017
$975,000
2016
-
2015
-
2014
$780,000
2013
-
2012
-
2011
-
2010
-
2009
-
2008
-
2007
-
2006
-
2005
-
2004
-
2003
-
67 Park Avenue
N/A
Median Price
Past 12 months
Past 12 months
2024
-
2023
-
2022
-
2021
-
2020
-
2019
-
2018
-
2017
$975,000
2016
-
2015
-
2014
$780,000
2013
-
2012
-
2011
-
2010
-
2009
-
2008
-
2007
-
2006
-
2005
-
2004
-
2003
-
67 Park Avenue
$680,000
Avg. Price
Past 12 months
Past 12 months
2024
$645,000
2023
$563,333
2022
$698,750
2021
$655,000
2020
$640,000
2019
$643,333
2018
$805,000
2017
$726,250
2016
$767,500
2015
$915,000
2014
$845,000
2013
$583,200
2012
-
2011
$686,500
2010
-
2009
$505,000
2008
$768,333
2007
$693,333
2006
$701,333
2005
$479,200
2004
$458,333
2003
$640,000
67 Park Avenue
$680,000
Median Price
Past 12 months
Past 12 months
2024
$660,000
2023
$575,000
2022
$698,750
2021
$655,000
2020
$640,000
2019
$600,000
2018
$805,000
2017
$730,000
2016
$767,500
2015
$915,000
2014
$845,000
2013
$586,000
2012
-
2011
$686,500
2010
-
2009
$505,000
2008
$850,000
2007
$645,000
2006
$735,000
2005
$475,000
2004
$460,000
2003
$640,000
67 Park Avenue
N/A
Avg. Price
Past 12 months
Past 12 months
2024
$1,475,750
2023
-
2022
-
2021
-
2020
-
2019
$1,590,000
2018
$1,962,500
2017
$1,400,000
2016
$1,607,500
2015
$1,250,000
2014
$2,195,000
2013
-
2012
-
2011
$1,430,000
2010
$1,200,000
2009
-
2008
$1,450,000
2007
$1,515,000
2006
$1,400,000
2005
-
2004
$999,000
2003
-
67 Park Avenue
N/A
Median Price
Past 12 months
Past 12 months
2024
$1,475,750
2023
-
2022
-
2021
-
2020
-
2019
$1,590,000
2018
$1,962,500
2017
$1,400,000
2016
$1,607,500
2015
$1,250,000
2014
$2,195,000
2013
-
2012
-
2011
$1,430,000
2010
$1,200,000
2009
-
2008
$1,450,000
2007
$1,515,000
2006
$1,400,000
2005
-
2004
$999,000
2003
-
67 Park Avenue
N/A
Avg. Price
Past 12 months
Past 12 months
2024
-
2023
-
2022
-
2021
-
2020
-
2019
-
2018
-
2017
$2,700,000
2016
-
2015
-
2014
-
2013
$2,050,000
2012
$2,450,000
2011
$1,400,000
2010
-
2009
-
2008
-
2007
$2,800,000
2006
-
2005
-
2004
-
2003
-
67 Park Avenue
N/A
Median Price
Past 12 months
Past 12 months
2024
-
2023
-
2022
-
2021
-
2020
-
2019
-
2018
-
2017
$2,700,000
2016
-
2015
-
2014
-
2013
$2,050,000
2012
$2,450,000
2011
$1,400,000
2010
-
2009
-
2008
-
2007
$2,800,000
2006
-
2005
-
2004
-
2003
-
67 Park Avenue
N/A
Avg. Price
Past 12 months
Past 12 months
2024
-
2023
-
2022
-
2021
-
2020
-
2019
-
2018
-
2017
-
2016
-
2015
-
2014
-
2013
-
2012
-
2011
-
2010
-
2009
-
2008
-
2007
-
2006
-
2005
-
2004
-
2003
-
67 Park Avenue
N/A
Median Price
Past 12 months
Past 12 months
2024
-
2023
-
2022
-
2021
-
2020
-
2019
-
2018
-
2017
-
2016
-
2015
-
2014
-
2013
-
2012
-
2011
-
2010
-
2009
-
2008
-
2007
-
2006
-
2005
-
2004
-
2003
-
67 Park Avenue
N/A
Avg. Price
Past 12 months
Past 12 months
2024
-
2023
-
2022
-
2021
-
2020
-
2019
-
2018
-
2017
-
2016
-
2015
-
2014
-
2013
-
2012
-
2011
-
2010
-
2009
-
2008
-
2007
-
2006
-
2005
-
2004
-
2003
-
67 Park Avenue
N/A
Median Price
Past 12 months
Past 12 months
2024
-
2023
-
2022
-
2021
-
2020
-
2019
-
2018
-
2017
-
2016
-
2015
-
2014
-
2013
-
2012
-
2011
-
2010
-
2009
-
2008
-
2007
-
2006
-
2005
-
2004
-
2003
-
Prospect Tower
N/A
Avg. Price / ft2
Past 12 months
Past 12 months
$1,033
$904
$933
$884
-
$1,114
$1,182
$1,117
$995
$918
$992
$1,021
$905
$862
$884
$877
$1,000
$839
$842
$740
$551
$473
Prospect Tower
$333,895
Avg. Price
Past 12 months
Past 12 months
$337,559
$367,975
$356,370
$385,596
-
$459,105
$444,565
$411,156
$419,996
$422,808
$406,882
$504,056
$338,900
$281,667
$364,720
$295,000
$357,965
$307,891
$382,160
$270,596
$228,077
$225,375
Prospect Tower
$292,500
Median Price
Past 12 months
Past 12 months
$290,000
$310,500
$319,000
$320,000
-
$420,810
$365,245
$350,000
$317,500
$305,000
$375,000
$460,000
$280,000
$285,000
$308,000
$295,000
$310,500
$287,000
$407,500
$232,000
$192,750
$153,750
Prospect Tower
N/A
Avg. Price / ft2
Past 12 months
Past 12 months
$1,033
$963
$970
$922
-
$1,179
$1,133
$1,117
$995
$967
$990
$1,114
$948
$862
$931
$877
$1,086
$868
$853
$776
$551
$456
Prospect Tower
$311,628
Avg. Price
Past 12 months
Past 12 months
$288,308
$286,150
$304,528
$286,536
-
$358,257
$313,927
$333,075
$302,100
$340,450
$354,667
$354,417
$277,000
$281,667
$296,333
$295,000
$311,807
$298,251
$255,453
$235,460
$185,467
$149,111
Prospect Tower
$290,000
Median Price
Past 12 months
Past 12 months
$285,000
$272,500
$310,000
$282,000
-
$330,000
$300,000
$332,375
$300,000
$300,500
$314,000
$307,000
$280,000
$285,000
$292,000
$295,000
$299,000
$285,000
$250,858
$230,500
$179,000
$149,000
Prospect Tower
N/A
Avg. Price / ft2
Past 12 months
Past 12 months
-
$815
$812
$836
-
$917
$1,230
-
-
$723
$1,006
$836
$800
-
$790
-
$936
$640
$832
$687
$551
$455
Prospect Tower
$467,500
Avg. Price
Past 12 months
Past 12 months
$497,625
$449,800
$478,813
$459,400
-
$591,793
$616,070
$547,797
$544,681
$558,500
$464,143
$477,500
$355,000
-
$467,300
-
$477,976
$362,519
$453,395
$383,142
$329,833
$266,333
Prospect Tower
$467,500
Median Price
Past 12 months
Past 12 months
$505,250
$480,000
$472,500
$489,500
-
$570,000
$632,000
$624,500
$550,000
$558,500
$480,000
$477,500
$355,000
-
$467,300
-
$525,000
$320,226
$457,685
$412,500
$315,000
$265,000
Prospect Tower
N/A
Avg. Price / ft2
Past 12 months
Past 12 months
-
-
-
$889
-
-
-
-
-
-
-
-
$925
-
-
-
-
-
-
-
-
$527
Prospect Tower
N/A
Avg. Price
Past 12 months
Past 12 months
-
-
-
$710,000
-
-
-
-
$992,500
$975,000
$725,000
-
$740,000
-
-
-
-
-
$715,000
$157,500
-
$580,000
Prospect Tower
N/A
Median Price
Past 12 months
Past 12 months
-
-
-
$710,000
-
-
-
-
$992,500
$975,000
$725,000
-
$740,000
-
-
-
-
-
$715,000
$157,500
-
$580,000
Prospect Tower
N/A
Avg. Price / ft2
Past 12 months
Past 12 months
-
-
-
-
-
-
-
-
-
-
-
-
-
-
-
-
-
-
-
-
-
-
Prospect Tower
N/A
Avg. Price
Past 12 months
Past 12 months
-
-
-
-
-
-
-
-
-
-
-
-
-
-
-
-
-
-
-
-
-
-
Prospect Tower
N/A
Median Price
Past 12 months
Past 12 months
-
-
-
-
-
-
-
-
-
-
-
-
-
-
-
-
-
-
-
-
-
-
Prospect Tower
N/A
Avg. Price / ft2
Past 12 months
Past 12 months
-
-
-
-
-
-
-
-
-
-
-
-
-
-
-
-
-
-
-
-
-
-
Prospect Tower
N/A
Avg. Price
Past 12 months
Past 12 months
-
-
-
-
-
-
-
-
-
-
-
-
-
-
-
-
-
-
-
-
-
-
Prospect Tower
N/A
Median Price
Past 12 months
Past 12 months
-
-
-
-
-
-
-
-
-
-
-
-
-
-
-
-
-
-
-
-
-
-
23 Park Avenue
N/A
Avg. Price / ft2
Past 12 months
Past 12 months
$834
-
-
-
$945
-
-
$1,451
-
$1,247
-
-
-
-
-
-
$1,127
-
-
-
-
-
23 Park Avenue
N/A
Avg. Price
Past 12 months
Past 12 months
$875,000
-
-
-
$1,040,000
-
$3,000,000
$2,450,000
-
$3,077,500
-
-
-
-
-
-
$2,875,000
-
-
-
-
-
23 Park Avenue
N/A
Median Price
Past 12 months
Past 12 months
$875,000
-
-
-
$1,040,000
-
$3,000,000
$2,450,000
-
$3,077,500
-
-
-
-
-
-
$2,875,000
-
-
-
-
-
23 Park Avenue
N/A
Avg. Price / ft2
Past 12 months
Past 12 months
-
-
-
-
-
-
-
-
-
-
-
-
-
-
-
-
-
-
-
-
-
-
23 Park Avenue
N/A
Avg. Price
Past 12 months
Past 12 months
-
-
-
-
-
-
-
-
-
-
-
-
-
-
-
-
-
-
-
-
-
-
23 Park Avenue
N/A
Median Price
Past 12 months
Past 12 months
-
-
-
-
-
-
-
-
-
-
-
-
-
-
-
-
-
-
-
-
-
-
23 Park Avenue
N/A
Avg. Price / ft2
Past 12 months
Past 12 months
$834
-
-
-
-
-
-
-
-
-
-
-
-
-
-
-
-
-
-
-
-
-
23 Park Avenue
N/A
Avg. Price
Past 12 months
Past 12 months
$875,000
-
-
-
-
-
-
-
-
-
-
-
-
-
-
-
-
-
-
-
-
-
23 Park Avenue
N/A
Median Price
Past 12 months
Past 12 months
$875,000
-
-
-
-
-
-
-
-
-
-
-
-
-
-
-
-
-
-
-
-
-
23 Park Avenue
N/A
Avg. Price / ft2
Past 12 months
Past 12 months
-
-
-
-
$945
-
-
-
-
$1,247
-
-
-
-
-
-
-
-
-
-
-
-
23 Park Avenue
N/A
Avg. Price
Past 12 months
Past 12 months
-
-
-
-
$1,040,000
-
$3,000,000
$1,200,000
-
$1,995,000
-
-
-
-
-
-
-
-
-
-
-
-
23 Park Avenue
N/A
Median Price
Past 12 months
Past 12 months
-
-
-
-
$1,040,000
-
$3,000,000
$1,200,000
-
$1,995,000
-
-
-
-
-
-
-
-
-
-
-
-
23 Park Avenue
N/A
Avg. Price / ft2
Past 12 months
Past 12 months
-
-
-
-
-
-
-
$1,451
-
-
-
-
-
-
-
-
$1,127
-
-
-
-
-
23 Park Avenue
N/A
Avg. Price
Past 12 months
Past 12 months
-
-
-
-
-
-
-
$3,700,000
-
$4,160,000
-
-
-
-
-
-
$2,875,000
-
-
-
-
-
23 Park Avenue
N/A
Median Price
Past 12 months
Past 12 months
-
-
-
-
-
-
-
$3,700,000
-
$4,160,000
-
-
-
-
-
-
$2,875,000
-
-
-
-
-
23 Park Avenue
N/A
Avg. Price / ft2
Past 12 months
Past 12 months
-
-
-
-
-
-
-
-
-
-
-
-
-
-
-
-
-
-
-
-
-
-
23 Park Avenue
N/A
Avg. Price
Past 12 months
Past 12 months
-
-
-
-
-
-
-
-
-
-
-
-
-
-
-
-
-
-
-
-
-
-
23 Park Avenue
N/A
Median Price
Past 12 months
Past 12 months
-
-
-
-
-
-
-
-
-
-
-
-
-
-
-
-
-
-
-
-
-
-
23 Park Avenue
N/A
Avg. Price / ft2
Past 12 months
Past 12 months
-
-
-
-
-
-
-
-
-
-
-
-
-
-
-
-
-
-
-
-
-
-
23 Park Avenue
N/A
Avg. Price
Past 12 months
Past 12 months
-
-
-
-
-
-
-
-
-
-
-
-
-
-
-
-
-
-
-
-
-
-
23 Park Avenue
N/A
Median Price
Past 12 months
Past 12 months
-
-
-
-
-
-
-
-
-
-
-
-
-
-
-
-
-
-
-
-
-
-
16 Park Avenue
N/A
Avg. Price / ft2
Past 12 months
Past 12 months
$762
$754
$840
-
$853
-
-
$970
-
$854
$801
$731
$657
$674
$595
$673
$793
$758
$753
$621
$625
$607
16 Park Avenue
$649,500
Avg. Price
Past 12 months
Past 12 months
$620,810
$586,000
$765,637
-
$640,000
$550,000
$1,992,755
$795,000
-
$945,735
$603,600
$771,250
$549,625
$514,667
$456,750
$505,000
$650,000
$582,572
$582,875
$445,000
$447,500
$521,500
16 Park Avenue
$649,500
Median Price
Past 12 months
Past 12 months
$589,000
$591,000
$586,000
-
$640,000
$550,000
$1,992,755
$795,000
-
$640,000
$586,000
$595,000
$526,500
$510,000
$461,000
$505,000
$650,000
$575,000
$582,000
$487,500
$450,000
$521,500
16 Park Avenue
N/A
Avg. Price / ft2
Past 12 months
Past 12 months
-
-
$1,057
-
-
-
-
-
-
-
-
-
-
-
$653
-
-
-
-
$506
-
-
16 Park Avenue
N/A
Avg. Price
Past 12 months
Past 12 months
-
-
$575,000
-
-
-
-
-
-
-
-
-
-
-
$355,000
-
-
-
-
$275,000
-
-
16 Park Avenue
N/A
Median Price
Past 12 months
Past 12 months
-
-
$575,000
-
-
-
-
-
-
-
-
-
-
-
$355,000
-
-
-
-
$275,000
-
-
16 Park Avenue
N/A
Avg. Price / ft2
Past 12 months
Past 12 months
$721
$754
$768
-
$853
-
-
$970
-
$854
$801
$740
$657
$674
$588
$673
$793
$758
$753
$679
$625
$621
16 Park Avenue
$599,000
Avg. Price
Past 12 months
Past 12 months
$564,125
$586,000
$599,250
-
$640,000
$550,000
-
$795,000
-
$641,200
$603,600
$564,167
$500,333
$514,667
$461,000
$505,000
$650,000
$582,572
$582,875
$501,667
$447,500
$450,000
16 Park Avenue
$599,000
Median Price
Past 12 months
Past 12 months
$560,750
$591,000
$586,000
-
$640,000
$550,000
-
$795,000
-
$620,000
$586,000
$575,000
$525,000
$510,000
$461,000
$505,000
$650,000
$575,000
$582,000
$525,000
$450,000
$450,000
16 Park Avenue
N/A
Avg. Price / ft2
Past 12 months
Past 12 months
$843
-
-
-
-
-
-
-
-
-
-
$685
-
-
$550
-
-
-
-
-
-
$593
16 Park Avenue
$700,000
Avg. Price
Past 12 months
Past 12 months
$847,552
-
-
-
-
-
$1,992,755
-
-
$789,144
-
$1,392,500
$697,501
-
$550,000
-
-
-
-
-
-
$593,000
16 Park Avenue
$700,000
Median Price
Past 12 months
Past 12 months
$847,552
-
-
-
-
-
$1,992,755
-
-
$789,144
-
$1,392,500
$697,501
-
$550,000
-
-
-
-
-
-
$593,000
16 Park Avenue
N/A
Avg. Price / ft2
Past 12 months
Past 12 months
-
-
-
-
-
-
-
-
-
-
-
-
-
-
-
-
-
-
-
-
-
-
16 Park Avenue
N/A
Avg. Price
Past 12 months
Past 12 months
-
-
-
-
-
-
-
-
-
$2,625,000
-
-
-
-
-
-
-
-
-
-
-
-
16 Park Avenue
N/A
Median Price
Past 12 months
Past 12 months
-
-
-
-
-
-
-
-
-
$2,625,000
-
-
-
-
-
-
-
-
-
-
-
-
16 Park Avenue
N/A
Avg. Price / ft2
Past 12 months
Past 12 months
-
-
-
-
-
-
-
-
-
-
-
-
-
-
-
-
-
-
-
-
-
-
16 Park Avenue
N/A
Avg. Price
Past 12 months
Past 12 months
-
-
-
-
-
-
-
-
-
-
-
-
-
-
-
-
-
-
-
-
-
-
16 Park Avenue
N/A
Median Price
Past 12 months
Past 12 months
-
-
-
-
-
-
-
-
-
-
-
-
-
-
-
-
-
-
-
-
-
-
16 Park Avenue
N/A
Avg. Price / ft2
Past 12 months
Past 12 months
-
-
-
-
-
-
-
-
-
-
-
-
-
-
-
-
-
-
-
-
-
-
16 Park Avenue
N/A
Avg. Price
Past 12 months
Past 12 months
-
-
-
-
-
-
-
-
-
-
-
-
-
-
-
-
-
-
-
-
-
-
16 Park Avenue
N/A
Median Price
Past 12 months
Past 12 months
-
-
-
-
-
-
-
-
-
-
-
-
-
-
-
-
-
-
-
-
-
-
55 Park Avenue
N/A
Avg. Price / ft2
Past 12 months
Past 12 months
$855
$888
$837
$1,000
-
-
-
$729
$875
-
-
$890
$740
-
-
-
-
-
-
-
-
-
55 Park Avenue
$923,333
Avg. Price
Past 12 months
Past 12 months
$940,000
$990,000
$1,126,350
$1,200,000
-
-
$930,000
$948,100
$950,000
-
$898,000
$944,500
$887,500
-
-
-
$1,167,000
-
-
$875,000
$635,000
$610,000
55 Park Avenue
$925,000
Median Price
Past 12 months
Past 12 months
$940,000
$990,000
$1,126,350
$1,200,000
-
-
$930,000
$912,900
$950,000
-
$898,000
$978,500
$887,500
-
-
-
$1,167,000
-
-
$875,000
$635,000
$610,000
55 Park Avenue
N/A
Avg. Price / ft2
Past 12 months
Past 12 months
-
-
-
-
-
-
-
-
-
-
-
-
-
-
-
-
-
-
-
-
-
-
55 Park Avenue
N/A
Avg. Price
Past 12 months
Past 12 months
-
-
-
-
-
-
-
-
-
-
-
-
-
-
-
-
-
-
-
-
-
-
55 Park Avenue
N/A
Median Price
Past 12 months
Past 12 months
-
-
-
-
-
-
-
-
-
-
-
-
-
-
-
-
-
-
-
-
-
-
55 Park Avenue
N/A
Avg. Price / ft2
Past 12 months
Past 12 months
-
-
-
-
-
-
-
-
-
-
-
-
-
-
-
-
-
-
-
-
-
-
55 Park Avenue
N/A
Avg. Price
Past 12 months
Past 12 months
-
-
-
-
-
-
-
-
-
-
-
-
-
-
-
-
-
-
-
-
-
-
55 Park Avenue
N/A
Median Price
Past 12 months
Past 12 months
-
-
-
-
-
-
-
-
-
-
-
-
-
-
-
-
-
-
-
-
-
-
Park South Tower
N/A
Avg. Price / ft2
Past 12 months
Past 12 months
$943
-
$1,161
$1,129
-
$1,114
$1,066
$1,133
$1,000
-
$1,094
-
$814
$817
$784
$750
$813
$919
$852
$653
$632
$516
Park South Tower
$825,000
Avg. Price
Past 12 months
Past 12 months
$1,031,666
$1,323,000
$1,520,537
$1,414,167
-
$1,387,500
$1,123,500
$1,128,500
$1,217,000
$1,032,800
$1,026,000
$1,113,333
$832,000
$694,688
$723,333
$750,000
$1,073,000
$999,917
$958,750
$735,045
$528,700
$522,143
Park South Tower
$825,000
Median Price
Past 12 months
Past 12 months
$999,999
$1,323,000
$1,271,250
$1,087,500
-
$1,387,500
$1,123,500
$1,124,500
$1,125,000
$999,000
$1,053,000
$955,000
$840,000
$705,000
$675,000
$750,000
$827,500
$795,250
$787,500
$685,000
$499,000
$520,000
Park South Tower
N/A
Avg. Price / ft2
Past 12 months
Past 12 months
-
-
-
-
-
-
-
-
-
-
-
-
-
-
-
-
-
-
-
-
-
-
Park South Tower
N/A
Avg. Price
Past 12 months
Past 12 months
-
-
-
-
-
-
-
-
-
-
-
-
-
-
-
-
-
-
-
-
-
-
Park South Tower
N/A
Median Price
Past 12 months
Past 12 months
-
-
-
-
-
-
-
-
-
-
-
-
-
-
-
-
-
-
-
-
-
-
Park South Tower
N/A
Avg. Price / ft2
Past 12 months
Past 12 months
$943
-
$1,161
$1,094
-
$938
$1,066
$1,133
$1,000
-
$1,094
-
$814
$817
$784
$750
$813
$860
$785
$625
$632
$489
Park South Tower
$850,000
Avg. Price
Past 12 months
Past 12 months
$1,031,666
$1,323,000
$1,160,716
$981,250
-
$750,000
$1,123,500
$1,088,000
$1,082,667
$996,000
$964,000
$925,000
$832,000
$694,688
$723,333
$750,000
$804,857
$760,900
$752,500
$689,500
$498,375
$498,000
Park South Tower
$850,000
Median Price
Past 12 months
Past 12 months
$999,999
$1,323,000
$1,192,500
$981,250
-
$750,000
$1,123,500
$999,000
$1,100,000
$972,000
$964,000
$925,000
$840,000
$705,000
$675,000
$750,000
$800,000
$749,000
$752,500
$685,000
$494,250
$505,000
Park South Tower
N/A
Avg. Price / ft2
Past 12 months
Past 12 months
-
-
-
$1,163
-
$1,290
-
-
-
-
-
-
-
-
-
-
-
-
$885
$822
-
$570
Park South Tower
N/A
Avg. Price
Past 12 months
Past 12 months
-
-
-
$2,280,000
-
$2,025,000
-
$1,250,000
$1,620,000
$1,180,000
$1,150,000
$955,000
-
-
-
-
-
-
$1,165,000
$940,000
$650,000
$582,500
Park South Tower
N/A
Median Price
Past 12 months
Past 12 months
-
-
-
$2,280,000
-
$2,025,000
-
$1,250,000
$1,620,000
$1,180,000
$1,150,000
$955,000
-
-
-
-
-
-
$1,165,000
$940,000
$650,000
$582,500
Park South Tower
N/A
Avg. Price / ft2
Past 12 months
Past 12 months
-
-
-
-
-
-
-
-
-
-
-
-
-
-
-
-
-
$1,098
-
-
-
-
Park South Tower
N/A
Avg. Price
Past 12 months
Past 12 months
-
-
$2,600,000
-
-
-
-
-
-
-
-
-
-
-
-
-
-
$2,195,000
-
-
-
-
Park South Tower
N/A
Median Price
Past 12 months
Past 12 months
-
-
$2,600,000
-
-
-
-
-
-
-
-
-
-
-
-
-
-
$2,195,000
-
-
-
-
Park South Tower
N/A
Avg. Price / ft2
Past 12 months
Past 12 months
-
-
-
-
-
-
-
-
-
-
-
-
-
-
-
-
-
-
-
-
-
-
Park South Tower
N/A
Avg. Price
Past 12 months
Past 12 months
-
-
-
-
-
-
-
-
-
-
-
-
-
-
-
-
$2,950,000
-
-
-
-
-
Park South Tower
N/A
Median Price
Past 12 months
Past 12 months
-
-
-
-
-
-
-
-
-
-
-
-
-
-
-
-
$2,950,000
-
-
-
-
-
Park South Tower
N/A
Avg. Price / ft2
Past 12 months
Past 12 months
-
-
-
-
-
-
-
-
-
-
-
-
-
-
-
-
-
-
-
-
-
-
Park South Tower
N/A
Avg. Price
Past 12 months
Past 12 months
-
-
-
-
-
-
-
-
-
-
-
-
-
-
-
-
-
-
-
-
-
-
Park South Tower
N/A
Median Price
Past 12 months
Past 12 months
-
-
-
-
-
-
-
-
-
-
-
-
-
-
-
-
-
-
-
-
-
-
Goodhue House
N/A
Avg. Price / ft2
Past 12 months
Past 12 months
$968
-
$1,003
$975
-
$1,073
$988
$1,147
$855
-
$714
$750
-
$677
-
$663
-
$832
$696
$693
$566
$498
Goodhue House
$735,000
Avg. Price
Past 12 months
Past 12 months
$834,500
$705,625
$1,265,625
$882,500
-
$1,051,667
$1,147,734
$1,040,056
$667,933
$955,000
$796,167
$640,625
-
$386,250
-
$580,000
$760,000
$626,625
$474,750
$642,111
$907,500
$330,107
Goodhue House
$735,000
Median Price
Past 12 months
Past 12 months
$850,000
$716,250
$1,312,500
$882,500
-
$895,000
$908,750
$850,000
$720,800
$955,000
$672,500
$554,250
-
$386,250
-
$580,000
$760,000
$555,000
$474,750
$555,000
$825,000
$355,351
Goodhue House
N/A
Avg. Price / ft2
Past 12 months
Past 12 months
-
-
-
-
-
-
-
-
-
-
-
-
-
-
-
-
-
$752
-
-
$560
-
Goodhue House
N/A
Avg. Price
Past 12 months
Past 12 months
-
-
-
-
-
-
-
$413,000
-
-
-
-
-
-
-
-
-
$386,500
-
$370,000
$280,000
-
Goodhue House
N/A
Median Price
Past 12 months
Past 12 months
-
-
-
-
-
-
-
$413,000
-
-
-
-
-
-
-
-
-
$386,500
-
$370,000
$280,000
-
Goodhue House
N/A
Avg. Price / ft2
Past 12 months
Past 12 months
$927
-
-
$975
-
-
$988
$1,294
$855
-
$714
$750
-
$677
-
$663
-
$872
$696
$693
$571
$498
Goodhue House
$735,000
Avg. Price
Past 12 months
Past 12 months
$745,300
$705,625
$735,000
$882,500
-
$800,000
$1,097,411
$985,000
$667,933
$955,000
$631,750
$640,625
-
$386,250
-
$580,000
$760,000
$612,000
$474,750
$642,000
$500,000
$368,458
Goodhue House
$735,000
Median Price
Past 12 months
Past 12 months
$720,000
$716,250
$735,000
$882,500
-
$800,000
$892,500
$802,500
$720,800
$955,000
$660,000
$554,250
-
$386,250
-
$580,000
$760,000
$625,000
$474,750
$555,000
$500,000
$362,176
Goodhue House
N/A
Avg. Price / ft2
Past 12 months
Past 12 months
$1,091
-
$1,083
-
-
$1,073
-
$1,000
-
-
-
-
-
-
-
-
-
-
-
-
-
-
Goodhue House
N/A
Avg. Price
Past 12 months
Past 12 months
$1,057,500
-
$1,312,500
-
-
$1,177,500
$1,500,000
$1,518,750
-
-
$1,600,000
-
-
-
-
-
-
$1,180,000
-
$915,000
$1,150,000
-
Goodhue House
N/A
Median Price
Past 12 months
Past 12 months
$1,057,500
-
$1,312,500
-
-
$1,177,500
$1,500,000
$1,518,750
-
-
$1,600,000
-
-
-
-
-
-
$1,180,000
-
$915,000
$1,150,000
-
Goodhue House
N/A
Avg. Price / ft2
Past 12 months
Past 12 months
-
-
$844
-
-
-
-
-
-
-
-
-
-
-
-
-
-
-
-
-
-
-
Goodhue House
N/A
Avg. Price
Past 12 months
Past 12 months
-
-
$1,702,500
-
-
-
-
-
-
-
-
-
-
-
-
-
-
-
-
-
-
-
Goodhue House
N/A
Median Price
Past 12 months
Past 12 months
-
-
$1,702,500
-
-
-
-
-
-
-
-
-
-
-
-
-
-
-
-
-
-
-
Goodhue House
N/A
Avg. Price / ft2
Past 12 months
Past 12 months
-
-
-
-
-
-
-
-
-
-
-
-
-
-
-
-
-
-
-
-
-
-
Goodhue House
N/A
Avg. Price
Past 12 months
Past 12 months
-
-
-
-
-
-
-
-
-
-
-
-
-
-
-
-
-
-
-
-
-
-
Goodhue House
N/A
Median Price
Past 12 months
Past 12 months
-
-
-
-
-
-
-
-
-
-
-
-
-
-
-
-
-
-
-
-
-
-
Goodhue House
N/A
Avg. Price / ft2
Past 12 months
Past 12 months
-
-
-
-
-
-
-
-
-
-
-
-
-
-
-
-
-
-
-
-
-
-
Goodhue House
N/A
Avg. Price
Past 12 months
Past 12 months
-
-
-
-
-
-
-
-
-
-
-
-
-
-
-
-
-
-
-
-
-
-
Goodhue House
N/A
Median Price
Past 12 months
Past 12 months
-
-
-
-
-
-
-
-
-
-
-
-
-
-
-
-
-
-
-
-
-
-
10 Park Avenue
N/A
Avg. Price / ft2
Past 12 months
Past 12 months
$1,097
$1,184
$1,152
$1,056
$1,015
$1,000
$1,222
$1,118
$1,033
$982
$1,025
$1,040
$805
$812
$762
$747
$1,007
$817
$960
$858
$605
$551
10 Park Avenue
$895,250
Avg. Price
Past 12 months
Past 12 months
$840,278
$760,000
$722,750
$1,046,786
$507,500
$599,950
$1,001,500
$712,818
$562,135
$607,615
$683,000
$831,316
$667,500
$658,154
$470,667
$544,100
$701,313
$548,909
$650,892
$622,000
$476,482
$342,100
10 Park Avenue
$810,000
Median Price
Past 12 months
Past 12 months
$530,000
$662,500
$555,000
$750,000
$507,500
$599,950
$680,000
$525,000
$472,500
$495,000
$810,000
$750,000
$624,500
$629,500
$397,000
$430,000
$440,000
$575,000
$641,000
$705,000
$490,000
$270,000
10 Park Avenue
N/A
Avg. Price / ft2
Past 12 months
Past 12 months
$990
-
$1,175
$1,020
$1,015
$1,000
$1,222
$1,025
$978
$1,029
$400
$947
$800
-
$757
$700
$884
$777
$720
-
$380
$510
10 Park Avenue
$487,500
Avg. Price
Past 12 months
Past 12 months
$435,000
$523,333
$509,000
$492,500
$507,500
$499,900
$527,500
$469,667
$445,943
$464,250
$306,667
$403,214
$405,250
$391,667
$378,500
$360,833
$410,125
$384,000
$357,333
$348,333
$231,800
$230,400
10 Park Avenue
$487,500
Median Price
Past 12 months
Past 12 months
$468,000
$510,000
$525,000
$492,500
$507,500
$499,900
$527,500
$467,500
$453,750
$471,000
$360,000
$385,000
$392,000
$380,000
$378,500
$345,000
$407,750
$378,000
$360,000
$360,000
$260,000
$240,000
10 Park Avenue
N/A
Avg. Price / ft2
Past 12 months
Past 12 months
$1,204
$1,151
$919
$1,074
-
-
-
$1,111
$1,199
$794
$1,181
$1,035
$808
$812
$771
$776
$1,000
$843
$988
$908
$647
$510
10 Park Avenue
$1,100,000
Avg. Price
Past 12 months
Past 12 months
$661,500
$793,333
$881,000
$804,375
-
$700,000
$680,000
$893,250
$833,250
$758,750
$871,167
$784,688
$649,750
$631,222
$655,000
$598,500
$641,600
$686,333
$684,049
$696,667
$597,950
$369,750
10 Park Avenue
$1,100,000
Median Price
Past 12 months
Past 12 months
$655,000
$780,000
$881,000
$758,750
-
$700,000
$680,000
$869,000
$849,000
$757,500
$856,000
$761,250
$649,500
$630,000
$655,000
$598,500
$641,600
$660,000
$650,500
$740,000
$599,000
$379,500
10 Park Avenue
N/A
Avg. Price / ft2
Past 12 months
Past 12 months
-
$1,250
$1,341
-
-
-
-
$1,318
-
-
-
$1,335
-
-
-
$789
$1,070
-
$1,091
$711
$697
$632
10 Park Avenue
$1,506,000
Avg. Price
Past 12 months
Past 12 months
-
$1,750,000
$1,475,000
-
-
-
$1,622,500
$1,450,000
-
$1,150,000
-
$1,181,667
$1,280,000
-
-
$1,039,500
$1,313,545
-
$1,200,000
$995,000
$888,500
$790,000
10 Park Avenue
$1,506,000
Median Price
Past 12 months
Past 12 months
-
$1,750,000
$1,475,000
-
-
-
$1,622,500
$1,450,000
-
$1,150,000
-
$1,400,000
$1,280,000
-
-
$1,039,500
$1,348,000
-
$1,200,000
$995,000
$888,500
$790,000
10 Park Avenue
N/A
Avg. Price / ft2
Past 12 months
Past 12 months
-
-
-
-
-
-
-
-
-
-
-
-
-
-
-
-
-
-
-
-
-
-
10 Park Avenue
N/A
Avg. Price
Past 12 months
Past 12 months
$2,950,000
-
-
$3,125,000
-
-
$1,650,000
-
-
-
-
$3,150,000
$1,175,000
$1,700,000
-
-
-
-
-
-
-
-
10 Park Avenue
N/A
Median Price
Past 12 months
Past 12 months
$2,950,000
-
-
$3,125,000
-
-
$1,650,000
-
-
-
-
$3,150,000
$1,175,000
$1,700,000
-
-
-
-
-
-
-
-
10 Park Avenue
N/A
Avg. Price / ft2
Past 12 months
Past 12 months
-
-
-
-
-
-
-
-
-
-
-
-
-
-
-
-
-
-
-
-
-
-
10 Park Avenue
N/A
Avg. Price
Past 12 months
Past 12 months
-
-
-
-
-
-
-
-
-
-
-
-
-
-
-
-
-
-
-
-
-
-
10 Park Avenue
N/A
Median Price
Past 12 months
Past 12 months
-
-
-
-
-
-
-
-
-
-
-
-
-
-
-
-
-
-
-
-
-
-
10 Park Avenue
N/A
Avg. Price / ft2
Past 12 months
Past 12 months
-
-
-
-
-
-
-
-
-
-
-
-
-
-
-
-
-
-
-
-
-
-
10 Park Avenue
N/A
Avg. Price
Past 12 months
Past 12 months
-
-
-
-
-
-
-
-
-
-
-
-
-
-
-
-
-
-
-
-
-
-
10 Park Avenue
N/A
Median Price
Past 12 months
Past 12 months
-
-
-
-
-
-
-
-
-
-
-
-
-
-
-
-
-
-
-
-
-
-
35 Park Avenue
N/A
Avg. Price / ft2
Past 12 months
Past 12 months
$811
$880
$1,154
$977
$1,098
$939
$966
$1,129
$1,033
$938
$833
$832
$781
$674
$778
$694
$826
$776
$821
$626
$671
$499
35 Park Avenue
N/A
Avg. Price
Past 12 months
Past 12 months
$783,750
$926,250
$1,178,500
$963,000
$757,250
$628,500
$894,628
$853,750
$696,800
$799,286
$797,750
$636,357
$580,522
$620,511
$683,000
$680,625
$604,600
$680,417
$752,000
$446,000
$541,875
$405,417
35 Park Avenue
N/A
Median Price
Past 12 months
Past 12 months
$662,500
$777,500
$1,149,500
$825,000
$687,000
$475,000
$795,000
$775,000
$775,000
$648,000
$752,000
$612,500
$528,000
$567,500
$575,000
$668,750
$645,000
$495,000
$675,000
$410,000
$517,500
$413,750
35 Park Avenue
N/A
Avg. Price / ft2
Past 12 months
Past 12 months
-
-
-
-
$701
$909
-
$1,136
$1,012
$909
$646
-
$737
$478
-
-
$911
$759
$802
$658
-
$478
35 Park Avenue
N/A
Avg. Price
Past 12 months
Past 12 months
-
-
-
-
$475,000
$475,000
-
$545,000
$434,500
$500,000
$530,000
$300,000
$392,667
$259,543
-
-
$410,000
$424,167
$414,333
$362,000
-
$263,000
35 Park Avenue
N/A
Median Price
Past 12 months
Past 12 months
-
-
-
-
$475,000
$475,000
-
$545,000
$434,500
$500,000
$530,000
$300,000
$383,000
$259,543
-
-
$410,000
$435,000
$430,000
$362,000
-
$263,000
35 Park Avenue
N/A
Avg. Price / ft2
Past 12 months
Past 12 months
$794
$905
$1,211
$950
$1,951
-
$966
$1,121
$1,040
$939
$868
$812
$812
$700
$778
$699
$805
$624
$812
$604
$668
$504
35 Park Avenue
N/A
Avg. Price
Past 12 months
Past 12 months
$653,333
$768,333
$857,000
$795,000
$829,000
$661,000
$771,667
$925,000
$871,667
$769,000
$766,625
$575,500
$540,500
$578,750
$683,000
$624,167
$653,250
$530,000
$691,250
$502,000
$501,429
$433,900
35 Park Avenue
N/A
Median Price
Past 12 months
Past 12 months
$650,000
$770,000
$857,000
$790,000
$829,000
$661,000
$770,000
$925,000
$880,000
$648,000
$752,000
$600,000
$569,000
$567,500
$575,000
$600,000
$645,000
$530,000
$677,500
$517,000
$515,000
$422,500
35 Park Avenue
N/A
Avg. Price / ft2
Past 12 months
Past 12 months
$827
-
$1,125
$1,031
$1,042
$969
-
-
-
$962
$915
$968
$785
$819
-
$680
-
$877
$952
-
$688
-
35 Park Avenue
N/A
Avg. Price
Past 12 months
Past 12 months
$1,175,000
-
$1,500,000
$1,299,000
$1,250,000
$1,325,000
$1,263,510
$1,400,000
-
$1,250,000
$1,190,000
$1,127,000
$942,350
$1,065,000
-
$850,000
-
$1,140,000
$1,190,000
-
$825,000
-
35 Park Avenue
N/A
Median Price
Past 12 months
Past 12 months
$1,175,000
-
$1,500,000
$1,299,000
$1,250,000
$1,325,000
$1,263,510
$1,400,000
-
$1,250,000
$1,190,000
$1,127,000
$942,350
$1,065,000
-
$850,000
-
$1,140,000
$1,190,000
-
$825,000
-
35 Park Avenue
N/A
Avg. Price / ft2
Past 12 months
Past 12 months
-
$829
-
-
-
-
-
-
-
-
-
-
-
-
-
-
-
-
$785
-
-
-
35 Park Avenue
N/A
Avg. Price
Past 12 months
Past 12 months
-
$1,400,000
-
-
-
-
-
-
-
-
-
-
-
-
-
-
-
-
$1,570,000
-
-
-
35 Park Avenue
N/A
Median Price
Past 12 months
Past 12 months
-
$1,400,000
-
-
-
-
-
-
-
-
-
-
-
-
-
-
-
-
$1,570,000
-
-
-
35 Park Avenue
N/A
Avg. Price / ft2
Past 12 months
Past 12 months
-
-
-
-
-
-
-
-
-
-
-
-
-
-
-
-
-
-
-
-
-
-
35 Park Avenue
N/A
Avg. Price
Past 12 months
Past 12 months
-
-
-
-
-
-
-
-
-
-
-
-
-
-
-
-
-
-
-
-
-
-
35 Park Avenue
N/A
Median Price
Past 12 months
Past 12 months
-
-
-
-
-
-
-
-
-
-
-
-
-
-
-
-
-
-
-
-
-
-
35 Park Avenue
N/A
Avg. Price / ft2
Past 12 months
Past 12 months
-
-
-
-
-
-
-
-
-
-
-
-
-
-
-
-
-
-
-
-
-
-
35 Park Avenue
N/A
Avg. Price
Past 12 months
Past 12 months
-
-
-
-
-
-
-
-
-
-
-
-
-
-
-
-
-
-
-
-
-
-
35 Park Avenue
N/A
Median Price
Past 12 months
Past 12 months
-
-
-
-
-
-
-
-
-
-
-
-
-
-
-
-
-
-
-
-
-
-
Bryant Park Place
$1,719
Avg. Price / ft2
Past 12 months
Past 12 months
-
$1,121
$987
$1,070
$819
$1,022
$906
$1,094
-
-
-
$823
$836
$834
$771
$773
$1,007
$874
$796
$672
$518
$424
Bryant Park Place
$550,000
Avg. Price
Past 12 months
Past 12 months
$649,000
$669,667
$698,333
$562,000
$727,500
$848,000
$578,750
$753,600
-
$1,054,500
$520,033
$500,357
$657,500
$647,200
$585,500
$356,500
$580,000
$657,554
$593,390
$499,333
$421,571
$373,125
Bryant Park Place
$550,000
Median Price
Past 12 months
Past 12 months
$649,000
$735,000
$755,000
$562,000
$727,500
$848,000
$640,000
$800,000
-
$800,000
$428,000
$510,000
$605,000
$591,000
$576,000
$356,500
$587,500
$620,000
$603,170
$505,000
$376,000
$368,750
Bryant Park Place
$1,719
Avg. Price / ft2
Past 12 months
Past 12 months
-
-
-
$1,070
-
-
-
-
-
-
-
$888
$925
-
$906
$773
$1,138
$901
$700
$729
$531
-
Bryant Park Place
$550,000
Avg. Price
Past 12 months
Past 12 months
$649,000
-
-
$562,000
-
-
-
$518,000
-
$318,000
$422,550
$410,833
$370,000
-
$290,000
$356,500
$477,500
$472,770
$280,000
$510,000
$245,000
-
Bryant Park Place
$550,000
Median Price
Past 12 months
Past 12 months
$649,000
-
-
$562,000
-
-
-
$518,000
-
$318,000
$422,550
$367,500
$370,000
-
$290,000
$356,500
$477,500
$472,770
$280,000
$510,000
$245,000
-
Bryant Park Place
N/A
Avg. Price / ft2
Past 12 months
Past 12 months
-
$1,121
$987
-
$819
-
$906
$1,094
-
-
-
$759
$813
$789
$743
-
$942
$829
$791
$644
$509
$424
Bryant Park Place
N/A
Avg. Price
Past 12 months
Past 12 months
-
$669,667
$820,000
-
$727,500
-
$578,750
$812,500
-
$800,000
$715,000
$567,500
$626,250
$581,500
$576,000
-
$566,667
$617,500
$592,585
$450,250
$378,500
$344,167
Bryant Park Place
N/A
Median Price
Past 12 months
Past 12 months
-
$735,000
$820,000
-
$727,500
-
$640,000
$805,000
-
$800,000
$715,000
$542,500
$605,000
$580,500
$576,000
-
$675,000
$617,500
$603,170
$450,000
$377,000
$332,500
Bryant Park Place
N/A
Avg. Price / ft2
Past 12 months
Past 12 months
-
-
-
-
-
$1,022
-
-
-
-
-
-
-
$1,011
$692
-
-
$907
$910
-
-
-
Bryant Park Place
N/A
Avg. Price
Past 12 months
Past 12 months
-
-
-
-
-
$848,000
-
-
-
-
-
-
$1,070,000
$910,000
$900,000
-
$825,000
$790,000
$910,000
-
$947,000
$460,000
Bryant Park Place
N/A
Median Price
Past 12 months
Past 12 months
-
-
-
-
-
$848,000
-
-
-
-
-
-
$1,070,000
$910,000
$900,000
-
$825,000
$790,000
$910,000
-
$947,000
$460,000
Bryant Park Place
N/A
Avg. Price / ft2
Past 12 months
Past 12 months
-
-
-
-
-
-
-
-
-
-
-
-
-
-
-
-
-
-
-
-
-
-
Bryant Park Place
N/A
Avg. Price
Past 12 months
Past 12 months
-
-
-
-
-
-
-
-
-
$2,300,000
-
-
-
-
-
-
-
-
-
$685,000
-
-
Bryant Park Place
N/A
Median Price
Past 12 months
Past 12 months
-
-
-
-
-
-
-
-
-
$2,300,000
-
-
-
-
-
-
-
-
-
$685,000
-
-
Bryant Park Place
N/A
Avg. Price / ft2
Past 12 months
Past 12 months
-
-
-
-
-
-
-
-
-
-
-
-
-
-
-
-
-
-
-
-
-
-
Bryant Park Place
N/A
Avg. Price
Past 12 months
Past 12 months
-
-
-
-
-
-
-
-
-
-
-
-
-
-
-
-
-
-
-
-
-
-
Bryant Park Place
N/A
Median Price
Past 12 months
Past 12 months
-
-
-
-
-
-
-
-
-
-
-
-
-
-
-
-
-
-
-
-
-
-
Bryant Park Place
N/A
Avg. Price / ft2
Past 12 months
Past 12 months
-
-
-
-
-
-
-
-
-
-
-
-
-
-
-
-
-
-
-
-
-
-
Bryant Park Place
N/A
Avg. Price
Past 12 months
Past 12 months
-
-
-
-
-
-
-
-
-
-
-
-
-
-
-
-
-
-
-
-
-
-
Bryant Park Place
N/A
Median Price
Past 12 months
Past 12 months
-
-
-
-
-
-
-
-
-
-
-
-
-
-
-
-
-
-
-
-
-
-
Murray Hill House
$1,100
Avg. Price / ft2
Past 12 months
Past 12 months
$1,036
$999
$1,047
$1,027
$1,011
$1,033
$1,059
$1,101
$1,006
$1,001
$1,036
$860
$835
$759
$765
$732
$890
$826
$811
$708
$573
$527
Murray Hill House
$995,000
Avg. Price
Past 12 months
Past 12 months
$779,584
$946,429
$899,211
$881,000
$960,000
$775,000
$903,571
$865,292
$930,981
$753,616
$943,377
$564,655
$625,837
$794,873
$662,500
$525,188
$614,906
$684,727
$642,369
$597,833
$567,926
$414,333
Murray Hill House
$825,000
Median Price
Past 12 months
Past 12 months
$760,000
$990,000
$785,000
$970,000
$960,000
$775,000
$865,000
$843,459
$748,414
$699,000
$1,010,038
$550,000
$600,000
$735,870
$662,500
$532,500
$667,500
$602,500
$636,758
$609,500
$425,000
$405,000
Murray Hill House
N/A
Avg. Price / ft2
Past 12 months
Past 12 months
-
$917
-
$1,018
-
-
-
-
-
-
-
$864
-
-
-
$659
-
$907
-
-
-
-
Murray Hill House
N/A
Avg. Price
Past 12 months
Past 12 months
-
$544,500
-
$560,000
-
-
-
-
$610,950
-
-
$475,000
-
-
-
$379,167
-
$499,000
-
-
-
-
Murray Hill House
N/A
Median Price
Past 12 months
Past 12 months
-
$544,500
-
$560,000
-
-
-
-
$610,950
-
-
$475,000
-
-
-
$380,000
-
$499,000
-
-
-
-
Murray Hill House
$1,100
Avg. Price / ft2
Past 12 months
Past 12 months
$1,036
$1,008
$1,047
$1,015
$1,011
$1,033
$1,059
$1,101
$984
$1,001
$1,063
$858
$835
$806
$740
$775
$890
$817
$811
$708
$527
$540
Murray Hill House
$727,500
Avg. Price
Past 12 months
Past 12 months
$779,584
$958,750
$899,211
$906,667
$960,000
$775,000
$794,167
$839,213
$831,183
$753,616
$811,692
$587,069
$598,421
$687,935
$555,000
$612,800
$614,906
$596,200
$642,369
$597,833
$460,158
$377,500
Murray Hill House
$727,500
Median Price
Past 12 months
Past 12 months
$760,000
$1,015,000
$785,000
$970,000
$960,000
$775,000
$787,500
$804,418
$748,414
$699,000
$705,000
$587,889
$592,500
$670,870
$555,000
$575,000
$667,500
$600,000
$636,758
$609,500
$414,500
$377,500
Murray Hill House
N/A
Avg. Price / ft2
Past 12 months
Past 12 months
-
$1,042
-
$1,071
-
-
-
-
-
-
$1,010
-
-
$712
$790
-
-
$806
-
-
$666
$514
Murray Hill House
$1,530,000
Avg. Price
Past 12 months
Past 12 months
-
$1,122,750
-
$1,125,000
-
-
$1,560,000
$1,100,000
-
-
$1,075,062
-
$900,000
$1,008,750
$770,000
-
-
$998,906
-
-
$999,000
$488,000
Murray Hill House
$1,530,000
Median Price
Past 12 months
Past 12 months
-
$1,122,750
-
$1,125,000
-
-
$1,560,000
$1,100,000
-
-
$1,126,185
-
$900,000
$1,008,750
$770,000
-
-
$998,906
-
-
$999,000
$488,000
Murray Hill House
N/A
Avg. Price / ft2
Past 12 months
Past 12 months
-
-
-
-
-
-
-
-
$1,094
-
-
-
-
-
-
-
-
-
-
-
-
-
Murray Hill House
N/A
Avg. Price
Past 12 months
Past 12 months
-
-
-
-
-
-
-
-
$1,750,000
-
-
-
-
-
-
-
-
-
-
-
-
-
Murray Hill House
N/A
Median Price
Past 12 months
Past 12 months
-
-
-
-
-
-
-
-
$1,750,000
-
-
-
-
-
-
-
-
-
-
-
-
-
Murray Hill House
N/A
Avg. Price / ft2
Past 12 months
Past 12 months
-
-
-
-
-
-
-
-
-
-
-
-
-
-
-
-
-
-
-
-
-
-
Murray Hill House
N/A
Avg. Price
Past 12 months
Past 12 months
-
-
-
-
-
-
-
-
-
-
-
-
-
-
-
-
-
-
-
-
-
-
Murray Hill House
N/A
Median Price
Past 12 months
Past 12 months
-
-
-
-
-
-
-
-
-
-
-
-
-
-
-
-
-
-
-
-
-
-
Murray Hill House
N/A
Avg. Price / ft2
Past 12 months
Past 12 months
-
-
-
-
-
-
-
-
-
-
-
-
-
-
-
-
-
-
-
-
-
-
Murray Hill House
N/A
Avg. Price
Past 12 months
Past 12 months
-
-
-
-
-
-
-
-
-
-
-
-
-
-
-
-
-
-
-
-
-
-
Murray Hill House
N/A
Median Price
Past 12 months
Past 12 months
-
-
-
-
-
-
-
-
-
-
-
-
-
-
-
-
-
-
-
-
-
-