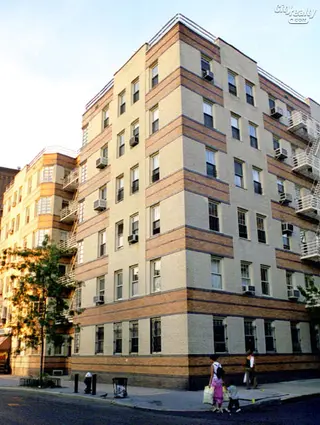
Abingdon Court, 75 Bank Street: Price Comparison
between West 4th Street & Bleecker Street Building Profile
Abingdon Court
$1,642,500
Avg. Price
Past 12 months
Past 12 months
2024
$1,047,500
2023
$1,403,750
2022
$720,855
2021
$651,000
2020
$812,500
2019
$1,235,000
2018
$794,396
2017
-
2016
$880,000
2015
-
2014
$806,942
2013
$629,625
2012
$1,176,667
2011
$1,375,000
2010
$763,577
2009
-
2008
$1,310,000
2007
$1,275,000
2006
$438,750
2005
$695,000
2004
$350,000
2003
$411,000
Abingdon Court
$1,425,000
Median Price
Past 12 months
Past 12 months
2024
$1,047,500
2023
$1,187,500
2022
$720,855
2021
$651,000
2020
$812,500
2019
$1,235,000
2018
$775,000
2017
-
2016
$880,000
2015
-
2014
$745,000
2013
$629,625
2012
$680,000
2011
$1,375,000
2010
$763,577
2009
-
2008
$1,310,000
2007
$1,275,000
2006
$438,750
2005
$695,000
2004
$350,000
2003
$411,000
Abingdon Court
$1,025,000
Avg. Price
Past 12 months
Past 12 months
2024
$595,000
2023
$742,500
2022
-
2021
$651,000
2020
$812,500
2019
$1,235,000
2018
$608,333
2017
-
2016
$585,000
2015
-
2014
$804,903
2013
$510,000
2012
$677,500
2011
-
2010
$640,000
2009
-
2008
-
2007
-
2006
$442,500
2005
-
2004
$350,000
2003
$250,000
Abingdon Court
$1,025,000
Median Price
Past 12 months
Past 12 months
2024
$595,000
2023
$742,500
2022
-
2021
$651,000
2020
$812,500
2019
$1,235,000
2018
$602,500
2017
-
2016
$585,000
2015
-
2014
$745,000
2013
$510,000
2012
$677,500
2011
-
2010
$640,000
2009
-
2008
-
2007
-
2006
$442,500
2005
-
2004
$350,000
2003
$250,000
Abingdon Court
$1,425,000
Avg. Price
Past 12 months
Past 12 months
2024
$1,500,000
2023
-
2022
-
2021
-
2020
-
2019
-
2018
$1,001,250
2017
-
2016
$1,175,000
2015
-
2014
$810,000
2013
-
2012
-
2011
$1,375,000
2010
$887,153
2009
-
2008
-
2007
-
2006
$435,000
2005
$695,000
2004
-
2003
$572,000
Abingdon Court
$1,425,000
Median Price
Past 12 months
Past 12 months
2024
$1,500,000
2023
-
2022
-
2021
-
2020
-
2019
-
2018
$1,001,250
2017
-
2016
$1,175,000
2015
-
2014
$810,000
2013
-
2012
-
2011
$1,375,000
2010
$887,153
2009
-
2008
-
2007
-
2006
$435,000
2005
$695,000
2004
-
2003
$572,000
Abingdon Court
$1,957,000
Avg. Price
Past 12 months
Past 12 months
2024
-
2023
$1,480,000
2022
$720,855
2021
-
2020
-
2019
-
2018
-
2017
-
2016
-
2015
-
2014
-
2013
-
2012
$2,175,000
2011
-
2010
-
2009
-
2008
$1,310,000
2007
$1,275,000
2006
-
2005
-
2004
-
2003
-
Abingdon Court
$1,957,000
Median Price
Past 12 months
Past 12 months
2024
-
2023
$1,480,000
2022
$720,855
2021
-
2020
-
2019
-
2018
-
2017
-
2016
-
2015
-
2014
-
2013
-
2012
$2,175,000
2011
-
2010
-
2009
-
2008
$1,310,000
2007
$1,275,000
2006
-
2005
-
2004
-
2003
-
Abingdon Court
$2,998,000
Avg. Price
Past 12 months
Past 12 months
2024
-
2023
-
2022
-
2021
-
2020
-
2019
-
2018
-
2017
-
2016
-
2015
-
2014
-
2013
-
2012
-
2011
-
2010
-
2009
-
2008
-
2007
-
2006
-
2005
-
2004
-
2003
-
Abingdon Court
$2,998,000
Median Price
Past 12 months
Past 12 months
2024
-
2023
-
2022
-
2021
-
2020
-
2019
-
2018
-
2017
-
2016
-
2015
-
2014
-
2013
-
2012
-
2011
-
2010
-
2009
-
2008
-
2007
-
2006
-
2005
-
2004
-
2003
-
Abingdon Court
N/A
Avg. Price
Past 12 months
Past 12 months
2024
-
2023
-
2022
-
2021
-
2020
-
2019
-
2018
-
2017
-
2016
-
2015
-
2014
-
2013
-
2012
-
2011
-
2010
-
2009
-
2008
-
2007
-
2006
-
2005
-
2004
-
2003
-
Abingdon Court
N/A
Median Price
Past 12 months
Past 12 months
2024
-
2023
-
2022
-
2021
-
2020
-
2019
-
2018
-
2017
-
2016
-
2015
-
2014
-
2013
-
2012
-
2011
-
2010
-
2009
-
2008
-
2007
-
2006
-
2005
-
2004
-
2003
-
720 Greenwich Street
N/A
Avg. Price / ft2
Past 12 months
Past 12 months
-
$1,150
$1,469
$1,860
-
$1,311
$1,029
-
$2,367
$1,446
-
$1,244
$1,200
$982
$1,091
$853
$1,138
$1,010
$869
$925
$763
$588
720 Greenwich Street
$3,353,333
Avg. Price
Past 12 months
Past 12 months
$805,000
$754,750
$1,183,761
$2,135,000
-
$992,000
$709,000
$1,360,000
$2,220,000
$1,265,000
$1,295,000
$740,250
$1,124,444
$788,813
$855,038
$720,000
$896,750
$567,000
$619,000
$785,833
$650,167
$512,944
720 Greenwich Street
$3,353,333
Median Price
Past 12 months
Past 12 months
$770,000
$732,000
$975,000
$2,060,000
-
$1,100,000
$720,000
$1,360,000
$2,830,000
$1,265,000
$1,295,000
$755,500
$960,000
$615,000
$840,575
$720,000
$843,500
$567,000
$545,000
$710,000
$777,500
$500,000
720 Greenwich Street
N/A
Avg. Price / ft2
Past 12 months
Past 12 months
-
$1,150
$1,341
-
-
$1,435
$1,036
-
-
-
-
-
$914
$898
$998
$811
$948
$1,010
$857
$781
$640
$487
720 Greenwich Street
N/A
Avg. Price
Past 12 months
Past 12 months
$770,000
$754,750
$733,333
$880,000
-
$689,000
$707,000
-
-
-
-
-
$580,000
$462,125
$499,000
$365,000
$550,000
$505,000
$408,000
$375,000
$288,000
$254,167
720 Greenwich Street
N/A
Median Price
Past 12 months
Past 12 months
$770,000
$732,000
$665,000
$880,000
-
$689,000
$725,000
-
-
-
-
-
$580,000
$474,250
$499,000
$365,000
$550,000
$505,000
$400,000
$375,000
$288,000
$287,500
720 Greenwich Street
N/A
Avg. Price / ft2
Past 12 months
Past 12 months
-
-
$1,308
$1,860
-
$1,187
$1,021
-
$2,367
$1,446
-
$1,244
$1,271
$1,071
$1,122
-
$1,202
-
$885
$972
$885
$649
720 Greenwich Street
N/A
Avg. Price
Past 12 months
Past 12 months
$840,000
-
$1,222,108
$2,060,000
-
$1,143,500
$715,000
$1,360,000
$1,915,000
$1,265,000
$1,295,000
$937,000
$1,126,667
$787,333
$973,717
-
$1,012,333
$629,000
$830,000
$747,500
$831,250
$642,333
720 Greenwich Street
N/A
Median Price
Past 12 months
Past 12 months
$840,000
-
$1,100,000
$2,060,000
-
$1,143,500
$715,000
$1,360,000
$1,915,000
$1,265,000
$1,295,000
$769,000
$1,045,000
$817,000
$1,062,150
-
$950,000
$629,000
$840,000
$710,000
$831,250
$647,000
720 Greenwich Street
N/A
Avg. Price / ft2
Past 12 months
Past 12 months
-
-
$2,017
-
-
-
-
-
-
-
-
-
-
-
-
$896
-
-
-
-
-
-
720 Greenwich Street
$3,353,333
Avg. Price
Past 12 months
Past 12 months
-
-
$2,420,000
-
-
-
-
-
$2,830,000
-
-
$150,000
$2,200,000
-
-
$1,075,000
-
-
-
$1,350,000
-
-
720 Greenwich Street
$3,353,333
Median Price
Past 12 months
Past 12 months
-
-
$2,420,000
-
-
-
-
-
$2,830,000
-
-
$150,000
$2,200,000
-
-
$1,075,000
-
-
-
$1,350,000
-
-
720 Greenwich Street
N/A
Avg. Price / ft2
Past 12 months
Past 12 months
-
-
-
-
-
-
-
-
-
-
-
-
-
$1,135
-
-
-
-
-
-
-
-
720 Greenwich Street
N/A
Avg. Price
Past 12 months
Past 12 months
-
-
-
$3,540,000
-
-
-
-
-
-
-
-
-
$2,100,000
-
-
-
-
-
-
-
-
720 Greenwich Street
N/A
Median Price
Past 12 months
Past 12 months
-
-
-
$3,540,000
-
-
-
-
-
-
-
-
-
$2,100,000
-
-
-
-
-
-
-
-
720 Greenwich Street
N/A
Avg. Price / ft2
Past 12 months
Past 12 months
-
-
-
-
-
-
-
-
-
-
-
-
-
-
-
-
-
-
-
-
-
-
720 Greenwich Street
N/A
Avg. Price
Past 12 months
Past 12 months
-
-
-
-
-
-
-
-
-
-
-
-
-
-
-
-
-
-
-
-
-
-
720 Greenwich Street
N/A
Median Price
Past 12 months
Past 12 months
-
-
-
-
-
-
-
-
-
-
-
-
-
-
-
-
-
-
-
-
-
-
720 Greenwich Street
N/A
Avg. Price / ft2
Past 12 months
Past 12 months
-
-
-
-
-
-
-
-
-
-
-
-
-
-
-
-
-
-
-
-
-
-
720 Greenwich Street
N/A
Avg. Price
Past 12 months
Past 12 months
-
-
-
-
-
-
-
-
-
-
-
-
-
-
-
-
-
-
-
-
-
-
720 Greenwich Street
N/A
Median Price
Past 12 months
Past 12 months
-
-
-
-
-
-
-
-
-
-
-
-
-
-
-
-
-
-
-
-
-
-
Sopilia Soap Factory Condominium
N/A
Avg. Price / ft2
Past 12 months
Past 12 months
$1,546
$1,727
-
$1,339
$1,071
-
-
-
$1,540
$833
-
$2,103
$1,158
-
-
$865
-
$1,575
-
-
$1,019
-
Sopilia Soap Factory Condominium
N/A
Avg. Price
Past 12 months
Past 12 months
$2,992,500
$3,800,000
-
$3,050,000
$2,450,000
-
-
$4,700,000
$3,388,125
$1,999,999
-
$5,347,500
$2,546,667
-
-
$2,075,000
$5,350,000
$3,175,000
$1,740,000
-
$2,050,000
$1,600,000
Sopilia Soap Factory Condominium
N/A
Median Price
Past 12 months
Past 12 months
$3,000,000
$3,800,000
-
$3,050,000
$2,450,000
-
-
$4,700,000
$3,388,125
$1,999,999
-
$5,347,500
$2,600,000
-
-
$2,075,000
$5,350,000
$3,175,000
$1,740,000
-
$2,050,000
$1,600,000
Sopilia Soap Factory Condominium
N/A
Avg. Price / ft2
Past 12 months
Past 12 months
-
-
-
-
-
-
-
-
-
-
-
-
-
-
-
-
-
-
-
-
-
-
Sopilia Soap Factory Condominium
N/A
Avg. Price
Past 12 months
Past 12 months
-
-
-
-
-
-
-
-
-
-
-
-
-
-
-
-
-
-
-
-
-
-
Sopilia Soap Factory Condominium
N/A
Median Price
Past 12 months
Past 12 months
-
-
-
-
-
-
-
-
-
-
-
-
-
-
-
-
-
-
-
-
-
-
Sopilia Soap Factory Condominium
N/A
Avg. Price / ft2
Past 12 months
Past 12 months
-
-
-
-
-
-
-
-
-
-
-
-
-
-
-
-
-
-
-
-
$958
-
Sopilia Soap Factory Condominium
N/A
Avg. Price
Past 12 months
Past 12 months
-
-
-
-
-
-
-
-
-
-
-
-
-
-
-
-
-
-
-
-
$2,050,000
-
Sopilia Soap Factory Condominium
N/A
Median Price
Past 12 months
Past 12 months
-
-
-
-
-
-
-
-
-
-
-
-
-
-
-
-
-
-
-
-
$2,050,000
-
Sopilia Soap Factory Condominium
N/A
Avg. Price / ft2
Past 12 months
Past 12 months
$1,728
-
-
$1,042
$1,205
-
-
-
$1,540
$833
-
$2,103
$1,185
-
-
$865
-
$1,934
-
-
$1,079
-
Sopilia Soap Factory Condominium
N/A
Avg. Price
Past 12 months
Past 12 months
$3,123,333
-
-
$2,500,000
$2,650,000
-
-
-
$3,388,125
$1,999,999
-
$3,995,000
$2,607,500
-
-
$2,075,000
$5,350,000
$3,675,000
$1,740,000
-
$2,050,000
$1,600,000
Sopilia Soap Factory Condominium
N/A
Median Price
Past 12 months
Past 12 months
$3,400,000
-
-
$2,500,000
$2,650,000
-
-
-
$3,388,125
$1,999,999
-
$3,995,000
$2,607,500
-
-
$2,075,000
$5,350,000
$3,675,000
$1,740,000
-
$2,050,000
$1,600,000
Sopilia Soap Factory Condominium
N/A
Avg. Price / ft2
Past 12 months
Past 12 months
$1,182
$1,727
-
$1,636
$938
-
-
-
-
-
-
-
$1,102
-
-
-
-
$1,216
-
-
-
-
Sopilia Soap Factory Condominium
N/A
Avg. Price
Past 12 months
Past 12 months
$2,600,000
$3,800,000
-
$3,600,000
$2,250,000
-
-
$4,700,000
-
-
-
$6,700,000
$2,425,000
-
-
-
-
$2,675,000
-
-
-
-
Sopilia Soap Factory Condominium
N/A
Median Price
Past 12 months
Past 12 months
$2,600,000
$3,800,000
-
$3,600,000
$2,250,000
-
-
$4,700,000
-
-
-
$6,700,000
$2,425,000
-
-
-
-
$2,675,000
-
-
-
-
Sopilia Soap Factory Condominium
N/A
Avg. Price / ft2
Past 12 months
Past 12 months
-
-
-
-
-
-
-
-
-
-
-
-
-
-
-
-
-
-
-
-
-
-
Sopilia Soap Factory Condominium
N/A
Avg. Price
Past 12 months
Past 12 months
-
-
-
-
-
-
-
-
-
-
-
-
-
-
-
-
-
-
-
-
-
-
Sopilia Soap Factory Condominium
N/A
Median Price
Past 12 months
Past 12 months
-
-
-
-
-
-
-
-
-
-
-
-
-
-
-
-
-
-
-
-
-
-
Sopilia Soap Factory Condominium
N/A
Avg. Price / ft2
Past 12 months
Past 12 months
-
-
-
-
-
-
-
-
-
-
-
-
-
-
-
-
-
-
-
-
-
-
Sopilia Soap Factory Condominium
N/A
Avg. Price
Past 12 months
Past 12 months
-
-
-
-
-
-
-
-
-
-
-
-
-
-
-
-
-
-
-
-
-
-
Sopilia Soap Factory Condominium
N/A
Median Price
Past 12 months
Past 12 months
-
-
-
-
-
-
-
-
-
-
-
-
-
-
-
-
-
-
-
-
-
-
373 Bleecker Street
N/A
Avg. Price / ft2
Past 12 months
Past 12 months
-
-
-
-
-
-
-
-
-
-
-
-
-
-
-
-
-
-
-
-
-
$741
373 Bleecker Street
$1,465,000
Avg. Price
Past 12 months
Past 12 months
$860,000
-
-
$1,500,000
-
$1,540,000
-
$715,000
$1,250,000
-
$642,500
-
$514,999
-
-
$1,175,000
$726,333
$995,000
$530,000
-
$380,000
$439,000
373 Bleecker Street
$1,465,000
Median Price
Past 12 months
Past 12 months
$860,000
-
-
$1,500,000
-
$1,540,000
-
$715,000
$1,250,000
-
$642,500
-
$514,999
-
-
$1,175,000
$644,000
$995,000
$530,000
-
$380,000
$352,000
373 Bleecker Street
N/A
Avg. Price / ft2
Past 12 months
Past 12 months
-
-
-
-
-
-
-
-
-
-
-
-
-
-
-
-
-
-
-
-
-
-
373 Bleecker Street
N/A
Avg. Price
Past 12 months
Past 12 months
-
-
-
-
-
-
-
-
-
-
-
-
$439,998
-
-
-
-
-
-
-
-
-
373 Bleecker Street
N/A
Median Price
Past 12 months
Past 12 months
-
-
-
-
-
-
-
-
-
-
-
-
$439,998
-
-
-
-
-
-
-
-
-
373 Bleecker Street
N/A
Avg. Price / ft2
Past 12 months
Past 12 months
-
-
-
-
-
-
-
-
-
-
-
-
-
-
-
-
-
-
-
-
-
-
373 Bleecker Street
$1,465,000
Avg. Price
Past 12 months
Past 12 months
$860,000
-
-
$1,500,000
-
-
-
$715,000
$1,250,000
-
$745,000
-
$590,000
-
-
$1,175,000
-
$995,000
$530,000
-
-
$335,000
373 Bleecker Street
$1,465,000
Median Price
Past 12 months
Past 12 months
$860,000
-
-
$1,500,000
-
-
-
$715,000
$1,250,000
-
$745,000
-
$590,000
-
-
$1,175,000
-
$995,000
$530,000
-
-
$335,000
373 Bleecker Street
N/A
Avg. Price / ft2
Past 12 months
Past 12 months
-
-
-
-
-
-
-
-
-
-
-
-
-
-
-
-
-
-
-
-
-
$741
373 Bleecker Street
N/A
Avg. Price
Past 12 months
Past 12 months
-
-
-
-
-
-
-
-
-
-
-
-
-
-
-
-
-
-
-
-
-
$630,000
373 Bleecker Street
N/A
Median Price
Past 12 months
Past 12 months
-
-
-
-
-
-
-
-
-
-
-
-
-
-
-
-
-
-
-
-
-
$630,000
373 Bleecker Street
N/A
Avg. Price / ft2
Past 12 months
Past 12 months
-
-
-
-
-
-
-
-
-
-
-
-
-
-
-
-
-
-
-
-
-
-
373 Bleecker Street
N/A
Avg. Price
Past 12 months
Past 12 months
-
-
-
-
-
-
-
-
-
-
-
-
-
-
-
-
-
-
-
-
-
-
373 Bleecker Street
N/A
Median Price
Past 12 months
Past 12 months
-
-
-
-
-
-
-
-
-
-
-
-
-
-
-
-
-
-
-
-
-
-
373 Bleecker Street
N/A
Avg. Price / ft2
Past 12 months
Past 12 months
-
-
-
-
-
-
-
-
-
-
-
-
-
-
-
-
-
-
-
-
-
-
373 Bleecker Street
N/A
Avg. Price
Past 12 months
Past 12 months
-
-
-
-
-
-
-
-
-
-
-
-
-
-
-
-
-
-
-
-
-
-
373 Bleecker Street
N/A
Median Price
Past 12 months
Past 12 months
-
-
-
-
-
-
-
-
-
-
-
-
-
-
-
-
-
-
-
-
-
-
318 West 14th Street
N/A
Avg. Price / ft2
Past 12 months
Past 12 months
-
-
-
-
-
-
-
-
-
-
-
-
-
-
-
-
-
-
-
-
-
-
318 West 14th Street
N/A
Avg. Price
Past 12 months
Past 12 months
-
-
-
-
-
-
-
-
-
-
-
-
-
-
-
-
$3,625,000
-
-
-
-
-
318 West 14th Street
N/A
Median Price
Past 12 months
Past 12 months
-
-
-
-
-
-
-
-
-
-
-
-
-
-
-
-
$3,625,000
-
-
-
-
-
318 West 14th Street
N/A
Avg. Price / ft2
Past 12 months
Past 12 months
-
-
-
-
-
-
-
-
-
-
-
-
-
-
-
-
-
-
-
-
-
-
318 West 14th Street
N/A
Avg. Price
Past 12 months
Past 12 months
-
-
-
-
-
-
-
-
-
-
-
-
-
-
-
-
-
-
-
-
-
-
318 West 14th Street
N/A
Median Price
Past 12 months
Past 12 months
-
-
-
-
-
-
-
-
-
-
-
-
-
-
-
-
-
-
-
-
-
-
318 West 14th Street
N/A
Avg. Price / ft2
Past 12 months
Past 12 months
-
-
-
-
-
-
-
-
-
-
-
-
-
-
-
-
-
-
-
-
-
-
318 West 14th Street
N/A
Avg. Price
Past 12 months
Past 12 months
-
-
-
-
-
-
-
-
-
-
-
-
-
-
-
-
$3,625,000
-
-
-
-
-
318 West 14th Street
N/A
Median Price
Past 12 months
Past 12 months
-
-
-
-
-
-
-
-
-
-
-
-
-
-
-
-
$3,625,000
-
-
-
-
-
318 West 14th Street
N/A
Avg. Price / ft2
Past 12 months
Past 12 months
-
-
-
-
-
-
-
-
-
-
-
-
-
-
-
-
-
-
-
-
-
-
318 West 14th Street
N/A
Avg. Price
Past 12 months
Past 12 months
-
-
-
-
-
-
-
-
-
-
-
-
-
-
-
-
-
-
-
-
-
-
318 West 14th Street
N/A
Median Price
Past 12 months
Past 12 months
-
-
-
-
-
-
-
-
-
-
-
-
-
-
-
-
-
-
-
-
-
-
318 West 14th Street
N/A
Avg. Price / ft2
Past 12 months
Past 12 months
-
-
-
-
-
-
-
-
-
-
-
-
-
-
-
-
-
-
-
-
-
-
318 West 14th Street
N/A
Avg. Price
Past 12 months
Past 12 months
-
-
-
-
-
-
-
-
-
-
-
-
-
-
-
-
-
-
-
-
-
-
318 West 14th Street
N/A
Median Price
Past 12 months
Past 12 months
-
-
-
-
-
-
-
-
-
-
-
-
-
-
-
-
-
-
-
-
-
-
158 Bank Street
N/A
Avg. Price / ft2
Past 12 months
Past 12 months
-
-
-
-
-
-
-
-
-
-
-
-
-
-
-
-
-
-
-
-
-
-
158 Bank Street
N/A
Avg. Price
Past 12 months
Past 12 months
-
-
-
-
-
-
-
$1,170,000
-
-
-
-
-
-
-
-
-
-
-
-
-
-
158 Bank Street
N/A
Median Price
Past 12 months
Past 12 months
-
-
-
-
-
-
-
$1,170,000
-
-
-
-
-
-
-
-
-
-
-
-
-
-
158 Bank Street
N/A
Avg. Price / ft2
Past 12 months
Past 12 months
-
-
-
-
-
-
-
-
-
-
-
-
-
-
-
-
-
-
-
-
-
-
158 Bank Street
N/A
Avg. Price
Past 12 months
Past 12 months
-
-
-
-
-
-
-
-
-
-
-
-
-
-
-
-
-
-
-
-
-
-
158 Bank Street
N/A
Median Price
Past 12 months
Past 12 months
-
-
-
-
-
-
-
-
-
-
-
-
-
-
-
-
-
-
-
-
-
-
158 Bank Street
N/A
Avg. Price / ft2
Past 12 months
Past 12 months
-
-
-
-
-
-
-
-
-
-
-
-
-
-
-
-
-
-
-
-
-
-
158 Bank Street
N/A
Avg. Price
Past 12 months
Past 12 months
-
-
-
-
-
-
-
$1,170,000
-
-
-
-
-
-
-
-
-
-
-
-
-
-
158 Bank Street
N/A
Median Price
Past 12 months
Past 12 months
-
-
-
-
-
-
-
$1,170,000
-
-
-
-
-
-
-
-
-
-
-
-
-
-
158 Bank Street
N/A
Avg. Price / ft2
Past 12 months
Past 12 months
-
-
-
-
-
-
-
-
-
-
-
-
-
-
-
-
-
-
-
-
-
-
158 Bank Street
N/A
Avg. Price
Past 12 months
Past 12 months
-
-
-
-
-
-
-
-
-
-
-
-
-
-
-
-
-
-
-
-
-
-
158 Bank Street
N/A
Median Price
Past 12 months
Past 12 months
-
-
-
-
-
-
-
-
-
-
-
-
-
-
-
-
-
-
-
-
-
-
158 Bank Street
N/A
Avg. Price / ft2
Past 12 months
Past 12 months
-
-
-
-
-
-
-
-
-
-
-
-
-
-
-
-
-
-
-
-
-
-
158 Bank Street
N/A
Avg. Price
Past 12 months
Past 12 months
-
-
-
-
-
-
-
-
-
-
-
-
-
-
-
-
-
-
-
-
-
-
158 Bank Street
N/A
Median Price
Past 12 months
Past 12 months
-
-
-
-
-
-
-
-
-
-
-
-
-
-
-
-
-
-
-
-
-
-
349 West 11th Street
N/A
Avg. Price / ft2
Past 12 months
Past 12 months
-
-
-
-
-
-
-
-
-
-
$1,513
-
-
-
$1,102
-
-
-
-
-
-
-
349 West 11th Street
N/A
Avg. Price
Past 12 months
Past 12 months
-
-
-
-
-
-
-
-
-
$2,735,900
$1,210,000
-
-
-
$881,600
-
-
-
-
-
-
-
349 West 11th Street
N/A
Median Price
Past 12 months
Past 12 months
-
-
-
-
-
-
-
-
-
$2,735,900
$1,210,000
-
-
-
$881,600
-
-
-
-
-
-
-
349 West 11th Street
N/A
Avg. Price / ft2
Past 12 months
Past 12 months
-
-
-
-
-
-
-
-
-
-
-
-
-
-
-
-
-
-
-
-
-
-
349 West 11th Street
N/A
Avg. Price
Past 12 months
Past 12 months
-
-
-
-
-
-
-
-
-
-
-
-
-
-
-
-
-
-
-
-
-
-
349 West 11th Street
N/A
Median Price
Past 12 months
Past 12 months
-
-
-
-
-
-
-
-
-
-
-
-
-
-
-
-
-
-
-
-
-
-
349 West 11th Street
N/A
Avg. Price / ft2
Past 12 months
Past 12 months
-
-
-
-
-
-
-
-
-
-
-
-
-
-
-
-
-
-
-
-
-
-
349 West 11th Street
N/A
Avg. Price
Past 12 months
Past 12 months
-
-
-
-
-
-
-
-
-
-
-
-
-
-
-
-
-
-
-
-
-
-
349 West 11th Street
N/A
Median Price
Past 12 months
Past 12 months
-
-
-
-
-
-
-
-
-
-
-
-
-
-
-
-
-
-
-
-
-
-
327 West 11th Street
N/A
Avg. Price / ft2
Past 12 months
Past 12 months
-
-
-
-
-
-
-
-
-
-
-
-
-
-
-
-
-
-
-
-
-
-
327 West 11th Street
$1,100,000
Avg. Price
Past 12 months
Past 12 months
$1,250,000
$970,000
$1,450,000
$950,000
$1,097,769
-
-
$899,210
-
-
$1,195,000
-
-
-
-
-
$610,000
$585,000
-
-
-
-
327 West 11th Street
$1,100,000
Median Price
Past 12 months
Past 12 months
$1,250,000
$970,000
$1,450,000
$950,000
$1,097,769
-
-
$899,210
-
-
$1,195,000
-
-
-
-
-
$610,000
$585,000
-
-
-
-
327 West 11th Street
N/A
Avg. Price / ft2
Past 12 months
Past 12 months
-
-
-
-
-
-
-
-
-
-
-
-
-
-
-
-
-
-
-
-
-
-
327 West 11th Street
N/A
Avg. Price
Past 12 months
Past 12 months
-
-
-
-
-
-
-
-
-
-
-
-
-
-
-
-
-
-
-
-
-
-
327 West 11th Street
N/A
Median Price
Past 12 months
Past 12 months
-
-
-
-
-
-
-
-
-
-
-
-
-
-
-
-
-
-
-
-
-
-
327 West 11th Street
N/A
Avg. Price / ft2
Past 12 months
Past 12 months
-
-
-
-
-
-
-
-
-
-
-
-
-
-
-
-
-
-
-
-
-
-
327 West 11th Street
N/A
Avg. Price
Past 12 months
Past 12 months
-
-
$1,450,000
$950,000
$1,097,769
-
-
$899,210
-
-
-
-
-
-
-
-
-
-
-
-
-
-
327 West 11th Street
N/A
Median Price
Past 12 months
Past 12 months
-
-
$1,450,000
$950,000
$1,097,769
-
-
$899,210
-
-
-
-
-
-
-
-
-
-
-
-
-
-
327 West 11th Street
N/A
Avg. Price / ft2
Past 12 months
Past 12 months
-
-
-
-
-
-
-
-
-
-
-
-
-
-
-
-
-
-
-
-
-
-
327 West 11th Street
$1,100,000
Avg. Price
Past 12 months
Past 12 months
$1,250,000
$970,000
-
-
-
-
-
-
-
-
$1,195,000
-
-
-
-
-
$610,000
$585,000
-
-
-
-
327 West 11th Street
$1,100,000
Median Price
Past 12 months
Past 12 months
$1,250,000
$970,000
-
-
-
-
-
-
-
-
$1,195,000
-
-
-
-
-
$610,000
$585,000
-
-
-
-
327 West 11th Street
N/A
Avg. Price / ft2
Past 12 months
Past 12 months
-
-
-
-
-
-
-
-
-
-
-
-
-
-
-
-
-
-
-
-
-
-
327 West 11th Street
N/A
Avg. Price
Past 12 months
Past 12 months
-
-
-
-
-
-
-
-
-
-
-
-
-
-
-
-
-
-
-
-
-
-
327 West 11th Street
N/A
Median Price
Past 12 months
Past 12 months
-
-
-
-
-
-
-
-
-
-
-
-
-
-
-
-
-
-
-
-
-
-
327 West 11th Street
N/A
Avg. Price / ft2
Past 12 months
Past 12 months
-
-
-
-
-
-
-
-
-
-
-
-
-
-
-
-
-
-
-
-
-
-
327 West 11th Street
N/A
Avg. Price
Past 12 months
Past 12 months
-
-
-
-
-
-
-
-
-
-
-
-
-
-
-
-
-
-
-
-
-
-
327 West 11th Street
N/A
Median Price
Past 12 months
Past 12 months
-
-
-
-
-
-
-
-
-
-
-
-
-
-
-
-
-
-
-
-
-
-
Hudson Mews
$3,182
Avg. Price / ft2
Past 12 months
Past 12 months
-
-
$1,502
-
-
$1,441
$2,357
$1,783
-
-
-
$1,238
$1,271
-
$841
-
-
$1,192
-
-
-
-
Hudson Mews
$3,867,500
Avg. Price
Past 12 months
Past 12 months
-
$3,258,333
$2,560,000
-
-
$1,585,000
$3,300,000
$2,140,000
-
-
$3,510,000
$1,705,000
$2,557,000
-
$925,000
-
-
$2,154,000
$1,685,000
-
$500,254
-
Hudson Mews
$4,097,500
Median Price
Past 12 months
Past 12 months
-
$3,400,000
$2,560,000
-
-
$1,585,000
$3,300,000
$2,140,000
-
-
$3,510,000
$1,705,000
$2,600,000
-
$925,000
-
-
$2,050,000
$1,685,000
-
$500,254
-
Hudson Mews
N/A
Avg. Price / ft2
Past 12 months
Past 12 months
-
-
-
-
-
-
-
-
-
-
-
-
-
-
-
-
-
-
-
-
-
-
Hudson Mews
N/A
Avg. Price
Past 12 months
Past 12 months
-
-
-
-
-
-
-
-
-
-
-
-
-
-
-
-
-
-
-
-
-
-
Hudson Mews
N/A
Median Price
Past 12 months
Past 12 months
-
-
-
-
-
-
-
-
-
-
-
-
-
-
-
-
-
-
-
-
-
-
Hudson Mews
N/A
Avg. Price / ft2
Past 12 months
Past 12 months
-
-
-
-
-
$1,441
-
-
-
-
-
-
-
-
$841
-
-
-
-
-
-
-
Hudson Mews
$4,600,000
Avg. Price
Past 12 months
Past 12 months
-
-
-
-
-
$1,585,000
-
-
-
-
$3,510,000
-
$2,600,000
-
$925,000
-
-
-
$1,685,000
-
-
-
Hudson Mews
$4,600,000
Median Price
Past 12 months
Past 12 months
-
-
-
-
-
$1,585,000
-
-
-
-
$3,510,000
-
$2,600,000
-
$925,000
-
-
-
$1,685,000
-
-
-
Hudson Mews
$3,579
Avg. Price / ft2
Past 12 months
Past 12 months
-
-
$1,502
-
-
-
-
$1,783
-
-
-
$1,238
-
-
-
-
-
$1,171
-
-
-
-
Hudson Mews
$3,485,000
Avg. Price
Past 12 months
Past 12 months
-
$3,258,333
$2,560,000
-
-
-
-
$2,140,000
-
-
-
$1,705,000
$2,021,000
-
-
-
-
$2,050,000
-
-
$500,254
-
Hudson Mews
$3,485,000
Median Price
Past 12 months
Past 12 months
-
$3,400,000
$2,560,000
-
-
-
-
$2,140,000
-
-
-
$1,705,000
$2,021,000
-
-
-
-
$2,050,000
-
-
$500,254
-
Hudson Mews
$2,786
Avg. Price / ft2
Past 12 months
Past 12 months
-
-
-
-
-
-
$2,357
-
-
-
-
-
$1,271
-
-
-
-
$1,202
-
-
-
-
Hudson Mews
$3,900,000
Avg. Price
Past 12 months
Past 12 months
-
-
-
-
-
-
$3,300,000
-
-
-
-
-
$3,050,000
-
-
-
-
$2,206,000
-
-
-
-
Hudson Mews
$3,900,000
Median Price
Past 12 months
Past 12 months
-
-
-
-
-
-
$3,300,000
-
-
-
-
-
$3,050,000
-
-
-
-
$2,206,000
-
-
-
-
Hudson Mews
N/A
Avg. Price / ft2
Past 12 months
Past 12 months
-
-
-
-
-
-
-
-
-
-
-
-
-
-
-
-
-
-
-
-
-
-
Hudson Mews
N/A
Avg. Price
Past 12 months
Past 12 months
-
-
-
-
-
-
-
-
-
-
-
-
-
-
-
-
-
-
-
-
-
-
Hudson Mews
N/A
Median Price
Past 12 months
Past 12 months
-
-
-
-
-
-
-
-
-
-
-
-
-
-
-
-
-
-
-
-
-
-
Hudson Mews
N/A
Avg. Price / ft2
Past 12 months
Past 12 months
-
-
-
-
-
-
-
-
-
-
-
-
-
-
-
-
-
-
-
-
-
-
Hudson Mews
N/A
Avg. Price
Past 12 months
Past 12 months
-
-
-
-
-
-
-
-
-
-
-
-
-
-
-
-
-
-
-
-
-
-
Hudson Mews
N/A
Median Price
Past 12 months
Past 12 months
-
-
-
-
-
-
-
-
-
-
-
-
-
-
-
-
-
-
-
-
-
-
Greenwich House
$2,785
Avg. Price / ft2
Past 12 months
Past 12 months
-
-
-
-
-
$1,872
-
-
$1,816
-
-
-
$1,351
$1,214
$897
$1,000
-
$1,667
$700
-
-
-
Greenwich House
$9,631,250
Avg. Price
Past 12 months
Past 12 months
$5,250,000
-
-
-
-
$3,800,000
$3,850,000
-
$3,995,000
$3,450,000
-
-
$2,971,500
$2,550,000
$1,725,000
$2,100,000
-
$3,375,000
$1,225,000
-
-
-
Greenwich House
$9,631,250
Median Price
Past 12 months
Past 12 months
$5,250,000
-
-
-
-
$3,800,000
$3,850,000
-
$3,995,000
$3,450,000
-
-
$2,971,500
$2,550,000
$1,725,000
$2,100,000
-
$3,375,000
$1,225,000
-
-
-
Greenwich House
N/A
Avg. Price / ft2
Past 12 months
Past 12 months
-
-
-
-
-
-
-
-
-
-
-
-
-
-
$686
-
-
-
$700
-
-
-
Greenwich House
N/A
Avg. Price
Past 12 months
Past 12 months
-
-
-
-
-
-
-
-
-
-
-
-
-
-
$1,200,000
-
-
-
$1,225,000
-
-
-
Greenwich House
N/A
Median Price
Past 12 months
Past 12 months
-
-
-
-
-
-
-
-
-
-
-
-
-
-
$1,200,000
-
-
-
$1,225,000
-
-
-
Greenwich House
N/A
Avg. Price / ft2
Past 12 months
Past 12 months
-
-
-
-
-
-
-
-
-
-
-
-
-
-
-
-
-
-
-
-
-
-
Greenwich House
N/A
Avg. Price
Past 12 months
Past 12 months
-
-
-
-
-
-
-
-
-
-
-
-
-
-
-
-
-
-
-
-
-
-
Greenwich House
N/A
Median Price
Past 12 months
Past 12 months
-
-
-
-
-
-
-
-
-
-
-
-
-
-
-
-
-
-
-
-
-
-
Greenwich House
$2,052
Avg. Price / ft2
Past 12 months
Past 12 months
-
-
-
-
-
$1,872
-
-
$1,816
-
-
-
$1,665
$1,214
$1,108
$1,000
-
$1,667
-
-
-
-
Greenwich House
$4,612,500
Avg. Price
Past 12 months
Past 12 months
-
-
-
-
-
$3,800,000
-
-
$3,995,000
$3,450,000
-
-
$3,663,000
$2,550,000
$2,250,000
$2,100,000
-
$3,375,000
-
-
-
-
Greenwich House
$4,612,500
Median Price
Past 12 months
Past 12 months
-
-
-
-
-
$3,800,000
-
-
$3,995,000
$3,450,000
-
-
$3,663,000
$2,550,000
$2,250,000
$2,100,000
-
$3,375,000
-
-
-
-
Greenwich House
N/A
Avg. Price / ft2
Past 12 months
Past 12 months
-
-
-
-
-
-
-
-
-
-
-
-
$1,036
-
-
-
-
-
-
-
-
-
Greenwich House
N/A
Avg. Price
Past 12 months
Past 12 months
-
-
-
-
-
-
-
-
-
-
-
-
$2,280,000
-
-
-
-
-
-
-
-
-
Greenwich House
N/A
Median Price
Past 12 months
Past 12 months
-
-
-
-
-
-
-
-
-
-
-
-
$2,280,000
-
-
-
-
-
-
-
-
-
Greenwich House
$3,519
Avg. Price / ft2
Past 12 months
Past 12 months
-
-
-
-
-
-
-
-
-
-
-
-
-
-
-
-
-
-
-
-
-
-
Greenwich House
$14,650,000
Avg. Price
Past 12 months
Past 12 months
$5,250,000
-
-
-
-
-
$3,850,000
-
-
-
-
-
-
-
-
-
-
-
-
-
-
-
Greenwich House
$14,650,000
Median Price
Past 12 months
Past 12 months
$5,250,000
-
-
-
-
-
$3,850,000
-
-
-
-
-
-
-
-
-
-
-
-
-
-
-
Greenwich House
N/A
Avg. Price / ft2
Past 12 months
Past 12 months
-
-
-
-
-
-
-
-
-
-
-
-
-
-
-
-
-
-
-
-
-
-
Greenwich House
N/A
Avg. Price
Past 12 months
Past 12 months
-
-
-
-
-
-
-
-
-
-
-
-
-
-
-
-
-
-
-
-
-
-
Greenwich House
N/A
Median Price
Past 12 months
Past 12 months
-
-
-
-
-
-
-
-
-
-
-
-
-
-
-
-
-
-
-
-
-
-
Tudor Arms
$995
Avg. Price / ft2
Past 12 months
Past 12 months
-
$1,350
$1,738
$1,417
-
$1,198
$1,083
$1,500
-
-
-
-
$1,046
-
-
-
$1,002
$943
$1,017
-
-
-
Tudor Arms
$936,000
Avg. Price
Past 12 months
Past 12 months
$1,099,125
$871,403
$927,667
$850,000
-
$716,800
$650,000
$710,000
-
-
$895,000
$850,000
$627,700
$537,000
-
$550,000
$663,000
$520,767
$501,621
-
-
-
Tudor Arms
$995,000
Median Price
Past 12 months
Past 12 months
$1,099,125
$810,000
$985,000
$850,000
-
$705,000
$650,000
$710,000
-
-
$895,000
$850,000
$627,700
$537,000
-
$550,000
$663,000
$582,500
$501,621
-
-
-
Tudor Arms
N/A
Avg. Price / ft2
Past 12 months
Past 12 months
-
-
-
-
-
-
-
$1,500
-
-
-
-
-
-
-
-
-
$912
-
-
-
-
Tudor Arms
$580,000
Avg. Price
Past 12 months
Past 12 months
-
$654,209
$698,000
-
-
$415,800
-
$600,000
-
-
-
-
-
$299,000
-
-
-
$364,800
-
-
-
-
Tudor Arms
$580,000
Median Price
Past 12 months
Past 12 months
-
$654,209
$698,000
-
-
$415,800
-
$600,000
-
-
-
-
-
$299,000
-
-
-
$364,800
-
-
-
-
Tudor Arms
N/A
Avg. Price / ft2
Past 12 months
Past 12 months
-
$1,350
$1,738
$1,417
-
$1,141
$1,083
-
-
-
-
-
$1,046
-
-
-
$1,002
$958
-
-
-
-
Tudor Arms
$1,035,000
Avg. Price
Past 12 months
Past 12 months
$1,099,125
$980,000
$1,042,500
$850,000
-
$708,750
$650,000
$820,000
-
-
$895,000
$850,000
$627,700
$775,000
-
$550,000
$663,000
$598,750
$189,660
-
-
-
Tudor Arms
$1,130,000
Median Price
Past 12 months
Past 12 months
$1,099,125
$980,000
$1,042,500
$850,000
-
$705,000
$650,000
$820,000
-
-
$895,000
$850,000
$627,700
$775,000
-
$550,000
$663,000
$598,750
$189,660
-
-
-
Tudor Arms
N/A
Avg. Price / ft2
Past 12 months
Past 12 months
-
-
-
-
-
$1,313
-
-
-
-
-
-
-
-
-
-
-
-
$1,017
-
-
-
Tudor Arms
N/A
Avg. Price
Past 12 months
Past 12 months
-
-
-
-
-
$1,050,000
-
-
-
-
-
-
-
-
-
-
-
-
$813,581
-
-
-
Tudor Arms
N/A
Median Price
Past 12 months
Past 12 months
-
-
-
-
-
$1,050,000
-
-
-
-
-
-
-
-
-
-
-
-
$813,581
-
-
-
Tudor Arms
$995
Avg. Price / ft2
Past 12 months
Past 12 months
-
-
-
-
-
-
-
-
-
-
-
-
-
-
-
-
-
-
-
-
-
-
Tudor Arms
$995,000
Avg. Price
Past 12 months
Past 12 months
-
-
-
-
-
-
-
-
-
-
-
-
-
-
-
-
-
-
-
-
-
-
Tudor Arms
$995,000
Median Price
Past 12 months
Past 12 months
-
-
-
-
-
-
-
-
-
-
-
-
-
-
-
-
-
-
-
-
-
-
Tudor Arms
N/A
Avg. Price / ft2
Past 12 months
Past 12 months
-
-
-
-
-
-
-
-
-
-
-
-
-
-
-
-
-
-
-
-
-
-
Tudor Arms
N/A
Avg. Price
Past 12 months
Past 12 months
-
-
-
-
-
-
-
-
-
-
-
-
-
-
-
-
-
-
-
-
-
-
Tudor Arms
N/A
Median Price
Past 12 months
Past 12 months
-
-
-
-
-
-
-
-
-
-
-
-
-
-
-
-
-
-
-
-
-
-