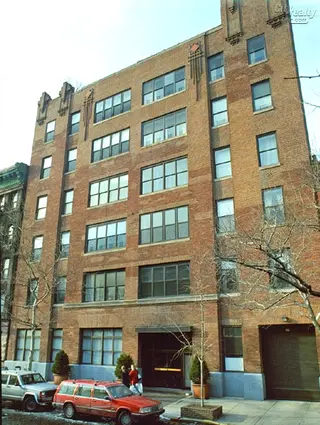
Greenwich House, 247 West 12th Street: Price Comparison
between Greenwich Avenue & West 4th Street Building Profile
Greenwich House
N/A
Avg. Price
Past 12 months
Past 12 months
2025
$9,631,250
2024
$5,250,000
2023
-
2022
-
2021
-
2020
-
2019
$3,800,000
2018
$3,850,000
2017
-
2016
$3,995,000
2015
$3,450,000
2014
-
2013
-
2012
$2,971,500
2011
$2,550,000
2010
$1,725,000
2009
$2,100,000
2008
-
2007
$3,375,000
2006
$1,225,000
2005
-
2004
-
2003
-
Greenwich House
N/A
Median Price
Past 12 months
Past 12 months
2025
$9,631,250
2024
$5,250,000
2023
-
2022
-
2021
-
2020
-
2019
$3,800,000
2018
$3,850,000
2017
-
2016
$3,995,000
2015
$3,450,000
2014
-
2013
-
2012
$2,971,500
2011
$2,550,000
2010
$1,725,000
2009
$2,100,000
2008
-
2007
$3,375,000
2006
$1,225,000
2005
-
2004
-
2003
-
Greenwich House
N/A
Avg. Price
Past 12 months
Past 12 months
2025
-
2024
-
2023
-
2022
-
2021
-
2020
-
2019
-
2018
-
2017
-
2016
-
2015
-
2014
-
2013
-
2012
-
2011
-
2010
$1,200,000
2009
-
2008
-
2007
-
2006
$1,225,000
2005
-
2004
-
2003
-
Greenwich House
N/A
Median Price
Past 12 months
Past 12 months
2025
-
2024
-
2023
-
2022
-
2021
-
2020
-
2019
-
2018
-
2017
-
2016
-
2015
-
2014
-
2013
-
2012
-
2011
-
2010
$1,200,000
2009
-
2008
-
2007
-
2006
$1,225,000
2005
-
2004
-
2003
-
Greenwich House
N/A
Avg. Price
Past 12 months
Past 12 months
2025
-
2024
-
2023
-
2022
-
2021
-
2020
-
2019
-
2018
-
2017
-
2016
-
2015
-
2014
-
2013
-
2012
-
2011
-
2010
-
2009
-
2008
-
2007
-
2006
-
2005
-
2004
-
2003
-
Greenwich House
N/A
Median Price
Past 12 months
Past 12 months
2025
-
2024
-
2023
-
2022
-
2021
-
2020
-
2019
-
2018
-
2017
-
2016
-
2015
-
2014
-
2013
-
2012
-
2011
-
2010
-
2009
-
2008
-
2007
-
2006
-
2005
-
2004
-
2003
-
Greenwich House
N/A
Avg. Price
Past 12 months
Past 12 months
2025
$4,612,500
2024
-
2023
-
2022
-
2021
-
2020
-
2019
$3,800,000
2018
-
2017
-
2016
$3,995,000
2015
$3,450,000
2014
-
2013
-
2012
$3,663,000
2011
$2,550,000
2010
$2,250,000
2009
$2,100,000
2008
-
2007
$3,375,000
2006
-
2005
-
2004
-
2003
-
Greenwich House
N/A
Median Price
Past 12 months
Past 12 months
2025
$4,612,500
2024
-
2023
-
2022
-
2021
-
2020
-
2019
$3,800,000
2018
-
2017
-
2016
$3,995,000
2015
$3,450,000
2014
-
2013
-
2012
$3,663,000
2011
$2,550,000
2010
$2,250,000
2009
$2,100,000
2008
-
2007
$3,375,000
2006
-
2005
-
2004
-
2003
-
Greenwich House
N/A
Avg. Price
Past 12 months
Past 12 months
2025
-
2024
-
2023
-
2022
-
2021
-
2020
-
2019
-
2018
-
2017
-
2016
-
2015
-
2014
-
2013
-
2012
$2,280,000
2011
-
2010
-
2009
-
2008
-
2007
-
2006
-
2005
-
2004
-
2003
-
Greenwich House
N/A
Median Price
Past 12 months
Past 12 months
2025
-
2024
-
2023
-
2022
-
2021
-
2020
-
2019
-
2018
-
2017
-
2016
-
2015
-
2014
-
2013
-
2012
$2,280,000
2011
-
2010
-
2009
-
2008
-
2007
-
2006
-
2005
-
2004
-
2003
-
Greenwich House
N/A
Avg. Price
Past 12 months
Past 12 months
2025
$14,650,000
2024
$5,250,000
2023
-
2022
-
2021
-
2020
-
2019
-
2018
$3,850,000
2017
-
2016
-
2015
-
2014
-
2013
-
2012
-
2011
-
2010
-
2009
-
2008
-
2007
-
2006
-
2005
-
2004
-
2003
-
Greenwich House
N/A
Median Price
Past 12 months
Past 12 months
2025
$14,650,000
2024
$5,250,000
2023
-
2022
-
2021
-
2020
-
2019
-
2018
$3,850,000
2017
-
2016
-
2015
-
2014
-
2013
-
2012
-
2011
-
2010
-
2009
-
2008
-
2007
-
2006
-
2005
-
2004
-
2003
-
Greenwich House
N/A
Avg. Price
Past 12 months
Past 12 months
2025
-
2024
-
2023
-
2022
-
2021
-
2020
-
2019
-
2018
-
2017
-
2016
-
2015
-
2014
-
2013
-
2012
-
2011
-
2010
-
2009
-
2008
-
2007
-
2006
-
2005
-
2004
-
2003
-
Greenwich House
N/A
Median Price
Past 12 months
Past 12 months
2025
-
2024
-
2023
-
2022
-
2021
-
2020
-
2019
-
2018
-
2017
-
2016
-
2015
-
2014
-
2013
-
2012
-
2011
-
2010
-
2009
-
2008
-
2007
-
2006
-
2005
-
2004
-
2003
-
Hudson Mews
$3,579
Avg. Price / ft2
Past 12 months
Past 12 months
$3,182
-
-
$1,502
-
-
$1,441
$2,357
$1,783
-
-
-
$1,238
$1,271
-
$841
-
-
$1,192
-
-
-
-
Hudson Mews
$3,856,667
Avg. Price
Past 12 months
Past 12 months
$4,097,500
-
$3,258,333
$2,560,000
-
-
$1,585,000
$3,300,000
$2,140,000
-
-
$3,510,000
$1,705,000
$2,557,000
-
$925,000
-
-
$2,154,000
$1,685,000
-
$500,254
-
Hudson Mews
$4,295,000
Median Price
Past 12 months
Past 12 months
$4,097,500
-
$3,400,000
$2,560,000
-
-
$1,585,000
$3,300,000
$2,140,000
-
-
$3,510,000
$1,705,000
$2,600,000
-
$925,000
-
-
$2,050,000
$1,685,000
-
$500,254
-
Hudson Mews
N/A
Avg. Price / ft2
Past 12 months
Past 12 months
-
-
-
-
-
-
-
-
-
-
-
-
-
-
-
-
-
-
-
-
-
-
-
Hudson Mews
N/A
Avg. Price
Past 12 months
Past 12 months
-
-
-
-
-
-
-
-
-
-
-
-
-
-
-
-
-
-
-
-
-
-
-
Hudson Mews
N/A
Median Price
Past 12 months
Past 12 months
-
-
-
-
-
-
-
-
-
-
-
-
-
-
-
-
-
-
-
-
-
-
-
Hudson Mews
N/A
Avg. Price / ft2
Past 12 months
Past 12 months
-
-
-
-
-
-
$1,441
-
-
-
-
-
-
-
-
$841
-
-
-
-
-
-
-
Hudson Mews
$4,600,000
Avg. Price
Past 12 months
Past 12 months
-
-
-
-
-
-
$1,585,000
-
-
-
-
$3,510,000
-
$2,600,000
-
$925,000
-
-
-
$1,685,000
-
-
-
Hudson Mews
$4,600,000
Median Price
Past 12 months
Past 12 months
-
-
-
-
-
-
$1,585,000
-
-
-
-
$3,510,000
-
$2,600,000
-
$925,000
-
-
-
$1,685,000
-
-
-
Hudson Mews
$3,579
Avg. Price / ft2
Past 12 months
Past 12 months
$3,579
-
-
$1,502
-
-
-
-
$1,783
-
-
-
$1,238
-
-
-
-
-
$1,171
-
-
-
-
Hudson Mews
$3,485,000
Avg. Price
Past 12 months
Past 12 months
$4,295,000
-
$3,258,333
$2,560,000
-
-
-
-
$2,140,000
-
-
-
$1,705,000
$2,021,000
-
-
-
-
$2,050,000
-
-
$500,254
-
Hudson Mews
$3,485,000
Median Price
Past 12 months
Past 12 months
$4,295,000
-
$3,400,000
$2,560,000
-
-
-
-
$2,140,000
-
-
-
$1,705,000
$2,021,000
-
-
-
-
$2,050,000
-
-
$500,254
-
Hudson Mews
N/A
Avg. Price / ft2
Past 12 months
Past 12 months
$2,786
-
-
-
-
-
-
$2,357
-
-
-
-
-
$1,271
-
-
-
-
$1,202
-
-
-
-
Hudson Mews
N/A
Avg. Price
Past 12 months
Past 12 months
$3,900,000
-
-
-
-
-
-
$3,300,000
-
-
-
-
-
$3,050,000
-
-
-
-
$2,206,000
-
-
-
-
Hudson Mews
N/A
Median Price
Past 12 months
Past 12 months
$3,900,000
-
-
-
-
-
-
$3,300,000
-
-
-
-
-
$3,050,000
-
-
-
-
$2,206,000
-
-
-
-
Hudson Mews
N/A
Avg. Price / ft2
Past 12 months
Past 12 months
-
-
-
-
-
-
-
-
-
-
-
-
-
-
-
-
-
-
-
-
-
-
-
Hudson Mews
N/A
Avg. Price
Past 12 months
Past 12 months
-
-
-
-
-
-
-
-
-
-
-
-
-
-
-
-
-
-
-
-
-
-
-
Hudson Mews
N/A
Median Price
Past 12 months
Past 12 months
-
-
-
-
-
-
-
-
-
-
-
-
-
-
-
-
-
-
-
-
-
-
-
Hudson Mews
N/A
Avg. Price / ft2
Past 12 months
Past 12 months
-
-
-
-
-
-
-
-
-
-
-
-
-
-
-
-
-
-
-
-
-
-
-
Hudson Mews
N/A
Avg. Price
Past 12 months
Past 12 months
-
-
-
-
-
-
-
-
-
-
-
-
-
-
-
-
-
-
-
-
-
-
-
Hudson Mews
N/A
Median Price
Past 12 months
Past 12 months
-
-
-
-
-
-
-
-
-
-
-
-
-
-
-
-
-
-
-
-
-
-
-
The Stafford Mews
$1,906
Avg. Price / ft2
Past 12 months
Past 12 months
$1,837
$1,320
$1,245
$1,708
-
-
$1,430
$1,213
$1,399
-
$1,233
-
-
$1,119
-
-
$1,111
-
-
-
-
-
-
The Stafford Mews
$4,172,500
Avg. Price
Past 12 months
Past 12 months
$3,950,000
$2,028,333
$2,490,000
$3,800,000
-
-
$3,075,000
$2,135,000
$2,325,000
-
$2,650,000
-
$1,300,000
$2,350,000
$2,900,000
-
$1,900,000
$1,350,000
-
-
$910,000
-
-
The Stafford Mews
$4,172,500
Median Price
Past 12 months
Past 12 months
$3,950,000
$2,060,000
$2,490,000
$3,800,000
-
-
$3,075,000
$2,135,000
$2,325,000
-
$2,650,000
-
$1,300,000
$2,350,000
$2,900,000
-
$1,900,000
$1,350,000
-
-
$910,000
-
-
The Stafford Mews
N/A
Avg. Price / ft2
Past 12 months
Past 12 months
-
-
-
-
-
-
-
-
-
-
-
-
-
-
-
-
-
-
-
-
-
-
-
The Stafford Mews
N/A
Avg. Price
Past 12 months
Past 12 months
-
$1,300,000
-
-
-
-
-
-
-
-
-
-
-
-
-
-
-
-
-
-
-
-
-
The Stafford Mews
N/A
Median Price
Past 12 months
Past 12 months
-
$1,300,000
-
-
-
-
-
-
-
-
-
-
-
-
-
-
-
-
-
-
-
-
-
The Stafford Mews
N/A
Avg. Price / ft2
Past 12 months
Past 12 months
-
$1,373
-
-
-
-
-
-
$1,393
-
-
-
-
-
-
-
-
-
-
-
-
-
-
The Stafford Mews
N/A
Avg. Price
Past 12 months
Past 12 months
-
$2,060,000
-
-
-
-
-
-
$1,700,000
-
-
-
$1,300,000
-
-
-
-
-
-
-
$910,000
-
-
The Stafford Mews
N/A
Median Price
Past 12 months
Past 12 months
-
$2,060,000
-
-
-
-
-
-
$1,700,000
-
-
-
$1,300,000
-
-
-
-
-
-
-
$910,000
-
-
The Stafford Mews
$1,837
Avg. Price / ft2
Past 12 months
Past 12 months
$1,837
$1,267
$1,245
$1,708
-
-
$1,430
-
-
-
$1,233
-
-
-
-
-
$1,111
-
-
-
-
-
-
The Stafford Mews
$3,950,000
Avg. Price
Past 12 months
Past 12 months
$3,950,000
$2,725,000
$2,490,000
$3,800,000
-
-
$3,075,000
$1,570,000
-
-
$2,650,000
-
-
-
-
-
$1,900,000
$1,350,000
-
-
-
-
-
The Stafford Mews
$3,950,000
Median Price
Past 12 months
Past 12 months
$3,950,000
$2,725,000
$2,490,000
$3,800,000
-
-
$3,075,000
$1,570,000
-
-
$2,650,000
-
-
-
-
-
$1,900,000
$1,350,000
-
-
-
-
-
The Stafford Mews
$1,975
Avg. Price / ft2
Past 12 months
Past 12 months
-
-
-
-
-
-
-
$1,213
$1,405
-
-
-
-
$1,119
-
-
-
-
-
-
-
-
-
The Stafford Mews
$4,395,000
Avg. Price
Past 12 months
Past 12 months
-
-
-
-
-
-
-
$2,700,000
$2,950,000
-
-
-
-
$2,350,000
$2,900,000
-
-
-
-
-
-
-
-
The Stafford Mews
$4,395,000
Median Price
Past 12 months
Past 12 months
-
-
-
-
-
-
-
$2,700,000
$2,950,000
-
-
-
-
$2,350,000
$2,900,000
-
-
-
-
-
-
-
-
The Stafford Mews
N/A
Avg. Price / ft2
Past 12 months
Past 12 months
-
-
-
-
-
-
-
-
-
-
-
-
-
-
-
-
-
-
-
-
-
-
-
The Stafford Mews
N/A
Avg. Price
Past 12 months
Past 12 months
-
-
-
-
-
-
-
-
-
-
-
-
-
-
-
-
-
-
-
-
-
-
-
The Stafford Mews
N/A
Median Price
Past 12 months
Past 12 months
-
-
-
-
-
-
-
-
-
-
-
-
-
-
-
-
-
-
-
-
-
-
-
The Stafford Mews
N/A
Avg. Price / ft2
Past 12 months
Past 12 months
-
-
-
-
-
-
-
-
-
-
-
-
-
-
-
-
-
-
-
-
-
-
-
The Stafford Mews
N/A
Avg. Price
Past 12 months
Past 12 months
-
-
-
-
-
-
-
-
-
-
-
-
-
-
-
-
-
-
-
-
-
-
-
The Stafford Mews
N/A
Median Price
Past 12 months
Past 12 months
-
-
-
-
-
-
-
-
-
-
-
-
-
-
-
-
-
-
-
-
-
-
-
Abingdon Court
$1,706
Avg. Price / ft2
Past 12 months
Past 12 months
$1,862
-
-
-
$1,002
$1,225
-
$1,146
-
$1,567
-
$1,136
-
-
$1,677
$1,125
-
-
$1,417
$805
-
$538
$698
Abingdon Court
$1,699,500
Avg. Price
Past 12 months
Past 12 months
$1,371,400
$1,047,500
$1,403,750
$720,855
$651,000
$812,500
$1,235,000
$794,396
-
$880,000
-
$806,942
$629,625
$1,176,667
$1,375,000
$763,577
-
$1,310,000
$1,275,000
$438,750
$695,000
$350,000
$411,000
Abingdon Court
$1,425,000
Median Price
Past 12 months
Past 12 months
$1,350,000
$1,047,500
$1,187,500
$720,855
$651,000
$812,500
$1,235,000
$775,000
-
$880,000
-
$745,000
$629,625
$680,000
$1,375,000
$763,577
-
$1,310,000
$1,275,000
$438,750
$695,000
$350,000
$411,000
Abingdon Court
$1,583
Avg. Price / ft2
Past 12 months
Past 12 months
$1,583
-
-
-
$1,002
$1,225
-
$1,146
-
-
-
$1,016
-
-
-
$1,067
-
-
-
$805
-
$538
-
Abingdon Court
$950,000
Avg. Price
Past 12 months
Past 12 months
$1,025,000
$595,000
$742,500
-
$651,000
$812,500
$1,235,000
$608,333
-
$585,000
-
$804,903
$510,000
$677,500
-
$640,000
-
-
-
$442,500
-
$350,000
$250,000
Abingdon Court
$950,000
Median Price
Past 12 months
Past 12 months
$1,025,000
$595,000
$742,500
-
$651,000
$812,500
$1,235,000
$602,500
-
$585,000
-
$745,000
$510,000
$677,500
-
$640,000
-
-
-
$442,500
-
$350,000
$250,000
Abingdon Court
$1,829
Avg. Price / ft2
Past 12 months
Past 12 months
$1,829
-
-
-
-
-
-
-
-
$1,567
-
$1,256
-
-
$1,677
$1,183
-
-
-
-
-
-
$698
Abingdon Court
$1,425,000
Avg. Price
Past 12 months
Past 12 months
$1,425,000
$1,500,000
-
-
-
-
-
$1,001,250
-
$1,175,000
-
$810,000
-
-
$1,375,000
$887,153
-
-
-
$435,000
$695,000
-
$572,000
Abingdon Court
$1,425,000
Median Price
Past 12 months
Past 12 months
$1,425,000
$1,500,000
-
-
-
-
-
$1,001,250
-
$1,175,000
-
$810,000
-
-
$1,375,000
$887,153
-
-
-
$435,000
$695,000
-
$572,000
Abingdon Court
N/A
Avg. Price / ft2
Past 12 months
Past 12 months
$2,174
-
-
-
-
-
-
-
-
-
-
-
-
-
-
-
-
-
$1,417
-
-
-
-
Abingdon Court
N/A
Avg. Price
Past 12 months
Past 12 months
$1,957,000
-
$1,480,000
$720,855
-
-
-
-
-
-
-
-
-
$2,175,000
-
-
-
$1,310,000
$1,275,000
-
-
-
-
Abingdon Court
N/A
Median Price
Past 12 months
Past 12 months
$1,957,000
-
$1,480,000
$720,855
-
-
-
-
-
-
-
-
-
$2,175,000
-
-
-
$1,310,000
$1,275,000
-
-
-
-
Abingdon Court
N/A
Avg. Price / ft2
Past 12 months
Past 12 months
-
-
-
-
-
-
-
-
-
-
-
-
-
-
-
-
-
-
-
-
-
-
-
Abingdon Court
$2,998,000
Avg. Price
Past 12 months
Past 12 months
-
-
-
-
-
-
-
-
-
-
-
-
-
-
-
-
-
-
-
-
-
-
-
Abingdon Court
$2,998,000
Median Price
Past 12 months
Past 12 months
-
-
-
-
-
-
-
-
-
-
-
-
-
-
-
-
-
-
-
-
-
-
-
Abingdon Court
N/A
Avg. Price / ft2
Past 12 months
Past 12 months
-
-
-
-
-
-
-
-
-
-
-
-
-
-
-
-
-
-
-
-
-
-
-
Abingdon Court
N/A
Avg. Price
Past 12 months
Past 12 months
-
-
-
-
-
-
-
-
-
-
-
-
-
-
-
-
-
-
-
-
-
-
-
Abingdon Court
N/A
Median Price
Past 12 months
Past 12 months
-
-
-
-
-
-
-
-
-
-
-
-
-
-
-
-
-
-
-
-
-
-
-
The Rembrandt
$1,604
Avg. Price / ft2
Past 12 months
Past 12 months
$1,604
$2,045
-
$1,728
$1,233
$1,238
-
$1,312
$1,489
$1,445
-
$1,348
$1,359
$1,103
-
$1,051
$874
$1,168
$1,001
$1,021
$841
$698
$816
The Rembrandt
$2,290,000
Avg. Price
Past 12 months
Past 12 months
$1,866,667
$1,615,000
$1,799,478
$856,667
$807,300
$720,000
$700,000
$861,000
$1,086,167
$768,250
$952,167
$727,500
$1,148,167
$1,617,500
$679,000
$462,500
$603,640
$534,167
$713,257
$793,357
$393,333
$350,000
$603,143
The Rembrandt
$1,925,000
Median Price
Past 12 months
Past 12 months
$1,925,000
$1,250,000
$2,038,433
$840,000
$658,000
$705,000
$700,000
$675,000
$776,000
$735,000
$727,500
$642,500
$640,000
$1,617,500
$679,000
$462,500
$460,000
$555,000
$573,901
$525,000
$370,000
$360,000
$460,000
The Rembrandt
N/A
Avg. Price / ft2
Past 12 months
Past 12 months
-
-
-
$1,728
$1,233
$1,238
-
$1,312
$1,489
$1,445
-
$1,142
$1,123
$1,103
-
$1,051
$805
$1,168
$998
$1,021
$841
$698
$600
The Rembrandt
N/A
Avg. Price
Past 12 months
Past 12 months
-
$800,000
-
$856,667
$634,125
$720,000
$700,000
$642,500
$723,000
$691,667
$678,250
$603,333
$613,500
$535,000
$418,000
$462,500
$429,550
$534,167
$519,124
$506,000
$440,000
$350,000
$227,500
The Rembrandt
N/A
Median Price
Past 12 months
Past 12 months
-
$800,000
-
$840,000
$594,000
$705,000
$700,000
$625,000
$723,000
$675,000
$678,250
$630,000
$602,000
$535,000
$418,000
$462,500
$428,000
$555,000
$561,378
$504,500
$440,000
$360,000
$227,500
The Rembrandt
N/A
Avg. Price / ft2
Past 12 months
Past 12 months
-
$1,563
-
-
-
-
-
-
-
-
-
$1,760
-
-
-
-
-
-
-
-
-
-
-
The Rembrandt
$1,695,000
Avg. Price
Past 12 months
Past 12 months
-
$1,405,000
$1,265,000
-
-
-
-
-
-
$998,000
$1,500,000
$1,100,000
-
-
$940,000
-
-
-
-
$720,000
$300,000
-
$474,000
The Rembrandt
$1,695,000
Median Price
Past 12 months
Past 12 months
-
$1,405,000
$1,265,000
-
-
-
-
-
-
$998,000
$1,500,000
$1,100,000
-
-
$940,000
-
-
-
-
$720,000
$300,000
-
$460,000
The Rembrandt
$1,604
Avg. Price / ft2
Past 12 months
Past 12 months
$1,604
$2,528
-
-
-
-
-
-
-
-
-
-
$2,066
-
-
-
$1,083
-
$1,007
-
-
-
$1,031
The Rembrandt
$1,925,000
Avg. Price
Past 12 months
Past 12 months
$1,866,667
$3,665,000
$2,066,717
-
$1,500,000
-
-
$1,735,000
$1,812,500
-
-
-
$2,217,500
-
-
-
$1,300,000
-
$1,101,524
$1,404,750
-
-
$1,172,500
The Rembrandt
$1,925,000
Median Price
Past 12 months
Past 12 months
$1,925,000
$3,665,000
$2,066,717
-
$1,500,000
-
-
$1,735,000
$1,812,500
-
-
-
$2,217,500
-
-
-
$1,300,000
-
$1,101,524
$1,404,750
-
-
$1,172,500
The Rembrandt
N/A
Avg. Price / ft2
Past 12 months
Past 12 months
-
-
-
-
-
-
-
-
-
-
-
-
-
-
-
-
-
-
-
-
-
-
-
The Rembrandt
$3,250,000
Avg. Price
Past 12 months
Past 12 months
-
-
-
-
-
-
-
-
-
-
-
-
-
$2,700,000
-
-
-
-
-
-
-
-
-
The Rembrandt
$3,250,000
Median Price
Past 12 months
Past 12 months
-
-
-
-
-
-
-
-
-
-
-
-
-
$2,700,000
-
-
-
-
-
-
-
-
-
The Rembrandt
N/A
Avg. Price / ft2
Past 12 months
Past 12 months
-
-
-
-
-
-
-
-
-
-
-
-
-
-
-
-
-
-
-
-
-
-
-
The Rembrandt
N/A
Avg. Price
Past 12 months
Past 12 months
-
-
-
-
-
-
-
-
-
-
-
-
-
-
-
-
-
-
-
-
-
-
-
The Rembrandt
N/A
Median Price
Past 12 months
Past 12 months
-
-
-
-
-
-
-
-
-
-
-
-
-
-
-
-
-
-
-
-
-
-
-
The Rembrandt
N/A
Avg. Price / ft2
Past 12 months
Past 12 months
-
-
-
-
-
-
-
-
-
-
-
-
-
-
-
-
-
-
-
-
-
-
-
The Rembrandt
N/A
Avg. Price
Past 12 months
Past 12 months
-
-
-
-
-
-
-
-
-
-
-
-
-
-
-
-
-
-
-
-
-
-
-
The Rembrandt
N/A
Median Price
Past 12 months
Past 12 months
-
-
-
-
-
-
-
-
-
-
-
-
-
-
-
-
-
-
-
-
-
-
-
708 Greenwich Street
$1,250
Avg. Price / ft2
Past 12 months
Past 12 months
$1,250
$1,655
-
$1,570
$1,771
-
$1,682
-
-
$1,304
$2,485
-
$1,147
-
$1,076
$1,000
$895
-
-
-
$1,000
$1,121
-
708 Greenwich Street
$3,750,000
Avg. Price
Past 12 months
Past 12 months
$3,750,000
$1,655,000
-
$1,887,260
$2,537,000
$4,500,000
$1,850,000
-
-
$2,787,500
$3,205,000
-
$1,480,000
-
$1,192,500
$1,200,000
$940,000
-
-
-
$1,200,000
$1,450,000
-
708 Greenwich Street
$3,750,000
Median Price
Past 12 months
Past 12 months
$3,750,000
$1,655,000
-
$1,870,000
$1,940,000
$4,500,000
$1,850,000
-
-
$2,787,500
$3,205,000
-
$1,480,000
-
$1,192,500
$1,200,000
$940,000
-
-
-
$1,200,000
$1,450,000
-
708 Greenwich Street
N/A
Avg. Price / ft2
Past 12 months
Past 12 months
-
-
-
$1,214
-
-
-
-
-
$1,304
-
-
-
-
-
$1,000
-
-
-
-
-
-
-
708 Greenwich Street
N/A
Avg. Price
Past 12 months
Past 12 months
-
-
-
$1,275,000
-
-
-
-
-
$1,825,000
-
-
-
-
-
$1,200,000
-
-
-
-
-
-
-
708 Greenwich Street
N/A
Median Price
Past 12 months
Past 12 months
-
-
-
$1,275,000
-
-
-
-
-
$1,825,000
-
-
-
-
-
$1,200,000
-
-
-
-
-
-
-
708 Greenwich Street
N/A
Avg. Price / ft2
Past 12 months
Past 12 months
-
$1,655
-
$1,558
-
-
$1,682
-
-
-
$1,752
-
$1,147
-
$1,076
-
$895
-
-
-
$1,000
-
-
708 Greenwich Street
N/A
Avg. Price
Past 12 months
Past 12 months
-
$1,655,000
-
$1,870,000
$1,320,000
-
$1,850,000
-
-
-
$2,260,000
-
$1,480,000
-
$1,192,500
-
$940,000
-
-
-
$1,200,000
-
-
708 Greenwich Street
N/A
Median Price
Past 12 months
Past 12 months
-
$1,655,000
-
$1,870,000
$1,320,000
-
$1,850,000
-
-
-
$2,260,000
-
$1,480,000
-
$1,192,500
-
$940,000
-
-
-
$1,200,000
-
-
708 Greenwich Street
N/A
Avg. Price / ft2
Past 12 months
Past 12 months
-
-
-
$1,936
$1,771
-
-
-
-
-
$3,217
-
-
-
-
-
-
-
-
-
-
$1,121
-
708 Greenwich Street
N/A
Avg. Price
Past 12 months
Past 12 months
-
-
-
$2,516,779
$2,841,250
$4,500,000
-
-
-
$3,750,000
$4,150,000
-
-
-
-
-
-
-
-
-
-
$1,450,000
-
708 Greenwich Street
N/A
Median Price
Past 12 months
Past 12 months
-
-
-
$2,516,779
$2,132,500
$4,500,000
-
-
-
$3,750,000
$4,150,000
-
-
-
-
-
-
-
-
-
-
$1,450,000
-
708 Greenwich Street
N/A
Avg. Price / ft2
Past 12 months
Past 12 months
-
-
-
-
-
-
-
-
-
-
-
-
-
-
-
-
-
-
-
-
-
-
-
708 Greenwich Street
N/A
Avg. Price
Past 12 months
Past 12 months
-
-
-
-
-
-
-
-
-
-
-
-
-
-
-
-
-
-
-
-
-
-
-
708 Greenwich Street
N/A
Median Price
Past 12 months
Past 12 months
-
-
-
-
-
-
-
-
-
-
-
-
-
-
-
-
-
-
-
-
-
-
-
708 Greenwich Street
$1,250
Avg. Price / ft2
Past 12 months
Past 12 months
$1,250
-
-
-
-
-
-
-
-
-
-
-
-
-
-
-
-
-
-
-
-
-
-
708 Greenwich Street
$3,750,000
Avg. Price
Past 12 months
Past 12 months
$3,750,000
-
-
-
-
-
-
-
-
-
-
-
-
-
-
-
-
-
-
-
-
-
-
708 Greenwich Street
$3,750,000
Median Price
Past 12 months
Past 12 months
$3,750,000
-
-
-
-
-
-
-
-
-
-
-
-
-
-
-
-
-
-
-
-
-
-
708 Greenwich Street
N/A
Avg. Price / ft2
Past 12 months
Past 12 months
-
-
-
-
-
-
-
-
-
-
-
-
-
-
-
-
-
-
-
-
-
-
-
708 Greenwich Street
N/A
Avg. Price
Past 12 months
Past 12 months
-
-
-
-
-
-
-
-
-
-
-
-
-
-
-
-
-
-
-
-
-
-
-
708 Greenwich Street
N/A
Median Price
Past 12 months
Past 12 months
-
-
-
-
-
-
-
-
-
-
-
-
-
-
-
-
-
-
-
-
-
-
-
Tudor Arms
$995
Avg. Price / ft2
Past 12 months
Past 12 months
$995
-
$1,350
$1,738
$1,417
-
$1,198
$1,083
$1,500
-
-
-
-
$1,046
-
-
-
$1,002
$943
$1,017
-
-
-
Tudor Arms
$876,250
Avg. Price
Past 12 months
Past 12 months
$970,000
$1,099,125
$871,403
$927,667
$850,000
-
$716,800
$650,000
$710,000
-
-
$895,000
$850,000
$627,700
$537,000
-
$550,000
$663,000
$520,767
$501,621
-
-
-
Tudor Arms
$897,500
Median Price
Past 12 months
Past 12 months
$1,062,500
$1,099,125
$810,000
$985,000
$850,000
-
$705,000
$650,000
$710,000
-
-
$895,000
$850,000
$627,700
$537,000
-
$550,000
$663,000
$582,500
$501,621
-
-
-
Tudor Arms
N/A
Avg. Price / ft2
Past 12 months
Past 12 months
-
-
-
-
-
-
-
-
$1,500
-
-
-
-
-
-
-
-
-
$912
-
-
-
-
Tudor Arms
$580,000
Avg. Price
Past 12 months
Past 12 months
$580,000
-
$654,209
$698,000
-
-
$415,800
-
$600,000
-
-
-
-
-
$299,000
-
-
-
$364,800
-
-
-
-
Tudor Arms
$580,000
Median Price
Past 12 months
Past 12 months
$580,000
-
$654,209
$698,000
-
-
$415,800
-
$600,000
-
-
-
-
-
$299,000
-
-
-
$364,800
-
-
-
-
Tudor Arms
N/A
Avg. Price / ft2
Past 12 months
Past 12 months
-
-
$1,350
$1,738
$1,417
-
$1,141
$1,083
-
-
-
-
-
$1,046
-
-
-
$1,002
$958
-
-
-
-
Tudor Arms
$965,000
Avg. Price
Past 12 months
Past 12 months
$1,152,500
$1,099,125
$980,000
$1,042,500
$850,000
-
$708,750
$650,000
$820,000
-
-
$895,000
$850,000
$627,700
$775,000
-
$550,000
$663,000
$598,750
$189,660
-
-
-
Tudor Arms
$965,000
Median Price
Past 12 months
Past 12 months
$1,152,500
$1,099,125
$980,000
$1,042,500
$850,000
-
$705,000
$650,000
$820,000
-
-
$895,000
$850,000
$627,700
$775,000
-
$550,000
$663,000
$598,750
$189,660
-
-
-
Tudor Arms
N/A
Avg. Price / ft2
Past 12 months
Past 12 months
-
-
-
-
-
-
$1,313
-
-
-
-
-
-
-
-
-
-
-
-
$1,017
-
-
-
Tudor Arms
N/A
Avg. Price
Past 12 months
Past 12 months
-
-
-
-
-
-
$1,050,000
-
-
-
-
-
-
-
-
-
-
-
-
$813,581
-
-
-
Tudor Arms
N/A
Median Price
Past 12 months
Past 12 months
-
-
-
-
-
-
$1,050,000
-
-
-
-
-
-
-
-
-
-
-
-
$813,581
-
-
-
Tudor Arms
$995
Avg. Price / ft2
Past 12 months
Past 12 months
$995
-
-
-
-
-
-
-
-
-
-
-
-
-
-
-
-
-
-
-
-
-
-
Tudor Arms
$995,000
Avg. Price
Past 12 months
Past 12 months
$995,000
-
-
-
-
-
-
-
-
-
-
-
-
-
-
-
-
-
-
-
-
-
-
Tudor Arms
$995,000
Median Price
Past 12 months
Past 12 months
$995,000
-
-
-
-
-
-
-
-
-
-
-
-
-
-
-
-
-
-
-
-
-
-
Tudor Arms
N/A
Avg. Price / ft2
Past 12 months
Past 12 months
-
-
-
-
-
-
-
-
-
-
-
-
-
-
-
-
-
-
-
-
-
-
-
Tudor Arms
N/A
Avg. Price
Past 12 months
Past 12 months
-
-
-
-
-
-
-
-
-
-
-
-
-
-
-
-
-
-
-
-
-
-
-
Tudor Arms
N/A
Median Price
Past 12 months
Past 12 months
-
-
-
-
-
-
-
-
-
-
-
-
-
-
-
-
-
-
-
-
-
-
-
Tudor Arms
N/A
Avg. Price / ft2
Past 12 months
Past 12 months
-
-
-
-
-
-
-
-
-
-
-
-
-
-
-
-
-
-
-
-
-
-
-
Tudor Arms
N/A
Avg. Price
Past 12 months
Past 12 months
-
-
-
-
-
-
-
-
-
-
-
-
-
-
-
-
-
-
-
-
-
-
-
Tudor Arms
N/A
Median Price
Past 12 months
Past 12 months
-
-
-
-
-
-
-
-
-
-
-
-
-
-
-
-
-
-
-
-
-
-
-
68 Jane Street
N/A
Avg. Price / ft2
Past 12 months
Past 12 months
-
-
-
-
-
-
-
$1,206
$2,309
-
-
-
-
-
-
-
$1,088
$1,301
$1,191
-
-
-
-
68 Jane Street
N/A
Avg. Price
Past 12 months
Past 12 months
-
-
-
-
-
-
-
$4,100,000
$10,000,000
-
-
$3,872,500
$2,850,000
-
$1,910,000
-
$3,700,000
$4,337,500
$2,887,500
-
-
-
$2,499,000
68 Jane Street
N/A
Median Price
Past 12 months
Past 12 months
-
-
-
-
-
-
-
$4,100,000
$10,000,000
-
-
$3,872,500
$2,850,000
-
$1,910,000
-
$3,700,000
$4,337,500
$2,887,500
-
-
-
$2,499,000
68 Jane Street
N/A
Avg. Price / ft2
Past 12 months
Past 12 months
-
-
-
-
-
-
-
-
-
-
-
-
-
-
-
-
-
-
-
-
-
-
-
68 Jane Street
N/A
Avg. Price
Past 12 months
Past 12 months
-
-
-
-
-
-
-
-
-
-
-
-
-
-
-
-
-
-
-
-
-
-
-
68 Jane Street
N/A
Median Price
Past 12 months
Past 12 months
-
-
-
-
-
-
-
-
-
-
-
-
-
-
-
-
-
-
-
-
-
-
-
68 Jane Street
N/A
Avg. Price / ft2
Past 12 months
Past 12 months
-
-
-
-
-
-
-
-
-
-
-
-
-
-
-
-
-
-
-
-
-
-
-
68 Jane Street
N/A
Avg. Price
Past 12 months
Past 12 months
-
-
-
-
-
-
-
-
-
-
-
$3,872,500
$2,850,000
-
$1,910,000
-
-
-
-
-
-
-
$2,499,000
68 Jane Street
N/A
Median Price
Past 12 months
Past 12 months
-
-
-
-
-
-
-
-
-
-
-
$3,872,500
$2,850,000
-
$1,910,000
-
-
-
-
-
-
-
$2,499,000
68 Jane Street
N/A
Avg. Price / ft2
Past 12 months
Past 12 months
-
-
-
-
-
-
-
$1,206
-
-
-
-
-
-
-
-
$1,088
$1,301
$1,191
-
-
-
-
68 Jane Street
N/A
Avg. Price
Past 12 months
Past 12 months
-
-
-
-
-
-
-
$4,100,000
-
-
-
-
-
-
-
-
$3,700,000
$4,337,500
$2,887,500
-
-
-
-
68 Jane Street
N/A
Median Price
Past 12 months
Past 12 months
-
-
-
-
-
-
-
$4,100,000
-
-
-
-
-
-
-
-
$3,700,000
$4,337,500
$2,887,500
-
-
-
-
68 Jane Street
N/A
Avg. Price / ft2
Past 12 months
Past 12 months
-
-
-
-
-
-
-
-
$2,309
-
-
-
-
-
-
-
-
-
-
-
-
-
-
68 Jane Street
N/A
Avg. Price
Past 12 months
Past 12 months
-
-
-
-
-
-
-
-
$10,000,000
-
-
-
-
-
-
-
-
-
-
-
-
-
-
68 Jane Street
N/A
Median Price
Past 12 months
Past 12 months
-
-
-
-
-
-
-
-
$10,000,000
-
-
-
-
-
-
-
-
-
-
-
-
-
-
68 Jane Street
N/A
Avg. Price / ft2
Past 12 months
Past 12 months
-
-
-
-
-
-
-
-
-
-
-
-
-
-
-
-
-
-
-
-
-
-
-
68 Jane Street
N/A
Avg. Price
Past 12 months
Past 12 months
-
-
-
-
-
-
-
-
-
-
-
-
-
-
-
-
-
-
-
-
-
-
-
68 Jane Street
N/A
Median Price
Past 12 months
Past 12 months
-
-
-
-
-
-
-
-
-
-
-
-
-
-
-
-
-
-
-
-
-
-
-
171 West 12th Street
N/A
Avg. Price / ft2
Past 12 months
Past 12 months
-
-
-
-
$1,767
-
-
-
-
-
-
-
-
$1,333
-
-
-
-
-
-
-
-
-
171 West 12th Street
$1,750,000
Avg. Price
Past 12 months
Past 12 months
$1,750,000
-
-
-
$1,590,000
-
$1,650,000
$1,822,000
-
$3,025,000
-
-
$1,550,000
$1,370,833
-
-
$900,000
-
$1,525,000
-
$1,450,000
-
-
171 West 12th Street
$1,750,000
Median Price
Past 12 months
Past 12 months
$1,750,000
-
-
-
$1,590,000
-
$1,650,000
$1,822,000
-
$3,025,000
-
-
$1,550,000
$1,200,000
-
-
$900,000
-
$1,525,000
-
$1,450,000
-
-
171 West 12th Street
N/A
Avg. Price / ft2
Past 12 months
Past 12 months
-
-
-
-
-
-
-
-
-
-
-
-
-
-
-
-
-
-
-
-
-
-
-
171 West 12th Street
N/A
Avg. Price
Past 12 months
Past 12 months
-
-
-
-
-
-
-
-
-
-
-
-
-
-
-
-
-
-
-
-
-
-
-
171 West 12th Street
N/A
Median Price
Past 12 months
Past 12 months
-
-
-
-
-
-
-
-
-
-
-
-
-
-
-
-
-
-
-
-
-
-
-
171 West 12th Street
N/A
Avg. Price / ft2
Past 12 months
Past 12 months
-
-
-
-
$1,767
-
-
-
-
-
-
-
-
$1,333
-
-
-
-
-
-
-
-
-
171 West 12th Street
$1,750,000
Avg. Price
Past 12 months
Past 12 months
$1,750,000
-
-
-
$1,590,000
-
$1,650,000
$1,822,000
-
$3,025,000
-
-
$1,550,000
$1,370,833
-
-
-
-
$1,525,000
-
$1,450,000
-
-
171 West 12th Street
$1,750,000
Median Price
Past 12 months
Past 12 months
$1,750,000
-
-
-
$1,590,000
-
$1,650,000
$1,822,000
-
$3,025,000
-
-
$1,550,000
$1,200,000
-
-
-
-
$1,525,000
-
$1,450,000
-
-
171 West 12th Street
N/A
Avg. Price / ft2
Past 12 months
Past 12 months
-
-
-
-
-
-
-
-
-
-
-
-
-
-
-
-
-
-
-
-
-
-
-
171 West 12th Street
N/A
Avg. Price
Past 12 months
Past 12 months
-
-
-
-
-
-
-
-
-
-
-
-
-
-
-
-
-
-
-
-
-
-
-
171 West 12th Street
N/A
Median Price
Past 12 months
Past 12 months
-
-
-
-
-
-
-
-
-
-
-
-
-
-
-
-
-
-
-
-
-
-
-
171 West 12th Street
N/A
Avg. Price / ft2
Past 12 months
Past 12 months
-
-
-
-
-
-
-
-
-
-
-
-
-
-
-
-
-
-
-
-
-
-
-
171 West 12th Street
N/A
Avg. Price
Past 12 months
Past 12 months
-
-
-
-
-
-
-
-
-
-
-
-
-
-
-
-
-
-
-
-
-
-
-
171 West 12th Street
N/A
Median Price
Past 12 months
Past 12 months
-
-
-
-
-
-
-
-
-
-
-
-
-
-
-
-
-
-
-
-
-
-
-
571 Hudson Street
N/A
Avg. Price / ft2
Past 12 months
Past 12 months
-
$1,169
$1,335
-
-
-
-
-
-
-
-
$1,533
-
-
-
$1,188
-
-
-
$1,317
$1,062
-
-
571 Hudson Street
$1,570,000
Avg. Price
Past 12 months
Past 12 months
$1,570,000
$1,870,000
$1,735,000
$2,150,000
$1,445,000
$2,200,000
-
-
-
-
-
$2,005,000
-
$1,515,000
-
$1,587,500
-
-
$1,225,000
$1,600,000
$1,699,000
$650,000
-
571 Hudson Street
$1,570,000
Median Price
Past 12 months
Past 12 months
$1,570,000
$1,870,000
$1,735,000
$2,150,000
$1,445,000
$2,200,000
-
-
-
-
-
$1,590,000
-
$1,515,000
-
$1,587,500
-
-
$1,225,000
$1,600,000
$1,699,000
$650,000
-
571 Hudson Street
N/A
Avg. Price / ft2
Past 12 months
Past 12 months
-
-
-
-
-
-
-
-
-
-
-
-
-
-
-
-
-
-
-
-
-
-
-
571 Hudson Street
N/A
Avg. Price
Past 12 months
Past 12 months
-
-
-
-
-
-
-
-
-
-
-
-
-
-
-
-
-
-
-
-
-
-
-
571 Hudson Street
N/A
Median Price
Past 12 months
Past 12 months
-
-
-
-
-
-
-
-
-
-
-
-
-
-
-
-
-
-
-
-
-
-
-
571 Hudson Street
N/A
Avg. Price / ft2
Past 12 months
Past 12 months
-
-
-
-
-
-
-
-
-
-
-
$1,844
-
-
-
$1,188
-
-
-
-
$1,062
-
-
571 Hudson Street
N/A
Avg. Price
Past 12 months
Past 12 months
-
-
-
-
-
$2,200,000
-
-
-
-
-
$2,212,500
-
$1,515,000
-
$1,900,000
-
-
$1,225,000
-
$1,699,000
$650,000
-
571 Hudson Street
N/A
Median Price
Past 12 months
Past 12 months
-
-
-
-
-
$2,200,000
-
-
-
-
-
$2,212,500
-
$1,515,000
-
$1,900,000
-
-
$1,225,000
-
$1,699,000
$650,000
-
571 Hudson Street
N/A
Avg. Price / ft2
Past 12 months
Past 12 months
-
$1,169
$1,335
-
-
-
-
-
-
-
-
$1,223
-
-
-
-
-
-
-
$1,317
-
-
-
571 Hudson Street
$1,570,000
Avg. Price
Past 12 months
Past 12 months
$1,570,000
$1,870,000
$1,735,000
$2,150,000
$1,445,000
-
-
-
-
-
-
$1,590,000
-
-
-
$1,275,000
-
-
-
$1,600,000
-
-
-
571 Hudson Street
$1,570,000
Median Price
Past 12 months
Past 12 months
$1,570,000
$1,870,000
$1,735,000
$2,150,000
$1,445,000
-
-
-
-
-
-
$1,590,000
-
-
-
$1,275,000
-
-
-
$1,600,000
-
-
-
571 Hudson Street
N/A
Avg. Price / ft2
Past 12 months
Past 12 months
-
-
-
-
-
-
-
-
-
-
-
-
-
-
-
-
-
-
-
-
-
-
-
571 Hudson Street
N/A
Avg. Price
Past 12 months
Past 12 months
-
-
-
-
-
-
-
-
-
-
-
-
-
-
-
-
-
-
-
-
-
-
-
571 Hudson Street
N/A
Median Price
Past 12 months
Past 12 months
-
-
-
-
-
-
-
-
-
-
-
-
-
-
-
-
-
-
-
-
-
-
-
571 Hudson Street
N/A
Avg. Price / ft2
Past 12 months
Past 12 months
-
-
-
-
-
-
-
-
-
-
-
-
-
-
-
-
-
-
-
-
-
-
-
571 Hudson Street
N/A
Avg. Price
Past 12 months
Past 12 months
-
-
-
-
-
-
-
-
-
-
-
-
-
-
-
-
-
-
-
-
-
-
-
571 Hudson Street
N/A
Median Price
Past 12 months
Past 12 months
-
-
-
-
-
-
-
-
-
-
-
-
-
-
-
-
-
-
-
-
-
-
-
Harbor House
N/A
Avg. Price / ft2
Past 12 months
Past 12 months
-
-
-
-
$1,400
-
$1,008
$1,056
$1,219
-
-
$1,512
$1,292
$1,025
-
$958
-
$1,163
$824
$879
$1,111
-
$610
Harbor House
$3,350,000
Avg. Price
Past 12 months
Past 12 months
$2,450,000
$1,366,333
$2,425,000
$2,650,000
$840,000
-
$1,352,500
$845,000
$837,500
-
$2,447,667
$1,763,333
$1,833,333
$1,186,667
$1,409,750
$1,016,667
-
$757,500
$736,362
$807,727
$838,533
$839,000
$520,750
Harbor House
$3,350,000
Median Price
Past 12 months
Past 12 months
$2,450,000
$949,000
$2,425,000
$2,650,000
$840,000
-
$1,352,500
$845,000
$837,500
-
$3,045,000
$2,030,000
$1,825,000
$645,000
$1,389,000
$1,130,000
-
$757,500
$735,000
$680,000
$719,500
$839,000
$520,750
Harbor House
N/A
Avg. Price / ft2
Past 12 months
Past 12 months
-
-
-
-
-
-
-
-
-
-
-
-
-
-
-
-
-
-
-
-
-
-
-
Harbor House
N/A
Avg. Price
Past 12 months
Past 12 months
-
-
-
-
-
-
-
-
-
-
-
-
-
-
-
-
-
-
-
-
-
-
-
Harbor House
N/A
Median Price
Past 12 months
Past 12 months
-
-
-
-
-
-
-
-
-
-
-
-
-
-
-
-
-
-
-
-
-
-
-
Harbor House
N/A
Avg. Price / ft2
Past 12 months
Past 12 months
-
-
-
-
$1,400
-
$1,008
$1,056
$1,219
-
-
$1,344
-
$1,025
-
$975
-
$1,163
$843
$879
$1,111
-
-
Harbor House
N/A
Avg. Price
Past 12 months
Past 12 months
-
$899,500
$1,200,000
-
$840,000
-
$605,000
$845,000
$837,500
-
$799,000
$1,075,000
-
$630,000
$729,500
$585,000
-
$757,500
$622,953
$684,659
$609,925
$382,000
$310,000
Harbor House
N/A
Median Price
Past 12 months
Past 12 months
-
$899,500
$1,200,000
-
$840,000
-
$605,000
$845,000
$837,500
-
$799,000
$1,075,000
-
$630,000
$729,500
$585,000
-
$757,500
$720,000
$664,318
$537,850
$382,000
$310,000
Harbor House
N/A
Avg. Price / ft2
Past 12 months
Past 12 months
-
-
-
-
-
-
-
-
-
-
-
$1,681
$1,521
-
-
$942
-
-
-
-
-
-
$610
Harbor House
$3,350,000
Avg. Price
Past 12 months
Past 12 months
$2,450,000
$2,300,000
$3,650,000
$2,475,000
-
-
$2,100,000
-
-
-
-
$2,107,500
$1,900,000
$2,300,000
$2,000,000
$1,232,500
-
-
-
$1,300,000
$1,272,000
-
$731,500
Harbor House
$3,350,000
Median Price
Past 12 months
Past 12 months
$2,450,000
$2,300,000
$3,650,000
$2,475,000
-
-
$2,100,000
-
-
-
-
$2,107,500
$1,900,000
$2,300,000
$2,000,000
$1,232,500
-
-
-
$1,300,000
$1,272,000
-
$731,500
Harbor House
N/A
Avg. Price / ft2
Past 12 months
Past 12 months
-
-
-
-
-
-
-
-
-
-
-
-
$1,063
-
-
-
-
-
$744
-
-
-
-
Harbor House
N/A
Avg. Price
Past 12 months
Past 12 months
-
-
-
$2,825,000
-
-
-
-
-
-
$3,272,000
-
$1,700,000
-
$2,180,000
-
-
-
$1,190,000
-
-
-
-
Harbor House
N/A
Median Price
Past 12 months
Past 12 months
-
-
-
$2,825,000
-
-
-
-
-
-
$3,272,000
-
$1,700,000
-
$2,180,000
-
-
-
$1,190,000
-
-
-
-
Harbor House
N/A
Avg. Price / ft2
Past 12 months
Past 12 months
-
-
-
-
-
-
-
-
-
-
-
-
-
-
-
-
-
-
-
-
-
-
-
Harbor House
N/A
Avg. Price
Past 12 months
Past 12 months
-
-
-
-
-
-
-
-
-
-
-
-
-
-
-
-
-
-
-
-
-
-
-
Harbor House
N/A
Median Price
Past 12 months
Past 12 months
-
-
-
-
-
-
-
-
-
-
-
-
-
-
-
-
-
-
-
-
-
-
-
Harbor House
N/A
Avg. Price / ft2
Past 12 months
Past 12 months
-
-
-
-
-
-
-
-
-
-
-
-
-
-
-
-
-
-
-
-
-
-
-
Harbor House
N/A
Avg. Price
Past 12 months
Past 12 months
-
-
-
-
-
-
-
-
-
-
-
-
-
-
-
-
-
-
-
-
-
-
-
Harbor House
N/A
Median Price
Past 12 months
Past 12 months
-
-
-
-
-
-
-
-
-
-
-
-
-
-
-
-
-
-
-
-
-
-
-


