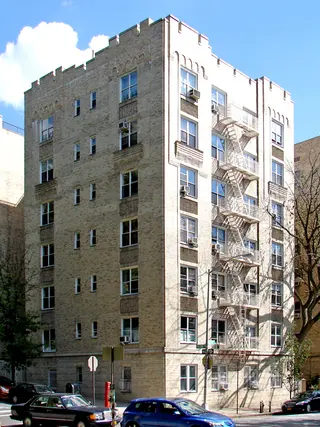
Payson House, 91 Payson Avenue: Price Comparison
between Seaman Avenue & Payson Avenue Building Profile
Payson House
$665,000
Avg. Price
Past 12 months
Past 12 months
2024
$474,500
2023
$1,017,500
2022
$620,000
2021
$625,000
2020
$410,000
2019
$603,500
2018
$533,000
2017
$415,000
2016
$630,000
2015
$474,000
2014
$433,850
2013
$350,000
2012
$475,000
2011
$363,750
2010
-
2009
-
2008
$354,667
2007
$470,000
2006
-
2005
-
2004
$255,000
2003
$285,364
Payson House
$665,000
Median Price
Past 12 months
Past 12 months
2024
$474,500
2023
$1,017,500
2022
$620,000
2021
$625,000
2020
$410,000
2019
$652,500
2018
$533,000
2017
$415,000
2016
$630,000
2015
$474,000
2014
$433,850
2013
$290,000
2012
$475,000
2011
$363,750
2010
-
2009
-
2008
$330,000
2007
$470,000
2006
-
2005
-
2004
$255,000
2003
$285,364
Payson House
N/A
Avg. Price
Past 12 months
Past 12 months
2024
-
2023
-
2022
-
2021
-
2020
-
2019
-
2018
-
2017
-
2016
-
2015
-
2014
-
2013
-
2012
-
2011
-
2010
-
2009
-
2008
-
2007
-
2006
-
2005
-
2004
-
2003
-
Payson House
N/A
Median Price
Past 12 months
Past 12 months
2024
-
2023
-
2022
-
2021
-
2020
-
2019
-
2018
-
2017
-
2016
-
2015
-
2014
-
2013
-
2012
-
2011
-
2010
-
2009
-
2008
-
2007
-
2006
-
2005
-
2004
-
2003
-
Payson House
N/A
Avg. Price
Past 12 months
Past 12 months
2024
$399,000
2023
-
2022
-
2021
-
2020
$410,000
2019
$399,000
2018
$476,000
2017
$415,000
2016
-
2015
$409,000
2014
$355,000
2013
$270,000
2012
-
2011
-
2010
-
2009
-
2008
$290,000
2007
-
2006
-
2005
-
2004
$255,000
2003
-
Payson House
N/A
Median Price
Past 12 months
Past 12 months
2024
$399,000
2023
-
2022
-
2021
-
2020
$410,000
2019
$399,000
2018
$476,000
2017
$415,000
2016
-
2015
$409,000
2014
$355,000
2013
$270,000
2012
-
2011
-
2010
-
2009
-
2008
$290,000
2007
-
2006
-
2005
-
2004
$255,000
2003
-
Payson House
$665,000
Avg. Price
Past 12 months
Past 12 months
2024
$550,000
2023
$535,000
2022
$620,000
2021
$625,000
2020
-
2019
$671,667
2018
$590,000
2017
-
2016
$630,000
2015
$539,000
2014
$512,700
2013
$510,000
2012
$475,000
2011
$363,750
2010
-
2009
-
2008
$484,000
2007
$470,000
2006
-
2005
-
2004
-
2003
$285,364
Payson House
$665,000
Median Price
Past 12 months
Past 12 months
2024
$550,000
2023
$535,000
2022
$620,000
2021
$625,000
2020
-
2019
$670,000
2018
$590,000
2017
-
2016
$630,000
2015
$539,000
2014
$512,700
2013
$510,000
2012
$475,000
2011
$363,750
2010
-
2009
-
2008
$484,000
2007
$470,000
2006
-
2005
-
2004
-
2003
$285,364
Payson House
N/A
Avg. Price
Past 12 months
Past 12 months
2024
-
2023
-
2022
-
2021
-
2020
-
2019
-
2018
-
2017
-
2016
-
2015
-
2014
-
2013
-
2012
-
2011
-
2010
-
2009
-
2008
-
2007
-
2006
-
2005
-
2004
-
2003
-
Payson House
N/A
Median Price
Past 12 months
Past 12 months
2024
-
2023
-
2022
-
2021
-
2020
-
2019
-
2018
-
2017
-
2016
-
2015
-
2014
-
2013
-
2012
-
2011
-
2010
-
2009
-
2008
-
2007
-
2006
-
2005
-
2004
-
2003
-
Payson House
N/A
Avg. Price
Past 12 months
Past 12 months
2024
-
2023
$1,500,000
2022
-
2021
-
2020
-
2019
-
2018
-
2017
-
2016
-
2015
-
2014
-
2013
-
2012
-
2011
-
2010
-
2009
-
2008
-
2007
-
2006
-
2005
-
2004
-
2003
-
Payson House
N/A
Median Price
Past 12 months
Past 12 months
2024
-
2023
$1,500,000
2022
-
2021
-
2020
-
2019
-
2018
-
2017
-
2016
-
2015
-
2014
-
2013
-
2012
-
2011
-
2010
-
2009
-
2008
-
2007
-
2006
-
2005
-
2004
-
2003
-
Payson House
N/A
Avg. Price
Past 12 months
Past 12 months
2024
-
2023
-
2022
-
2021
-
2020
-
2019
-
2018
-
2017
-
2016
-
2015
-
2014
-
2013
-
2012
-
2011
-
2010
-
2009
-
2008
-
2007
-
2006
-
2005
-
2004
-
2003
-
Payson House
N/A
Median Price
Past 12 months
Past 12 months
2024
-
2023
-
2022
-
2021
-
2020
-
2019
-
2018
-
2017
-
2016
-
2015
-
2014
-
2013
-
2012
-
2011
-
2010
-
2009
-
2008
-
2007
-
2006
-
2005
-
2004
-
2003
-

 6sqft delivers the latest on real estate, architecture, and design, straight from New York City.
