 CityRealty's November 2017 market report includes all public records data available through October 31, 2017 for deeds recorded the prior month.
CityRealty's monthly rundown of the Manhattan residential real estate market.
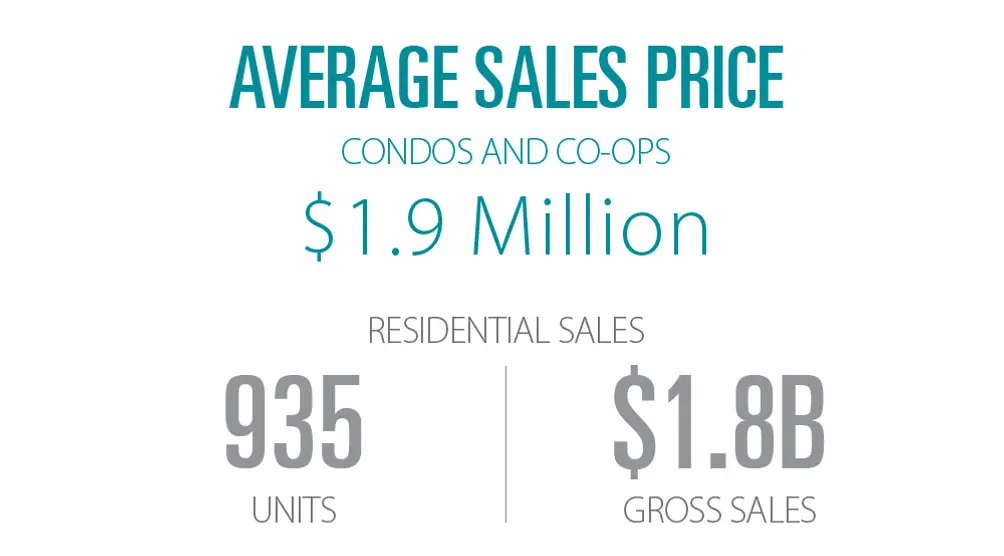
The average sales price of a Manhattan apartment fell in the four weeks leading up to October 1, as did the number of sales. The average price for an apartment-taking into account both condo and co-op sales-was $1.9 million, down from $2.1 million the prior month. The number of recorded sales, 935, represented a sharp drop from the 1,264 recorded in the preceding month.
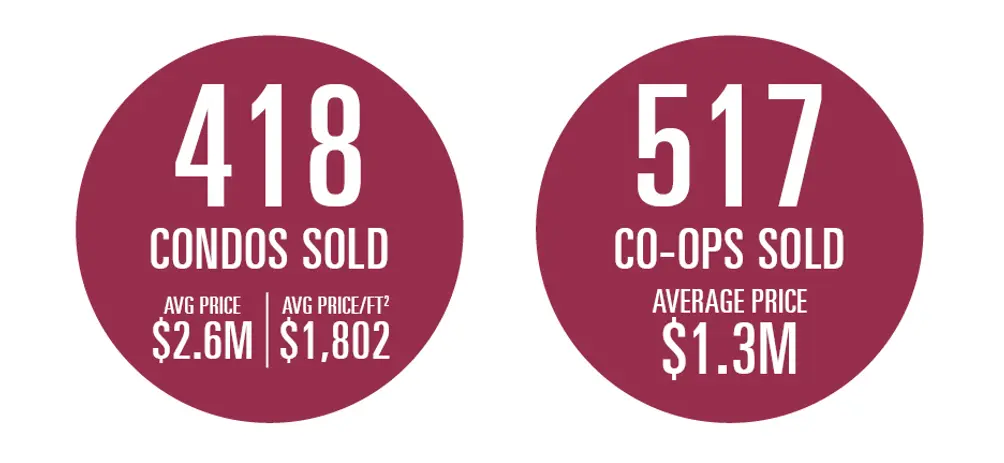
The average price of a condo was $2.6 million and the average price of a co-op was $1.3 million. There were 418 condo sales and 517 co-op sales..
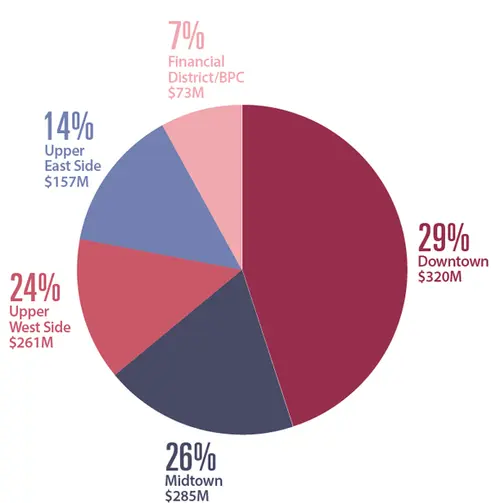
30-Day Total Sales by Region
Downtown was the highest-grossing region in Manhattan, with $320 million in condominium sales. Midtown was the second highest-grossing area, with $285 million in sales. Downtown also had the highest price/ft2, $1,955/ft2, while Midtown had the second-highest, $1,833/ft2.
Downtown was the highest-grossing region in Manhattan, with $320 million in condominium sales. Midtown was the second highest-grossing area, with $285 million in sales. Downtown also had the highest price/ft2, $1,955/ft2, while Midtown had the second-highest, $1,833/ft2.
NEW DEVELOPMENTS VS ALL OTHER CONDOS:
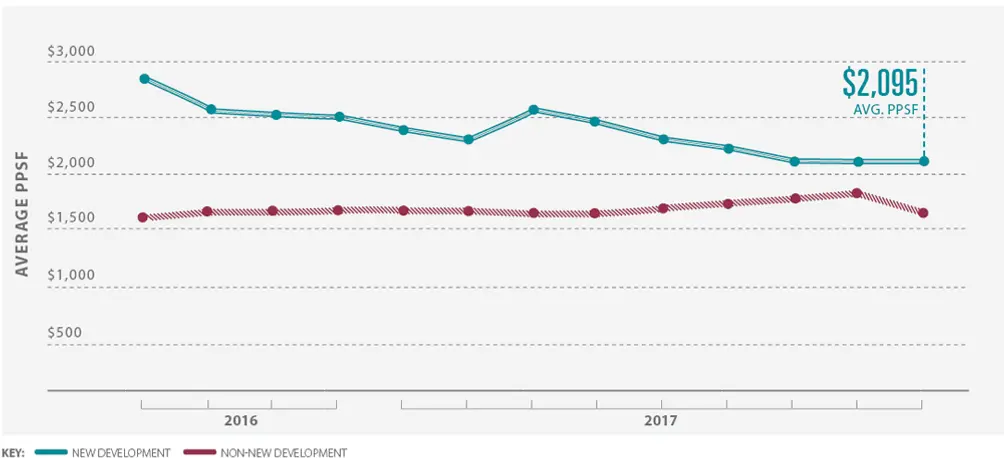
New development condo prices averaged $2,095/ft2 this month, compared to $1,672/ft2 for non-new development condominium sales. The average price, $3.6 million, was down this month from $4.3 million the prior month. There were 127 new development sales this month, virtually the same as the 124 recorded in the prior month. The price/ft2 of new apartments was 27% lower than it was a year ago, when it was $2,877/ft2, and virtually unchanged from last month, when it was $2,084/ft2. The aggregate sales total of new developments was $456 million.