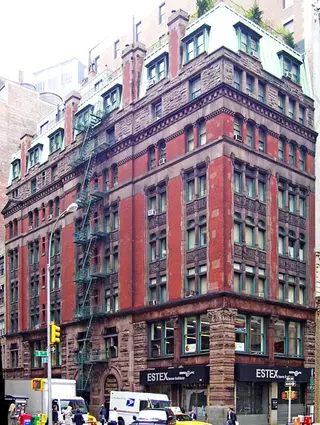
The Wilbraham, 284 Fifth Avenue: Price Comparison
between East 30th Street & East 31st Street Building Profile
The Wilbraham
$580,582
Avg. Price
Past 12 months
Past 12 months
2024
$616,833
2023
-
2022
$543,250
2021
$1,770,000
2020
-
2019
-
2018
$828,750
2017
-
2016
$1,150,000
2015
$806,992
2014
$1,624,500
2013
-
2012
$398,502
2011
$366,667
2010
$364,000
2009
-
2008
-
2007
$480,000
2006
$626,406
2005
$424,019
2004
-
2003
-
The Wilbraham
$496,050
Median Price
Past 12 months
Past 12 months
2024
$510,500
2023
-
2022
$543,250
2021
$1,770,000
2020
-
2019
-
2018
$828,750
2017
-
2016
$1,150,000
2015
$806,992
2014
$1,624,500
2013
-
2012
$398,502
2011
$360,000
2010
$364,000
2009
-
2008
-
2007
$480,000
2006
$626,406
2005
$385,000
2004
-
2003
-
The Wilbraham
$490,776
Avg. Price
Past 12 months
Past 12 months
2024
$500,250
2023
-
2022
$543,250
2021
$490,000
2020
-
2019
-
2018
$607,500
2017
-
2016
-
2015
$499,000
2014
$449,000
2013
-
2012
$398,502
2011
$366,667
2010
$364,000
2009
-
2008
-
2007
$480,000
2006
-
2005
$392,022
2004
-
2003
-
The Wilbraham
$485,000
Median Price
Past 12 months
Past 12 months
2024
$500,250
2023
-
2022
$543,250
2021
$490,000
2020
-
2019
-
2018
$607,500
2017
-
2016
-
2015
$499,000
2014
$449,000
2013
-
2012
$398,502
2011
$360,000
2010
$364,000
2009
-
2008
-
2007
$480,000
2006
-
2005
$383,000
2004
-
2003
-
The Wilbraham
$850,000
Avg. Price
Past 12 months
Past 12 months
2024
$850,000
2023
-
2022
-
2021
-
2020
-
2019
-
2018
$1,050,000
2017
-
2016
$1,150,000
2015
$1,114,984
2014
-
2013
-
2012
-
2011
-
2010
-
2009
-
2008
-
2007
-
2006
-
2005
$616,000
2004
-
2003
-
The Wilbraham
$850,000
Median Price
Past 12 months
Past 12 months
2024
$850,000
2023
-
2022
-
2021
-
2020
-
2019
-
2018
$1,050,000
2017
-
2016
$1,150,000
2015
$1,114,984
2014
-
2013
-
2012
-
2011
-
2010
-
2009
-
2008
-
2007
-
2006
-
2005
$616,000
2004
-
2003
-
The Wilbraham
N/A
Avg. Price
Past 12 months
Past 12 months
2024
-
2023
-
2022
-
2021
-
2020
-
2019
-
2018
-
2017
-
2016
-
2015
-
2014
-
2013
-
2012
-
2011
-
2010
-
2009
-
2008
-
2007
-
2006
-
2005
-
2004
-
2003
-
The Wilbraham
N/A
Median Price
Past 12 months
Past 12 months
2024
-
2023
-
2022
-
2021
-
2020
-
2019
-
2018
-
2017
-
2016
-
2015
-
2014
-
2013
-
2012
-
2011
-
2010
-
2009
-
2008
-
2007
-
2006
-
2005
-
2004
-
2003
-
The Wilbraham
N/A
Avg. Price
Past 12 months
Past 12 months
2024
-
2023
-
2022
-
2021
$3,050,000
2020
-
2019
-
2018
-
2017
-
2016
-
2015
-
2014
$2,800,000
2013
-
2012
-
2011
-
2010
-
2009
-
2008
-
2007
-
2006
$626,406
2005
-
2004
-
2003
-
The Wilbraham
N/A
Median Price
Past 12 months
Past 12 months
2024
-
2023
-
2022
-
2021
$3,050,000
2020
-
2019
-
2018
-
2017
-
2016
-
2015
-
2014
$2,800,000
2013
-
2012
-
2011
-
2010
-
2009
-
2008
-
2007
-
2006
$626,406
2005
-
2004
-
2003
-
The Wilbraham
N/A
Avg. Price
Past 12 months
Past 12 months
2024
-
2023
-
2022
-
2021
-
2020
-
2019
-
2018
-
2017
-
2016
-
2015
-
2014
-
2013
-
2012
-
2011
-
2010
-
2009
-
2008
-
2007
-
2006
-
2005
-
2004
-
2003
-
The Wilbraham
N/A
Median Price
Past 12 months
Past 12 months
2024
-
2023
-
2022
-
2021
-
2020
-
2019
-
2018
-
2017
-
2016
-
2015
-
2014
-
2013
-
2012
-
2011
-
2010
-
2009
-
2008
-
2007
-
2006
-
2005
-
2004
-
2003
-
The Wilbraham
N/A
Avg. Price
Past 12 months
Past 12 months
2024
-
2023
-
2022
-
2021
-
2020
-
2019
-
2018
-
2017
-
2016
-
2015
-
2014
-
2013
-
2012
-
2011
-
2010
-
2009
-
2008
-
2007
-
2006
-
2005
-
2004
-
2003
-
The Wilbraham
N/A
Median Price
Past 12 months
Past 12 months
2024
-
2023
-
2022
-
2021
-
2020
-
2019
-
2018
-
2017
-
2016
-
2015
-
2014
-
2013
-
2012
-
2011
-
2010
-
2009
-
2008
-
2007
-
2006
-
2005
-
2004
-
2003
-
36 West 35th Street
N/A
Avg. Price / ft2
Past 12 months
Past 12 months
$1,013
-
-
$800
-
$1,101
$908
$838
-
-
-
-
$680
-
-
-
-
$974
$645
$775
-
$375
36 West 35th Street
N/A
Avg. Price
Past 12 months
Past 12 months
$537,413
-
$755,000
$390,000
-
$510,000
$779,500
$496,667
-
-
-
-
$307,625
-
-
$337,500
-
$370,000
$710,000
$310,000
-
$238,000
36 West 35th Street
N/A
Median Price
Past 12 months
Past 12 months
$484,064
-
$755,000
$390,000
-
$485,000
$779,500
$345,000
-
-
-
-
$290,000
-
-
$337,500
-
$370,000
$710,000
$310,000
-
$150,000
36 West 35th Street
N/A
Avg. Price / ft2
Past 12 months
Past 12 months
$1,013
-
-
$800
-
$1,101
-
$838
-
-
-
-
$692
-
-
-
-
$974
-
$775
-
$375
36 West 35th Street
N/A
Avg. Price
Past 12 months
Past 12 months
$404,000
-
-
$390,000
-
$465,000
-
$335,000
-
-
-
-
$280,833
-
-
-
-
$370,000
-
$310,000
-
$150,000
36 West 35th Street
N/A
Median Price
Past 12 months
Past 12 months
$404,000
-
-
$390,000
-
$467,500
-
$335,000
-
-
-
-
$265,000
-
-
-
-
$370,000
-
$310,000
-
$150,000
36 West 35th Street
N/A
Avg. Price / ft2
Past 12 months
Past 12 months
-
-
-
-
-
-
-
-
-
-
-
-
$647
-
-
-
-
-
-
-
-
-
36 West 35th Street
N/A
Avg. Price
Past 12 months
Past 12 months
$507,032
-
$755,000
-
-
$690,000
$560,000
$820,000
-
-
-
-
$388,000
-
-
$337,500
-
-
-
-
-
-
36 West 35th Street
N/A
Median Price
Past 12 months
Past 12 months
$507,032
-
$755,000
-
-
$690,000
$560,000
$820,000
-
-
-
-
$388,000
-
-
$337,500
-
-
-
-
-
-
36 West 35th Street
N/A
Avg. Price / ft2
Past 12 months
Past 12 months
-
-
-
-
-
-
$908
-
-
-
-
-
-
-
-
-
-
-
$645
-
-
$376
36 West 35th Street
N/A
Avg. Price
Past 12 months
Past 12 months
$865,000
-
-
-
-
-
$999,000
-
-
-
-
-
-
-
-
-
-
-
$710,000
-
-
$414,000
36 West 35th Street
N/A
Median Price
Past 12 months
Past 12 months
$865,000
-
-
-
-
-
$999,000
-
-
-
-
-
-
-
-
-
-
-
$710,000
-
-
$414,000
36 West 35th Street
N/A
Avg. Price / ft2
Past 12 months
Past 12 months
-
-
-
-
-
-
-
-
-
-
-
-
-
-
-
-
-
-
-
-
-
-
36 West 35th Street
N/A
Avg. Price
Past 12 months
Past 12 months
-
-
-
-
-
-
-
-
-
-
-
-
-
-
-
-
-
-
-
-
-
-
36 West 35th Street
N/A
Median Price
Past 12 months
Past 12 months
-
-
-
-
-
-
-
-
-
-
-
-
-
-
-
-
-
-
-
-
-
-
36 West 35th Street
N/A
Avg. Price / ft2
Past 12 months
Past 12 months
-
-
-
-
-
-
-
-
-
-
-
-
-
-
-
-
-
-
-
-
-
-
36 West 35th Street
N/A
Avg. Price
Past 12 months
Past 12 months
-
-
-
-
-
-
-
-
-
-
-
-
-
-
-
-
-
-
-
-
-
-
36 West 35th Street
N/A
Median Price
Past 12 months
Past 12 months
-
-
-
-
-
-
-
-
-
-
-
-
-
-
-
-
-
-
-
-
-
-
Bryant Park Place
$1,719
Avg. Price / ft2
Past 12 months
Past 12 months
-
$1,121
$987
$1,070
$819
$1,022
$906
$1,094
-
-
-
$823
$836
$834
$771
$773
$1,007
$874
$796
$672
$518
$424
Bryant Park Place
$550,000
Avg. Price
Past 12 months
Past 12 months
$649,000
$669,667
$698,333
$562,000
$727,500
$848,000
$578,750
$753,600
-
$1,054,500
$520,033
$500,357
$657,500
$647,200
$585,500
$356,500
$580,000
$657,554
$593,390
$499,333
$421,571
$373,125
Bryant Park Place
$550,000
Median Price
Past 12 months
Past 12 months
$649,000
$735,000
$755,000
$562,000
$727,500
$848,000
$640,000
$800,000
-
$800,000
$428,000
$510,000
$605,000
$591,000
$576,000
$356,500
$587,500
$620,000
$603,170
$505,000
$376,000
$368,750
Bryant Park Place
$1,719
Avg. Price / ft2
Past 12 months
Past 12 months
-
-
-
$1,070
-
-
-
-
-
-
-
$888
$925
-
$906
$773
$1,138
$901
$700
$729
$531
-
Bryant Park Place
$550,000
Avg. Price
Past 12 months
Past 12 months
$649,000
-
-
$562,000
-
-
-
$518,000
-
$318,000
$422,550
$410,833
$370,000
-
$290,000
$356,500
$477,500
$472,770
$280,000
$510,000
$245,000
-
Bryant Park Place
$550,000
Median Price
Past 12 months
Past 12 months
$649,000
-
-
$562,000
-
-
-
$518,000
-
$318,000
$422,550
$367,500
$370,000
-
$290,000
$356,500
$477,500
$472,770
$280,000
$510,000
$245,000
-
Bryant Park Place
N/A
Avg. Price / ft2
Past 12 months
Past 12 months
-
$1,121
$987
-
$819
-
$906
$1,094
-
-
-
$759
$813
$789
$743
-
$942
$829
$791
$644
$509
$424
Bryant Park Place
N/A
Avg. Price
Past 12 months
Past 12 months
-
$669,667
$820,000
-
$727,500
-
$578,750
$812,500
-
$800,000
$715,000
$567,500
$626,250
$581,500
$576,000
-
$566,667
$617,500
$592,585
$450,250
$378,500
$344,167
Bryant Park Place
N/A
Median Price
Past 12 months
Past 12 months
-
$735,000
$820,000
-
$727,500
-
$640,000
$805,000
-
$800,000
$715,000
$542,500
$605,000
$580,500
$576,000
-
$675,000
$617,500
$603,170
$450,000
$377,000
$332,500
Bryant Park Place
N/A
Avg. Price / ft2
Past 12 months
Past 12 months
-
-
-
-
-
$1,022
-
-
-
-
-
-
-
$1,011
$692
-
-
$907
$910
-
-
-
Bryant Park Place
N/A
Avg. Price
Past 12 months
Past 12 months
-
-
-
-
-
$848,000
-
-
-
-
-
-
$1,070,000
$910,000
$900,000
-
$825,000
$790,000
$910,000
-
$947,000
$460,000
Bryant Park Place
N/A
Median Price
Past 12 months
Past 12 months
-
-
-
-
-
$848,000
-
-
-
-
-
-
$1,070,000
$910,000
$900,000
-
$825,000
$790,000
$910,000
-
$947,000
$460,000
Bryant Park Place
N/A
Avg. Price / ft2
Past 12 months
Past 12 months
-
-
-
-
-
-
-
-
-
-
-
-
-
-
-
-
-
-
-
-
-
-
Bryant Park Place
N/A
Avg. Price
Past 12 months
Past 12 months
-
-
-
-
-
-
-
-
-
$2,300,000
-
-
-
-
-
-
-
-
-
$685,000
-
-
Bryant Park Place
N/A
Median Price
Past 12 months
Past 12 months
-
-
-
-
-
-
-
-
-
$2,300,000
-
-
-
-
-
-
-
-
-
$685,000
-
-
Bryant Park Place
N/A
Avg. Price / ft2
Past 12 months
Past 12 months
-
-
-
-
-
-
-
-
-
-
-
-
-
-
-
-
-
-
-
-
-
-
Bryant Park Place
N/A
Avg. Price
Past 12 months
Past 12 months
-
-
-
-
-
-
-
-
-
-
-
-
-
-
-
-
-
-
-
-
-
-
Bryant Park Place
N/A
Median Price
Past 12 months
Past 12 months
-
-
-
-
-
-
-
-
-
-
-
-
-
-
-
-
-
-
-
-
-
-
Bryant Park Place
N/A
Avg. Price / ft2
Past 12 months
Past 12 months
-
-
-
-
-
-
-
-
-
-
-
-
-
-
-
-
-
-
-
-
-
-
Bryant Park Place
N/A
Avg. Price
Past 12 months
Past 12 months
-
-
-
-
-
-
-
-
-
-
-
-
-
-
-
-
-
-
-
-
-
-
Bryant Park Place
N/A
Median Price
Past 12 months
Past 12 months
-
-
-
-
-
-
-
-
-
-
-
-
-
-
-
-
-
-
-
-
-
-