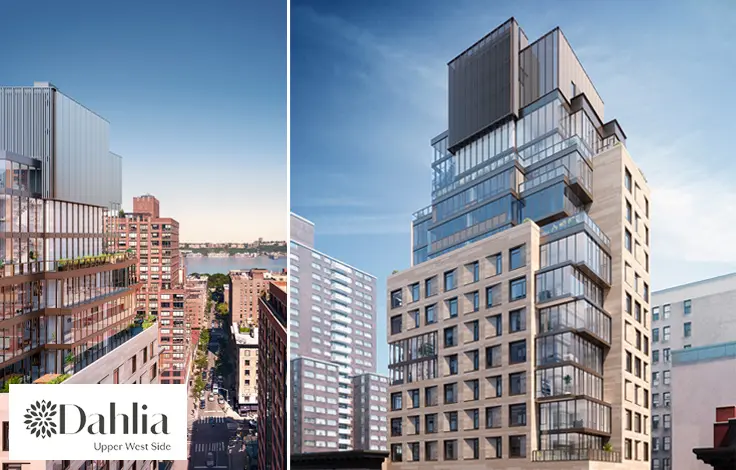
Riverview East, 251 East 32nd Street: Price Comparison
between Third Avenue & Second Avenue Building Profile
Riverview East
$575,000
Avg. Price
Past 12 months
Past 12 months
2023
$458,333
2022
$854,400
2021
$660,000
2020
-
2019
$497,500
2018
$735,000
2017
$547,500
2016
$578,375
2015
$535,875
2014
$753,600
2013
$616,500
2012
$605,794
2011
$528,750
2010
$448,500
2009
$350,028
2008
$547,500
2007
$711,000
2006
$652,750
2005
$599,500
2004
$485,705
2003
$412,500
Riverview East
$550,000
Median Price
Past 12 months
Past 12 months
2023
$415,000
2022
$735,000
2021
$660,000
2020
-
2019
$497,500
2018
$735,000
2017
$547,500
2016
$557,500
2015
$537,500
2014
$760,000
2013
$420,000
2012
$530,000
2011
$536,250
2010
$448,500
2009
$350,028
2008
$547,500
2007
$711,000
2006
$622,500
2005
$622,000
2004
$465,000
2003
$415,000
Riverview East
$482,500
Avg. Price
Past 12 months
Past 12 months
2023
$458,333
2022
-
2021
-
2020
-
2019
-
2018
-
2017
$547,500
2016
$395,000
2015
$269,500
2014
$400,000
2013
-
2012
$400,000
2011
-
2010
$362,000
2009
$350,028
2008
$330,000
2007
$487,000
2006
-
2005
$419,000
2004
$250,000
2003
-
Riverview East
$482,500
Median Price
Past 12 months
Past 12 months
2023
$415,000
2022
-
2021
-
2020
-
2019
-
2018
-
2017
$547,500
2016
$395,000
2015
$269,500
2014
$400,000
2013
-
2012
$400,000
2011
-
2010
$362,000
2009
$350,028
2008
$330,000
2007
$487,000
2006
-
2005
$419,000
2004
$250,000
2003
-
Riverview East
$636,667
Avg. Price
Past 12 months
Past 12 months
2023
-
2022
$610,667
2021
$660,000
2020
-
2019
$497,500
2018
$735,000
2017
-
2016
$484,000
2015
$537,500
2014
$665,250
2013
$360,833
2012
$547,393
2011
$506,250
2010
$535,000
2009
-
2008
-
2007
-
2006
$509,500
2005
$659,667
2004
$431,667
2003
$408,750
Riverview East
$645,000
Median Price
Past 12 months
Past 12 months
2023
-
2022
$580,000
2021
$660,000
2020
-
2019
$497,500
2018
$735,000
2017
-
2016
$484,000
2015
$537,500
2014
$710,000
2013
$375,000
2012
$547,393
2011
$500,000
2010
$535,000
2009
-
2008
-
2007
-
2006
$509,500
2005
$650,000
2004
$490,000
2003
$408,750
Riverview East
N/A
Avg. Price
Past 12 months
Past 12 months
2023
-
2022
$865,000
2021
-
2020
-
2019
-
2018
-
2017
-
2016
$717,250
2015
$799,000
2014
$1,018,750
2013
$1,000,000
2012
$371,185
2011
$573,750
2010
-
2009
-
2008
$765,000
2007
$935,000
2006
$625,000
2005
-
2004
$487,500
2003
$420,000
Riverview East
N/A
Median Price
Past 12 months
Past 12 months
2023
-
2022
$865,000
2021
-
2020
-
2019
-
2018
-
2017
-
2016
$740,000
2015
$799,000
2014
$1,002,500
2013
$1,000,000
2012
$371,185
2011
$573,750
2010
-
2009
-
2008
$765,000
2007
$935,000
2006
$625,000
2005
-
2004
$465,000
2003
$420,000
Riverview East
N/A
Avg. Price
Past 12 months
Past 12 months
2023
-
2022
$1,575,000
2021
-
2020
-
2019
-
2018
-
2017
-
2016
-
2015
-
2014
-
2013
-
2012
-
2011
-
2010
-
2009
-
2008
-
2007
-
2006
$967,000
2005
-
2004
-
2003
-
Riverview East
N/A
Median Price
Past 12 months
Past 12 months
2023
-
2022
$1,575,000
2021
-
2020
-
2019
-
2018
-
2017
-
2016
-
2015
-
2014
-
2013
-
2012
-
2011
-
2010
-
2009
-
2008
-
2007
-
2006
$967,000
2005
-
2004
-
2003
-
Riverview East
N/A
Avg. Price
Past 12 months
Past 12 months
2023
-
2022
-
2021
-
2020
-
2019
-
2018
-
2017
-
2016
-
2015
-
2014
-
2013
-
2012
-
2011
-
2010
-
2009
-
2008
-
2007
-
2006
-
2005
-
2004
-
2003
-
Riverview East
N/A
Median Price
Past 12 months
Past 12 months
2023
-
2022
-
2021
-
2020
-
2019
-
2018
-
2017
-
2016
-
2015
-
2014
-
2013
-
2012
-
2011
-
2010
-
2009
-
2008
-
2007
-
2006
-
2005
-
2004
-
2003
-
Riverview East
N/A
Avg. Price
Past 12 months
Past 12 months
2023
-
2022
-
2021
-
2020
-
2019
-
2018
-
2017
-
2016
-
2015
-
2014
-
2013
-
2012
-
2011
-
2010
-
2009
-
2008
-
2007
-
2006
-
2005
-
2004
-
2003
-
Riverview East
N/A
Median Price
Past 12 months
Past 12 months
2023
-
2022
-
2021
-
2020
-
2019
-
2018
-
2017
-
2016
-
2015
-
2014
-
2013
-
2012
-
2011
-
2010
-
2009
-
2008
-
2007
-
2006
-
2005
-
2004
-
2003
-
166 East 35th Street
N/A
Avg. Price / ft2
Past 12 months
Past 12 months
-
$984
$911
$832
$891
$1,054
$933
$855
$885
$778
$732
$614
$716
$674
$667
$760
$721
$636
$674
$546
$452
166 East 35th Street
$434,888
Avg. Price
Past 12 months
Past 12 months
$516,944
$446,611
$387,000
$547,500
$528,750
$500,250
$522,167
$533,500
$485,286
$485,833
$401,000
$443,583
$361,214
$330,200
$420,417
$472,900
$402,475
$371,643
$390,545
$302,880
$291,742
166 East 35th Street
$434,888
Median Price
Past 12 months
Past 12 months
$516,944
$437,000
$387,000
$547,500
$502,500
$471,000
$457,000
$533,000
$465,000
$435,000
$399,000
$383,250
$345,000
$337,000
$427,500
$431,500
$389,000
$380,000
$391,500
$295,000
$288,725
166 East 35th Street
N/A
Avg. Price / ft2
Past 12 months
Past 12 months
-
$1,055
$911
$764
$891
$1,054
$962
$825
$822
$773
$737
$614
$707
$674
-
-
$744
$654
$704
$545
$457
166 East 35th Street
N/A
Avg. Price
Past 12 months
Past 12 months
-
$426,286
$387,000
$420,000
$490,000
$453,667
$437,250
$403,400
$444,000
$425,000
$347,500
$327,833
$323,125
$330,200
$356,250
$431,500
$380,700
$359,750
$342,083
$253,457
$251,500
166 East 35th Street
N/A
Median Price
Past 12 months
Past 12 months
-
$425,000
$387,000
$420,000
$490,000
$457,000
$432,000
$429,000
$439,000
$425,000
$325,000
$307,000
$323,750
$337,000
$356,250
$431,500
$378,900
$372,500
$335,000
$241,000
$251,500
166 East 35th Street
N/A
Avg. Price / ft2
Past 12 months
Past 12 months
-
$841
-
$900
-
-
$847
$885
$949
$783
$726
-
$730
-
$667
$760
$687
$601
$629
$546
$447
166 East 35th Street
$434,888
Avg. Price
Past 12 months
Past 12 months
$516,944
$588,888
-
$675,000
$541,667
$640,000
$692,000
$663,600
$516,250
$498,000
$441,125
$384,000
$412,000
-
$452,500
$483,250
$424,250
$387,500
$448,700
$346,125
$311,863
166 East 35th Street
$434,888
Median Price
Past 12 months
Past 12 months
$516,944
$588,888
-
$675,000
$515,000
$640,000
$692,000
$649,000
$602,500
$445,000
$426,000
$384,000
$436,000
-
$442,500
$481,500
$389,000
$400,000
$430,000
$339,500
$311,863
166 East 35th Street
N/A
Avg. Price / ft2
Past 12 months
Past 12 months
-
-
-
-
-
-
-
-
-
-
-
-
-
-
-
-
-
-
-
-
-
166 East 35th Street
N/A
Avg. Price
Past 12 months
Past 12 months
-
-
-
-
-
-
-
-
-
-
-
$910,000
-
-
-
-
-
-
-
-
-
166 East 35th Street
N/A
Median Price
Past 12 months
Past 12 months
-
-
-
-
-
-
-
-
-
-
-
$910,000
-
-
-
-
-
-
-
-
-
166 East 35th Street
N/A
Avg. Price / ft2
Past 12 months
Past 12 months
-
-
-
-
-
-
-
-
-
-
-
-
-
-
-
-
-
-
-
-
-
166 East 35th Street
N/A
Avg. Price
Past 12 months
Past 12 months
-
-
-
-
-
-
-
-
-
-
-
-
-
-
-
-
-
-
-
-
-
166 East 35th Street
N/A
Median Price
Past 12 months
Past 12 months
-
-
-
-
-
-
-
-
-
-
-
-
-
-
-
-
-
-
-
-
-
166 East 35th Street
N/A
Avg. Price / ft2
Past 12 months
Past 12 months
-
-
-
-
-
-
-
-
-
-
-
-
-
-
-
-
-
-
-
-
-
166 East 35th Street
N/A
Avg. Price
Past 12 months
Past 12 months
-
-
-
-
-
-
-
-
-
-
-
-
-
-
-
-
-
-
-
-
-
166 East 35th Street
N/A
Median Price
Past 12 months
Past 12 months
-
-
-
-
-
-
-
-
-
-
-
-
-
-
-
-
-
-
-
-
-
649 Second Avenue
N/A
Avg. Price / ft2
Past 12 months
Past 12 months
-
-
$726
-
$709
-
$885
$775
-
$674
-
$564
-
-
-
-
-
-
-
-
-
649 Second Avenue
N/A
Avg. Price
Past 12 months
Past 12 months
-
-
$363,000
-
$287,500
-
$447,500
$364,909
$287,500
$280,112
$322,500
$282,000
$306,000
-
-
$462,500
$282,500
-
-
-
-
649 Second Avenue
N/A
Median Price
Past 12 months
Past 12 months
-
-
$363,000
-
$287,500
-
$417,500
$362,318
$287,500
$297,250
$322,500
$282,000
$306,000
-
-
$462,500
$282,500
-
-
-
-
649 Second Avenue
N/A
Avg. Price / ft2
Past 12 months
Past 12 months
-
-
$726
-
$709
-
$950
$775
-
$667
-
$564
-
-
-
-
-
-
-
-
-
649 Second Avenue
N/A
Avg. Price
Past 12 months
Past 12 months
-
-
$363,000
-
$287,500
-
$380,000
$310,000
$287,500
$297,250
-
$282,000
$250,000
-
-
-
-
-
-
-
-
649 Second Avenue
N/A
Median Price
Past 12 months
Past 12 months
-
-
$363,000
-
$287,500
-
$380,000
$310,000
$287,500
$297,250
-
$282,000
$250,000
-
-
-
-
-
-
-
-
649 Second Avenue
N/A
Avg. Price / ft2
Past 12 months
Past 12 months
-
-
-
-
-
-
$820
-
-
$682
-
-
-
-
-
-
-
-
-
-
-
649 Second Avenue
N/A
Avg. Price
Past 12 months
Past 12 months
-
-
-
-
-
-
$470,000
$419,818
-
$262,974
$322,500
-
$362,000
-
-
$462,500
-
-
-
-
-
649 Second Avenue
N/A
Median Price
Past 12 months
Past 12 months
-
-
-
-
-
-
$425,000
$419,818
-
$262,974
$322,500
-
$362,000
-
-
$462,500
-
-
-
-
-
649 Second Avenue
N/A
Avg. Price / ft2
Past 12 months
Past 12 months
-
-
-
-
-
-
-
-
-
-
-
-
-
-
-
-
-
-
-
-
-
649 Second Avenue
N/A
Avg. Price
Past 12 months
Past 12 months
-
-
-
-
-
-
-
-
-
-
-
-
-
-
-
-
-
-
-
-
-
649 Second Avenue
N/A
Median Price
Past 12 months
Past 12 months
-
-
-
-
-
-
-
-
-
-
-
-
-
-
-
-
-
-
-
-
-
649 Second Avenue
N/A
Avg. Price / ft2
Past 12 months
Past 12 months
-
-
-
-
-
-
-
-
-
-
-
-
-
-
-
-
-
-
-
-
-
649 Second Avenue
N/A
Avg. Price
Past 12 months
Past 12 months
-
-
-
-
-
-
-
-
-
-
-
-
-
-
-
-
-
-
-
-
-
649 Second Avenue
N/A
Median Price
Past 12 months
Past 12 months
-
-
-
-
-
-
-
-
-
-
-
-
-
-
-
-
-
-
-
-
-
The Ascot
$1,223
Avg. Price / ft2
Past 12 months
Past 12 months
-
$1,216
$1,117
-
$996
$1,087
$1,162
$1,080
$1,222
$878
$831
$868
$743
-
$584
$717
$683
$643
$623
$496
$384
The Ascot
$814,643
Avg. Price
Past 12 months
Past 12 months
$810,000
$1,008,750
$810,000
$815,000
$717,000
$632,500
$944,333
$732,286
$790,102
$645,571
$580,500
$573,712
$529,800
-
$402,625
$494,500
$445,929
$493,900
$363,851
$410,333
$230,625
The Ascot
$850,000
Median Price
Past 12 months
Past 12 months
$810,000
$850,000
$810,000
$815,000
$717,000
$632,500
$750,000
$705,500
$620,000
$615,000
$538,000
$522,000
$429,000
-
$396,250
$500,000
$450,000
$472,000
$406,750
$300,000
$230,000
The Ascot
$1,141
Avg. Price / ft2
Past 12 months
Past 12 months
-
-
-
-
-
-
-
$1,174
-
$969
-
-
-
-
-
$731
-
-
$729
-
$459
The Ascot
$490,000
Avg. Price
Past 12 months
Past 12 months
-
-
-
-
-
$450,000
-
$472,000
$411,667
$409,500
$362,000
-
$385,000
-
$328,000
$349,000
$335,000
-
$265,000
-
$195,000
The Ascot
$490,000
Median Price
Past 12 months
Past 12 months
-
-
-
-
-
$450,000
-
$472,000
$400,000
$409,500
$362,000
-
$385,000
-
$328,000
$349,000
$335,000
-
$270,000
-
$195,000
The Ascot
$1,153
Avg. Price / ft2
Past 12 months
Past 12 months
-
$1,129
$1,117
-
$996
$1,087
-
$965
$933
$787
$789
$868
$689
-
$584
$718
$683
$637
$601
$444
$346
The Ascot
$836,875
Avg. Price
Past 12 months
Past 12 months
$810,000
$828,333
$810,000
$815,000
$717,000
$815,000
$738,200
$697,455
$660,000
$618,333
$540,250
$573,712
$456,333
-
$427,500
$516,333
$464,417
$451,750
$423,161
$300,000
$235,714
The Ascot
$856,250
Median Price
Past 12 months
Past 12 months
$810,000
$845,000
$810,000
$815,000
$717,000
$815,000
$740,000
$711,000
$660,000
$615,000
$538,000
$522,000
$429,000
-
$422,500
$525,000
$468,750
$454,750
$429,000
$300,000
$230,000
The Ascot
$1,375
Avg. Price / ft2
Past 12 months
Past 12 months
-
$1,476
-
-
-
-
-
$1,558
$1,318
-
$914
-
$852
-
-
$686
-
$663
-
$601
-
The Ascot
$1,375,000
Avg. Price
Past 12 months
Past 12 months
-
$1,550,000
-
-
-
-
-
$1,636,000
$1,383,439
$1,200,000
$960,000
-
$895,000
-
-
$720,000
-
$662,500
-
$631,000
-
The Ascot
$1,375,000
Median Price
Past 12 months
Past 12 months
-
$1,550,000
-
-
-
-
-
$1,636,000
$1,400,000
$1,200,000
$960,000
-
$895,000
-
-
$720,000
-
$662,500
-
$631,000
-
The Ascot
N/A
Avg. Price / ft2
Past 12 months
Past 12 months
-
-
-
-
-
-
$1,162
-
-
-
-
-
-
-
-
-
-
-
-
-
-
The Ascot
N/A
Avg. Price
Past 12 months
Past 12 months
-
-
-
-
-
-
$1,975,000
-
-
-
-
-
-
-
-
-
-
-
-
-
-
The Ascot
N/A
Median Price
Past 12 months
Past 12 months
-
-
-
-
-
-
$1,975,000
-
-
-
-
-
-
-
-
-
-
-
-
-
-
The Ascot
N/A
Avg. Price / ft2
Past 12 months
Past 12 months
-
-
-
-
-
-
-
-
-
-
-
-
-
-
-
-
-
-
-
-
-
The Ascot
N/A
Avg. Price
Past 12 months
Past 12 months
-
-
-
-
-
-
-
-
-
-
-
-
-
-
-
-
-
-
-
-
-
The Ascot
N/A
Median Price
Past 12 months
Past 12 months
-
-
-
-
-
-
-
-
-
-
-
-
-
-
-
-
-
-
-
-
-
The Ascot
N/A
Avg. Price / ft2
Past 12 months
Past 12 months
-
-
-
-
-
-
-
-
-
-
-
-
-
-
-
-
-
-
-
-
-
The Ascot
N/A
Avg. Price
Past 12 months
Past 12 months
-
-
-
-
-
-
-
-
-
-
-
-
-
-
-
-
-
-
-
-
-
The Ascot
N/A
Median Price
Past 12 months
Past 12 months
-
-
-
-
-
-
-
-
-
-
-
-
-
-
-
-
-
-
-
-
-
Victoria House
$1,141
Avg. Price / ft2
Past 12 months
Past 12 months
$1,136
$936
$890
$1,022
$987
$1,134
$1,006
$1,029
$893
$868
$816
$783
$672
$740
$745
$860
$851
$791
$766
$618
$459
Victoria House
$759,643
Avg. Price
Past 12 months
Past 12 months
$1,250,000
$802,000
$593,056
$865,000
$662,500
$731,518
$760,955
$865,503
$628,660
$645,671
$605,265
$545,366
$438,950
$615,125
$490,914
$633,487
$609,230
$540,662
$497,185
$421,636
$327,935
Victoria House
$725,000
Median Price
Past 12 months
Past 12 months
$1,250,000
$710,000
$642,500
$727,500
$515,000
$650,000
$655,000
$690,000
$575,000
$545,000
$525,000
$534,000
$422,500
$517,250
$425,880
$560,000
$547,500
$517,500
$405,000
$398,349
$330,000
Victoria House
N/A
Avg. Price / ft2
Past 12 months
Past 12 months
-
-
$880
$900
$941
$1,171
$921
$978
$844
$819
$784
$682
$703
$750
$699
$855
$843
$747
$729
$610
$450
Victoria House
$506,250
Avg. Price
Past 12 months
Past 12 months
-
-
$475,000
$502,500
$504,375
$559,397
$481,833
$518,000
$484,887
$430,500
$424,600
$384,309
$385,900
$393,000
$375,313
$470,000
$435,622
$399,667
$380,250
$320,099
$256,059
Victoria House
$506,250
Median Price
Past 12 months
Past 12 months
-
-
$480,000
$502,500
$510,000
$539,837
$465,000
$524,000
$469,500
$440,000
$425,000
$392,678
$384,500
$390,000
$367,000
$470,000
$430,000
$401,000
$398,000
$324,480
$253,500
Victoria House
$1,145
Avg. Price / ft2
Past 12 months
Past 12 months
-
$966
$896
-
$1,056
$1,023
$975
$1,001
$839
$796
$780
$745
$642
$709
$750
$876
$805
$810
$773
$621
$483
Victoria House
$763,750
Avg. Price
Past 12 months
Past 12 months
-
$655,000
$652,083
$727,500
$873,333
$769,980
$691,667
$709,894
$669,381
$587,238
$612,167
$550,625
$492,000
$519,833
$511,000
$588,881
$590,750
$583,694
$564,005
$449,601
$372,710
Victoria House
$777,500
Median Price
Past 12 months
Past 12 months
-
$640,000
$650,000
$727,500
$865,000
$711,500
$700,500
$690,000
$675,000
$572,000
$569,500
$578,500
$475,000
$524,500
$525,000
$560,000
$618,000
$587,500
$560,037
$453,765
$388,871
Victoria House
$1,136
Avg. Price / ft2
Past 12 months
Past 12 months
$1,136
-
-
$1,143
-
-
$1,179
$1,167
$1,100
$1,061
$937
$891
-
$761
$879
$816
$983
$852
-
$648
$328
Victoria House
$1,250,000
Avg. Price
Past 12 months
Past 12 months
$1,250,000
$952,000
-
$1,365,000
-
$1,228,333
$1,387,500
$1,398,750
$1,205,000
$1,031,500
$1,128,500
$1,007,500
-
$875,000
$1,055,000
$1,020,000
$1,203,975
$1,065,000
-
$721,251
$410,417
Victoria House
$1,250,000
Median Price
Past 12 months
Past 12 months
$1,250,000
$952,000
-
$1,365,000
-
$1,135,000
$1,387,500
$1,398,750
$1,205,000
$998,000
$1,128,500
$1,007,500
-
$875,000
$1,055,000
$1,020,000
$1,203,975
$1,065,000
-
$721,251
$410,417
Victoria House
N/A
Avg. Price / ft2
Past 12 months
Past 12 months
-
$819
-
-
-
-
-
$1,094
-
-
-
-
-
$784
-
-
-
-
-
-
-
Victoria House
N/A
Avg. Price
Past 12 months
Past 12 months
-
$1,387,000
-
-
-
-
-
$1,727,500
-
-
-
-
-
$1,307,500
-
-
-
-
-
-
-
Victoria House
N/A
Median Price
Past 12 months
Past 12 months
-
$1,387,000
-
-
-
-
-
$1,727,500
-
-
-
-
-
$1,307,500
-
-
-
-
-
-
-
Victoria House
N/A
Avg. Price / ft2
Past 12 months
Past 12 months
-
-
-
-
-
-
-
-
-
-
-
-
-
-
-
-
-
-
-
-
-
Victoria House
N/A
Avg. Price
Past 12 months
Past 12 months
-
-
-
-
-
-
-
-
-
-
-
-
-
-
-
-
-
-
-
-
-
Victoria House
N/A
Median Price
Past 12 months
Past 12 months
-
-
-
-
-
-
-
-
-
-
-
-
-
-
-
-
-
-
-
-
-
Victoria House
N/A
Avg. Price / ft2
Past 12 months
Past 12 months
-
-
-
-
-
-
-
-
-
-
-
-
-
-
-
-
-
-
-
-
-
Victoria House
N/A
Avg. Price
Past 12 months
Past 12 months
-
-
-
-
-
-
-
-
-
-
-
-
-
-
-
-
-
$475,000
-
$299,130
-
Victoria House
N/A
Median Price
Past 12 months
Past 12 months
-
-
-
-
-
-
-
-
-
-
-
-
-
-
-
-
-
$475,000
-
$299,130
-
The Townsley
$667
Avg. Price / ft2
Past 12 months
Past 12 months
$667
-
$719
$727
$829
-
-
-
$667
$668
$922
$608
$596
$672
$727
$773
$694
$734
$611
$618
$477
The Townsley
$451,427
Avg. Price
Past 12 months
Past 12 months
$462,500
$500,000
$450,000
$466,937
$677,500
$460,806
$501,795
-
$413,571
$401,137
$388,307
$370,000
$384,763
$319,000
$386,667
$413,675
$460,132
$433,513
$350,214
$367,667
$243,750
The Townsley
$430,000
Median Price
Past 12 months
Past 12 months
$462,500
$500,000
$450,000
$490,000
$677,500
$426,000
$545,000
-
$405,000
$410,500
$309,000
$350,000
$382,788
$319,000
$380,000
$357,500
$442,000
$405,000
$360,000
$399,000
$227,500
The Townsley
N/A
Avg. Price / ft2
Past 12 months
Past 12 months
-
-
-
-
-
-
-
-
-
$653
$863
-
-
$672
-
-
-
$891
$590
-
$433
The Townsley
$371,278
Avg. Price
Past 12 months
Past 12 months
$375,000
-
-
$420,810
-
$405,667
$365,000
-
$269,000
$331,306
$301,633
-
-
$319,000
-
$350,000
-
$326,067
$343,711
-
$162,500
The Townsley
$371,278
Median Price
Past 12 months
Past 12 months
$375,000
-
-
$420,810
-
$392,000
$365,000
-
$269,000
$328,919
$304,500
-
-
$319,000
-
$350,000
-
$326,067
$334,954
-
$162,500
The Townsley
$667
Avg. Price / ft2
Past 12 months
Past 12 months
$667
-
$719
$727
$731
-
-
-
$667
$671
-
$608
$596
-
$727
$773
$694
$655
$621
$618
-
The Townsley
$504,860
Avg. Price
Past 12 months
Past 12 months
$550,000
$500,000
$450,000
$490,000
$475,000
$626,224
$570,192
-
$437,667
$431,064
-
$370,000
$385,750
-
$386,667
$541,026
$520,155
$449,000
$409,408
$402,000
$260,000
The Townsley
$534,581
Median Price
Past 12 months
Past 12 months
$550,000
$500,000
$450,000
$490,000
$475,000
$626,224
$570,192
-
$427,500
$426,000
-
$350,000
$385,750
-
$380,000
$541,026
$478,500
$405,000
$411,712
$402,000
$260,000
The Townsley
N/A
Avg. Price / ft2
Past 12 months
Past 12 months
-
-
-
-
$926
-
-
-
-
-
$980
-
-
-
-
-
-
$813
-
-
$520
The Townsley
N/A
Avg. Price
Past 12 months
Past 12 months
-
-
-
-
$880,000
-
-
-
-
-
$735,000
-
-
-
-
-
-
$610,000
-
-
$390,000
The Townsley
N/A
Median Price
Past 12 months
Past 12 months
-
-
-
-
$880,000
-
-
-
-
-
$735,000
-
-
-
-
-
-
$610,000
-
-
$390,000
The Townsley
N/A
Avg. Price / ft2
Past 12 months
Past 12 months
-
-
-
-
-
-
-
-
-
-
-
-
-
-
-
-
-
-
-
-
-
The Townsley
N/A
Avg. Price
Past 12 months
Past 12 months
-
-
-
-
-
-
-
-
-
-
-
-
-
-
-
-
-
-
-
-
-
The Townsley
N/A
Median Price
Past 12 months
Past 12 months
-
-
-
-
-
-
-
-
-
-
-
-
-
-
-
-
-
-
-
-
-
The Townsley
N/A
Avg. Price / ft2
Past 12 months
Past 12 months
-
-
-
-
-
-
-
-
-
-
-
-
-
-
-
-
-
-
-
-
-
The Townsley
N/A
Avg. Price
Past 12 months
Past 12 months
-
-
-
-
-
-
-
-
-
-
-
-
-
-
-
-
-
-
-
-
-
The Townsley
N/A
Median Price
Past 12 months
Past 12 months
-
-
-
-
-
-
-
-
-
-
-
-
-
-
-
-
-
-
-
-
-
The Wendhorn
$750
Avg. Price / ft2
Past 12 months
Past 12 months
$927
$899
$796
$1,033
$897
$889
$840
$763
$789
$852
$674
$656
$635
$612
$643
$672
$694
$678
$616
$520
$389
The Wendhorn
$637,625
Avg. Price
Past 12 months
Past 12 months
$645,600
$699,375
$417,167
$1,395,000
$578,714
$467,063
$442,818
$662,500
$572,462
$501,923
$420,857
$379,375
$387,000
$520,200
$417,500
$438,929
$445,556
$398,643
$424,200
$326,100
$274,000
The Wendhorn
$681,250
Median Price
Past 12 months
Past 12 months
$498,000
$756,250
$416,500
$1,395,000
$445,000
$452,500
$440,000
$469,500
$430,000
$375,000
$365,000
$336,250
$349,000
$520,200
$364,750
$375,000
$410,000
$359,500
$341,000
$265,000
$263,500
The Wendhorn
N/A
Avg. Price / ft2
Past 12 months
Past 12 months
$1,007
-
$796
-
$831
$842
$840
$767
$777
$899
$700
$663
$635
-
$658
$657
$712
$645
$607
$529
$407
The Wendhorn
N/A
Avg. Price
Past 12 months
Past 12 months
$452,500
$445,000
$417,167
-
$442,000
$447,750
$442,818
$435,000
$405,250
$447,071
$354,200
$334,167
$340,500
-
$353,400
$410,417
$365,000
$356,889
$337,500
$254,350
$222,688
The Wendhorn
N/A
Median Price
Past 12 months
Past 12 months
$452,500
$445,000
$416,500
-
$437,500
$446,500
$440,000
$451,000
$405,000
$371,000
$339,000
$332,500
$340,500
-
$360,000
$367,500
$360,000
$358,000
$337,500
$260,000
$215,500
The Wendhorn
$750
Avg. Price / ft2
Past 12 months
Past 12 months
$690
$899
-
-
$739
$982
-
$753
$715
$735
-
$644
-
$612
$617
$718
$682
$711
$620
$482
$366
The Wendhorn
$637,625
Avg. Price
Past 12 months
Past 12 months
$586,500
$784,167
-
-
$628,000
$525,000
-
$637,500
$725,000
$540,500
-
$515,000
$480,000
$520,200
$524,333
$610,000
$546,250
$473,800
$482,000
$402,500
$318,938
The Wendhorn
$681,250
Median Price
Past 12 months
Past 12 months
$586,500
$825,000
-
-
$628,000
$525,000
-
$647,500
$612,500
$597,500
-
$515,000
$480,000
$520,200
$523,000
$610,000
$547,000
$542,500
$545,000
$387,500
$330,000
The Wendhorn
N/A
Avg. Price / ft2
Past 12 months
Past 12 months
$1,241
-
-
$1,033
$1,321
-
-
-
$963
-
$595
-
-
-
-
-
-
-
-
-
-
The Wendhorn
N/A
Avg. Price
Past 12 months
Past 12 months
$1,150,000
-
-
$1,395,000
$1,225,000
-
-
-
$1,300,000
$1,024,000
$587,500
-
-
-
-
-
-
-
-
$738,000
$325,000
The Wendhorn
N/A
Median Price
Past 12 months
Past 12 months
$1,150,000
-
-
$1,395,000
$1,225,000
-
-
-
$1,300,000
$1,024,000
$587,500
-
-
-
-
-
-
-
-
$738,000
$325,000
The Wendhorn
N/A
Avg. Price / ft2
Past 12 months
Past 12 months
-
-
-
-
-
-
-
-
-
-
-
-
-
-
-
-
-
-
-
-
-
The Wendhorn
N/A
Avg. Price
Past 12 months
Past 12 months
-
-
-
-
-
-
-
$1,900,000
-
-
-
-
-
-
-
-
-
-
-
-
-
The Wendhorn
N/A
Median Price
Past 12 months
Past 12 months
-
-
-
-
-
-
-
$1,900,000
-
-
-
-
-
-
-
-
-
-
-
-
-
The Wendhorn
N/A
Avg. Price / ft2
Past 12 months
Past 12 months
-
-
-
-
-
-
-
-
-
-
-
-
-
-
-
-
-
-
-
-
-
The Wendhorn
N/A
Avg. Price
Past 12 months
Past 12 months
-
-
-
-
-
-
-
-
-
-
-
-
-
-
-
-
-
-
-
-
-
The Wendhorn
N/A
Median Price
Past 12 months
Past 12 months
-
-
-
-
-
-
-
-
-
-
-
-
-
-
-
-
-
-
-
-
-
The Wendhorn
N/A
Avg. Price / ft2
Past 12 months
Past 12 months
-
-
-
-
-
-
-
-
-
-
-
-
-
-
-
-
-
-
-
-
-
The Wendhorn
N/A
Avg. Price
Past 12 months
Past 12 months
-
-
-
-
-
-
-
-
-
-
-
-
-
-
-
-
-
-
-
-
-
The Wendhorn
N/A
Median Price
Past 12 months
Past 12 months
-
-
-
-
-
-
-
-
-
-
-
-
-
-
-
-
-
-
-
-
-
The Wingate
$755
Avg. Price / ft2
Past 12 months
Past 12 months
$720
$846
$852
$873
$773
$976
$853
$843
$774
$697
$650
$646
$589
$549
$641
$849
$679
$707
$677
$452
$447
The Wingate
$478,333
Avg. Price
Past 12 months
Past 12 months
$500,000
$601,750
$633,000
$556,000
$618,000
$639,250
$519,500
$461,250
$473,911
$658,200
$448,750
$463,389
$474,333
$440,000
$430,000
$921,000
$400,714
$516,500
$457,000
$242,500
$425,833
The Wingate
$460,000
Median Price
Past 12 months
Past 12 months
$500,000
$568,500
$437,000
$556,000
$615,000
$617,500
$452,500
$450,000
$465,000
$550,000
$446,250
$336,000
$340,000
$440,000
$360,000
$1,158,000
$375,000
$580,000
$370,000
$232,500
$397,500
The Wingate
$791
Avg. Price / ft2
Past 12 months
Past 12 months
-
$857
$756
$876
-
$1,017
$853
$843
$790
-
$647
$587
$589
-
$560
-
$750
$719
$673
$452
$409
The Wingate
$435,000
Avg. Price
Past 12 months
Past 12 months
-
$447,500
$386,333
$482,000
-
$601,000
$439,750
$440,000
$428,040
-
$355,833
$303,667
$324,000
-
$280,000
-
$354,667
$395,500
$347,500
$242,500
$225,000
The Wingate
$435,000
Median Price
Past 12 months
Past 12 months
-
$447,500
$410,000
$482,000
-
$601,000
$444,500
$435,000
$425,000
-
$350,000
$300,000
$324,000
-
$280,000
-
$375,000
$395,500
$347,500
$232,500
$225,000
The Wingate
$720
Avg. Price / ft2
Past 12 months
Past 12 months
$720
$825
$907
$869
$773
$935
-
-
$753
$697
$654
$664
-
$549
-
-
$607
-
$679
-
-
The Wingate
$500,000
Avg. Price
Past 12 months
Past 12 months
$500,000
$756,000
$642,000
$630,000
$618,000
$677,500
$679,000
$525,000
$600,000
$551,000
$541,667
$452,000
-
$440,000
$360,000
$390,000
$435,250
$597,000
$530,000
-
$397,500
The Wingate
$500,000
Median Price
Past 12 months
Past 12 months
$500,000
$756,000
$642,000
$630,000
$615,000
$677,500
$679,000
$525,000
$610,000
$550,000
$510,000
$430,000
-
$440,000
$360,000
$390,000
$450,500
$597,000
$585,000
-
$397,500
The Wingate
N/A
Avg. Price / ft2
Past 12 months
Past 12 months
-
-
$934
-
-
-
-
-
-
-
-
$769
-
-
$722
$849
-
$694
-
-
$485
The Wingate
N/A
Avg. Price
Past 12 months
Past 12 months
-
-
$1,355,000
-
-
-
-
-
-
$1,150,000
-
$1,115,000
$775,000
-
$650,000
$1,186,500
-
$625,000
-
-
$655,000
The Wingate
N/A
Median Price
Past 12 months
Past 12 months
-
-
$1,355,000
-
-
-
-
-
-
$1,150,000
-
$1,115,000
$775,000
-
$650,000
$1,186,500
-
$625,000
-
-
$655,000
The Wingate
N/A
Avg. Price / ft2
Past 12 months
Past 12 months
-
-
-
-
-
-
-
-
-
-
-
-
-
-
-
-
-
-
-
-
-
The Wingate
N/A
Avg. Price
Past 12 months
Past 12 months
-
-
-
-
-
-
-
-
-
-
-
-
-
-
-
-
-
-
-
-
-
The Wingate
N/A
Median Price
Past 12 months
Past 12 months
-
-
-
-
-
-
-
-
-
-
-
-
-
-
-
-
-
-
-
-
-
The Wingate
N/A
Avg. Price / ft2
Past 12 months
Past 12 months
-
-
-
-
-
-
-
-
-
-
-
-
-
-
-
-
-
-
-
-
-
The Wingate
N/A
Avg. Price
Past 12 months
Past 12 months
-
-
-
-
-
-
-
-
-
-
-
-
-
-
-
-
-
-
-
-
-
The Wingate
N/A
Median Price
Past 12 months
Past 12 months
-
-
-
-
-
-
-
-
-
-
-
-
-
-
-
-
-
-
-
-
-
140 East 28th Street
$758
Avg. Price / ft2
Past 12 months
Past 12 months
$894
$1,130
$978
-
$738
$882
-
$805
$907
$887
$818
$827
$602
$815
$685
$754
$810
$763
$731
$531
$396
140 East 28th Street
$831,000
Avg. Price
Past 12 months
Past 12 months
$920,000
$1,152,500
$885,000
-
$855,000
$703,167
$843,000
$850,000
$765,571
$1,066,600
$777,857
$633,000
$424,167
$977,500
$853,000
$529,300
$524,643
$623,750
$619,750
$472,625
$521,667
140 East 28th Street
$680,000
Median Price
Past 12 months
Past 12 months
$720,000
$885,000
$810,000
-
$855,000
$760,000
$700,000
$475,000
$780,000
$831,000
$689,000
$399,000
$305,000
$977,500
$566,000
$460,000
$676,500
$662,500
$607,250
$477,500
$250,000
140 East 28th Street
N/A
Avg. Price / ft2
Past 12 months
Past 12 months
-
-
-
-
$800
-
-
$805
$802
-
-
$758
$487
-
$673
$759
$740
$650
$545
$588
$396
140 East 28th Street
$405,000
Avg. Price
Past 12 months
Past 12 months
$405,000
$530,000
-
-
$460,000
$460,000
$459,000
$457,500
$465,000
-
-
$369,500
$296,250
-
$370,000
$445,750
$275,333
$370,000
$329,500
$270,000
$236,250
140 East 28th Street
$405,000
Median Price
Past 12 months
Past 12 months
$405,000
$530,000
-
-
$460,000
$460,000
$459,000
$457,500
$465,000
-
-
$369,500
$296,250
-
$370,000
$445,750
$307,000
$370,000
$329,500
$250,000
$237,500
140 East 28th Street
$758
Avg. Price / ft2
Past 12 months
Past 12 months
$894
$1,281
$978
-
$676
$882
-
-
$933
$866
$795
-
$716
-
$692
$750
$881
$791
-
$474
-
140 East 28th Street
$937,500
Avg. Price
Past 12 months
Past 12 months
$773,333
$828,333
$885,000
-
$1,250,000
$751,800
$700,000
-
$815,667
$750,500
$695,000
-
$680,000
-
$697,800
$585,000
$711,625
$708,333
$653,167
$552,750
-
140 East 28th Street
$700,000
Median Price
Past 12 months
Past 12 months
$720,000
$745,000
$810,000
-
$1,250,000
$780,000
$700,000
-
$804,500
$750,500
$674,500
-
$680,000
-
$567,000
$570,000
$716,250
$687,500
$629,500
$527,500
-
140 East 28th Street
N/A
Avg. Price / ft2
Past 12 months
Past 12 months
-
$979
-
-
-
-
-
-
-
$898
$911
$967
-
$815
-
-
-
-
$917
-
-
140 East 28th Street
N/A
Avg. Price
Past 12 months
Past 12 months
-
$1,950,000
-
-
-
-
$1,370,000
$1,635,000
-
$1,277,333
$1,275,000
$1,160,000
-
$977,500
$2,595,000
-
-
-
$1,100,000
-
$1,520,000
140 East 28th Street
N/A
Median Price
Past 12 months
Past 12 months
-
$1,950,000
-
-
-
-
$1,370,000
$1,635,000
-
$1,495,000
$1,275,000
$1,160,000
-
$977,500
$2,595,000
-
-
-
$1,100,000
-
$1,520,000
140 East 28th Street
N/A
Avg. Price / ft2
Past 12 months
Past 12 months
-
-
-
-
-
-
-
-
-
-
-
-
-
-
-
-
-
-
-
-
-
140 East 28th Street
N/A
Avg. Price
Past 12 months
Past 12 months
-
-
-
-
-
-
-
-
-
-
-
-
-
-
-
-
-
-
-
-
-
140 East 28th Street
N/A
Median Price
Past 12 months
Past 12 months
-
-
-
-
-
-
-
-
-
-
-
-
-
-
-
-
-
-
-
-
-
140 East 28th Street
N/A
Avg. Price / ft2
Past 12 months
Past 12 months
-
-
-
-
-
-
-
-
-
-
-
-
-
-
-
-
-
-
-
-
-
140 East 28th Street
N/A
Avg. Price
Past 12 months
Past 12 months
$1,875,000
-
-
-
-
-
-
-
-
-
-
-
-
-
-
-
-
-
-
-
-
140 East 28th Street
N/A
Median Price
Past 12 months
Past 12 months
$1,875,000
-
-
-
-
-
-
-
-
-
-
-
-
-
-
-
-
-
-
-
-
140 East 28th Street
N/A
Avg. Price / ft2
Past 12 months
Past 12 months
-
-
-
-
-
-
-
-
-
-
-
-
-
-
-
-
-
-
-
-
-
140 East 28th Street
N/A
Avg. Price
Past 12 months
Past 12 months
-
-
-
-
-
-
-
-
-
-
-
-
-
-
-
-
-
-
-
-
-
140 East 28th Street
N/A
Median Price
Past 12 months
Past 12 months
-
-
-
-
-
-
-
-
-
-
-
-
-
-
-
-
-
-
-
-
-
The Penny Lane
$762
Avg. Price / ft2
Past 12 months
Past 12 months
$763
$1,283
$899
$821
$842
$878
$982
$951
$1,074
$875
$711
$903
$715
$713
$784
$951
$827
$665
$776
$519
$496
The Penny Lane
$588,625
Avg. Price
Past 12 months
Past 12 months
$625,000
$1,059,921
$561,794
$630,254
$600,085
$509,113
$797,302
$548,500
$562,082
$585,798
$556,376
$580,674
$426,361
$453,347
$361,250
$649,143
$526,475
$454,917
$403,419
$316,700
$319,417
The Penny Lane
$524,500
Median Price
Past 12 months
Past 12 months
$615,000
$610,000
$500,000
$680,000
$605,000
$475,566
$624,500
$487,000
$497,908
$589,000
$437,000
$524,500
$423,599
$437,500
$357,500
$560,000
$537,350
$436,250
$381,500
$296,000
$281,500
The Penny Lane
$815
Avg. Price / ft2
Past 12 months
Past 12 months
$707
$835
$818
$632
-
$878
$1,043
$843
$1,067
$797
$631
-
$670
$675
$784
$963
$697
$661
$799
$616
$432
The Penny Lane
$490,000
Avg. Price
Past 12 months
Past 12 months
$377,500
$447,500
$398,587
$410,762
$400,338
$433,522
$509,670
$464,667
$521,250
$390,833
$381,125
$385,000
$337,167
$337,500
$361,250
$437,667
$419,233
$359,167
$339,578
$277,000
$220,167
The Penny Lane
$490,000
Median Price
Past 12 months
Past 12 months
$377,500
$447,500
$410,762
$410,762
$400,338
$430,000
$437,511
$485,000
$521,250
$379,000
$376,250
$385,000
$334,000
$337,500
$357,500
$378,000
$410,000
$365,000
$340,000
$277,000
$224,000
The Penny Lane
$714
Avg. Price / ft2
Past 12 months
Past 12 months
$783
-
$1,086
$1,067
$800
-
$861
$1,058
$1,087
$940
$790
$752
$797
$770
-
$936
$879
$669
$720
$507
$539
The Penny Lane
$558,800
Avg. Price
Past 12 months
Past 12 months
$686,667
$645,000
$672,500
$800,000
$735,000
$622,500
$691,000
$800,000
$589,303
$649,867
$565,667
$529,345
$441,979
$540,000
-
$693,667
$625,000
$550,667
$538,833
$405,667
$418,667
The Penny Lane
$499,000
Median Price
Past 12 months
Past 12 months
$780,000
$645,000
$672,500
$800,000
$735,000
$622,500
$691,000
$800,000
$497,908
$640,000
$582,000
$525,375
$427,401
$525,000
-
$706,000
$590,000
$562,000
$585,000
$460,000
$442,000
The Penny Lane
N/A
Avg. Price / ft2
Past 12 months
Past 12 months
-
-
$874
$764
-
-
-
-
-
$624
-
-
$639
$691
-
-
-
-
-
$441
-
The Penny Lane
N/A
Avg. Price
Past 12 months
Past 12 months
-
-
$830,000
$680,000
-
-
-
-
-
$530,000
-
-
$569,000
$656,772
-
-
-
-
-
$375,000
-
The Penny Lane
N/A
Median Price
Past 12 months
Past 12 months
-
-
$830,000
$680,000
-
-
-
-
-
$530,000
-
-
$569,000
$656,772
-
-
-
-
-
$375,000
-
The Penny Lane
N/A
Avg. Price / ft2
Past 12 months
Past 12 months
-
$1,730
-
-
-
-
-
-
-
-
-
$1,053
-
-
-
$947
-
-
-
-
-
The Penny Lane
N/A
Avg. Price
Past 12 months
Past 12 months
-
$3,114,604
-
-
-
-
$1,766,500
-
-
-
$1,360,000
$1,280,000
-
-
-
$1,150,000
-
-
-
-
-
The Penny Lane
N/A
Median Price
Past 12 months
Past 12 months
-
$3,114,604
-
-
-
-
$1,766,500
-
-
-
$1,360,000
$1,280,000
-
-
-
$1,150,000
-
-
-
-
-
The Penny Lane
$779
Avg. Price / ft2
Past 12 months
Past 12 months
$779
-
-
-
-
-
-
-
-
-
-
-
-
-
-
-
-
-
-
-
-
The Penny Lane
$935,000
Avg. Price
Past 12 months
Past 12 months
$935,000
-
-
-
-
-
-
-
-
-
-
-
-
-
-
-
-
-
-
-
-
The Penny Lane
$935,000
Median Price
Past 12 months
Past 12 months
$935,000
-
-
-
-
-
-
-
-
-
-
-
-
-
-
-
-
-
-
-
-
The Penny Lane
N/A
Avg. Price / ft2
Past 12 months
Past 12 months
-
-
-
-
-
-
-
-
-
-
-
-
-
-
-
-
-
-
-
-
-
The Penny Lane
N/A
Avg. Price
Past 12 months
Past 12 months
-
-
-
-
-
-
-
-
-
-
-
-
-
-
-
-
-
-
-
-
-
The Penny Lane
N/A
Median Price
Past 12 months
Past 12 months
-
-
-
-
-
-
-
-
-
-
-
-
-
-
-
-
-
-
-
-
-
200 East 36th Street
$763
Avg. Price / ft2
Past 12 months
Past 12 months
$745
$687
$650
$834
$785
$880
$928
$992
$812
$760
$632
$620
$588
$588
$641
$760
$686
$678
$646
$511
$408
200 East 36th Street
$492,125
Avg. Price
Past 12 months
Past 12 months
$556,500
$388,300
$325,000
$477,667
$621,150
$761,500
$549,929
$699,378
$698,167
$585,214
$431,444
$482,563
$389,682
$387,500
$505,700
$558,750
$480,833
$509,091
$500,938
$711,473
$351,204
200 East 36th Street
$487,500
Median Price
Past 12 months
Past 12 months
$484,500
$395,000
$325,000
$470,000
$617,500
$673,500
$430,000
$556,500
$542,000
$576,000
$475,000
$331,750
$300,000
$387,500
$485,000
$600,000
$500,000
$445,000
$552,500
$290,000
$361,542
200 East 36th Street
$732
Avg. Price / ft2
Past 12 months
Past 12 months
$737
$687
$650
$696
$795
$760
$901
-
$772
$700
$601
$580
$574
$636
$609
$753
$574
$635
$626
$580
$391
200 East 36th Street
$396,000
Avg. Price
Past 12 months
Past 12 months
$418,000
$405,000
$325,000
$400,000
$389,500
$380,000
$414,394
$385,000
$367,500
$315,000
$300,500
$325,100
$270,929
$350,000
$335,000
$338,750
$330,000
$335,000
$308,333
$256,667
$215,000
200 East 36th Street
$417,000
Median Price
Past 12 months
Past 12 months
$420,000
$405,000
$325,000
$400,000
$389,500
$380,000
$406,000
$385,000
$367,500
$315,000
$303,500
$322,000
$262,500
$350,000
$335,000
$338,750
$330,000
$333,500
$315,000
$290,000
$215,000
200 East 36th Street
$799
Avg. Price / ft2
Past 12 months
Past 12 months
$752
-
-
$903
$768
$920
$961
$992
$618
$773
$663
$679
$630
$539
$640
$763
$714
$708
$666
$476
$406
200 East 36th Street
$588,250
Avg. Price
Past 12 months
Past 12 months
$555,000
$354,900
-
$516,500
$604,643
$692,500
$821,000
$628,250
$589,667
$630,250
$536,200
$492,500
$491,667
$425,000
$517,500
$668,750
$499,688
$492,500
$616,500
$345,000
$328,927
200 East 36th Street
$559,500
Median Price
Past 12 months
Past 12 months
$555,000
$354,900
-
$516,500
$625,000
$673,500
$817,500
$556,500
$684,000
$595,500
$481,000
$492,500
$520,000
$425,000
$485,000
$680,000
$532,500
$502,500
$649,000
$330,000
$337,000
200 East 36th Street
N/A
Avg. Price / ft2
Past 12 months
Past 12 months
-
-
-
-
$889
-
-
-
-
-
-
-
-
-
$675
-
-
$689
-
-
$432
200 East 36th Street
N/A
Avg. Price
Past 12 months
Past 12 months
$975,000
-
-
-
$1,200,000
$1,350,000
-
$1,298,269
-
-
-
-
$915,000
-
$641,000
-
-
$763,333
-
-
$475,000
200 East 36th Street
N/A
Median Price
Past 12 months
Past 12 months
$975,000
-
-
-
$1,200,000
$1,350,000
-
$1,298,269
-
-
-
-
$915,000
-
$641,000
-
-
$735,000
-
-
$475,000
200 East 36th Street
N/A
Avg. Price / ft2
Past 12 months
Past 12 months
-
-
-
-
-
-
-
-
$1,087
-
-
-
-
-
-
-
-
-
-
-
-
200 East 36th Street
N/A
Avg. Price
Past 12 months
Past 12 months
-
-
-
-
-
-
-
-
$1,685,000
-
-
$1,250,000
-
-
-
-
-
-
-
-
-
200 East 36th Street
N/A
Median Price
Past 12 months
Past 12 months
-
-
-
-
-
-
-
-
$1,685,000
-
-
$1,250,000
-
-
-
-
-
-
-
-
-
200 East 36th Street
N/A
Avg. Price / ft2
Past 12 months
Past 12 months
-
-
-
-
-
-
-
-
-
-
-
-
-
-
-
-
-
-
-
-
-
200 East 36th Street
N/A
Avg. Price
Past 12 months
Past 12 months
-
-
-
-
-
-
-
-
-
-
-
-
-
-
-
-
-
-
-
-
-
200 East 36th Street
N/A
Median Price
Past 12 months
Past 12 months
-
-
-
-
-
-
-
-
-
-
-
-
-
-
-
-
-
-
-
-
-
200 East 36th Street
N/A
Avg. Price / ft2
Past 12 months
Past 12 months
-
-
-
-
-
-
-
-
-
-
-
-
-
-
-
-
-
-
-
-
-
200 East 36th Street
N/A
Avg. Price
Past 12 months
Past 12 months
-
-
-
-
-
-
-
-
-
-
-
-
-
-
-
-
-
-
-
-
-
200 East 36th Street
N/A
Median Price
Past 12 months
Past 12 months
-
-
-
-
-
-
-
-
-
-
-
-
-
-
-
-
-
-
-
-
-