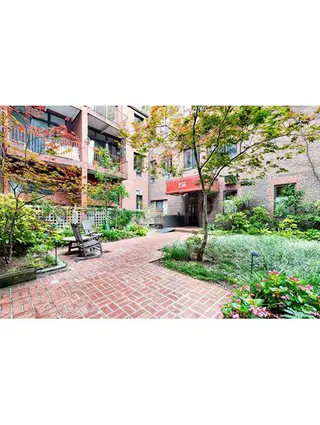
Hudson Mews, 256 West 10th Street: Price Comparison
between Bleecker Street & Hudson Street Building Profile
Hudson Mews
$3,856,667
Avg. Price
Past 12 months
Past 12 months
2025
$4,097,500
2024
-
2023
$3,258,333
2022
$2,560,000
2021
-
2020
-
2019
$1,585,000
2018
$3,300,000
2017
$2,140,000
2016
-
2015
-
2014
$3,510,000
2013
$1,705,000
2012
$2,557,000
2011
-
2010
$925,000
2009
-
2008
-
2007
$2,154,000
2006
$1,685,000
2005
-
2004
$500,254
2003
-
Hudson Mews
$4,295,000
Median Price
Past 12 months
Past 12 months
2025
$4,097,500
2024
-
2023
$3,400,000
2022
$2,560,000
2021
-
2020
-
2019
$1,585,000
2018
$3,300,000
2017
$2,140,000
2016
-
2015
-
2014
$3,510,000
2013
$1,705,000
2012
$2,600,000
2011
-
2010
$925,000
2009
-
2008
-
2007
$2,050,000
2006
$1,685,000
2005
-
2004
$500,254
2003
-
Hudson Mews
N/A
Avg. Price
Past 12 months
Past 12 months
2025
-
2024
-
2023
-
2022
-
2021
-
2020
-
2019
-
2018
-
2017
-
2016
-
2015
-
2014
-
2013
-
2012
-
2011
-
2010
-
2009
-
2008
-
2007
-
2006
-
2005
-
2004
-
2003
-
Hudson Mews
N/A
Median Price
Past 12 months
Past 12 months
2025
-
2024
-
2023
-
2022
-
2021
-
2020
-
2019
-
2018
-
2017
-
2016
-
2015
-
2014
-
2013
-
2012
-
2011
-
2010
-
2009
-
2008
-
2007
-
2006
-
2005
-
2004
-
2003
-
Hudson Mews
$4,600,000
Avg. Price
Past 12 months
Past 12 months
2025
-
2024
-
2023
-
2022
-
2021
-
2020
-
2019
$1,585,000
2018
-
2017
-
2016
-
2015
-
2014
$3,510,000
2013
-
2012
$2,600,000
2011
-
2010
$925,000
2009
-
2008
-
2007
-
2006
$1,685,000
2005
-
2004
-
2003
-
Hudson Mews
$4,600,000
Median Price
Past 12 months
Past 12 months
2025
-
2024
-
2023
-
2022
-
2021
-
2020
-
2019
$1,585,000
2018
-
2017
-
2016
-
2015
-
2014
$3,510,000
2013
-
2012
$2,600,000
2011
-
2010
$925,000
2009
-
2008
-
2007
-
2006
$1,685,000
2005
-
2004
-
2003
-
Hudson Mews
$3,485,000
Avg. Price
Past 12 months
Past 12 months
2025
$4,295,000
2024
-
2023
$3,258,333
2022
$2,560,000
2021
-
2020
-
2019
-
2018
-
2017
$2,140,000
2016
-
2015
-
2014
-
2013
$1,705,000
2012
$2,021,000
2011
-
2010
-
2009
-
2008
-
2007
$2,050,000
2006
-
2005
-
2004
$500,254
2003
-
Hudson Mews
$3,485,000
Median Price
Past 12 months
Past 12 months
2025
$4,295,000
2024
-
2023
$3,400,000
2022
$2,560,000
2021
-
2020
-
2019
-
2018
-
2017
$2,140,000
2016
-
2015
-
2014
-
2013
$1,705,000
2012
$2,021,000
2011
-
2010
-
2009
-
2008
-
2007
$2,050,000
2006
-
2005
-
2004
$500,254
2003
-
Hudson Mews
N/A
Avg. Price
Past 12 months
Past 12 months
2025
$3,900,000
2024
-
2023
-
2022
-
2021
-
2020
-
2019
-
2018
$3,300,000
2017
-
2016
-
2015
-
2014
-
2013
-
2012
$3,050,000
2011
-
2010
-
2009
-
2008
-
2007
$2,206,000
2006
-
2005
-
2004
-
2003
-
Hudson Mews
N/A
Median Price
Past 12 months
Past 12 months
2025
$3,900,000
2024
-
2023
-
2022
-
2021
-
2020
-
2019
-
2018
$3,300,000
2017
-
2016
-
2015
-
2014
-
2013
-
2012
$3,050,000
2011
-
2010
-
2009
-
2008
-
2007
$2,206,000
2006
-
2005
-
2004
-
2003
-
Hudson Mews
N/A
Avg. Price
Past 12 months
Past 12 months
2025
-
2024
-
2023
-
2022
-
2021
-
2020
-
2019
-
2018
-
2017
-
2016
-
2015
-
2014
-
2013
-
2012
-
2011
-
2010
-
2009
-
2008
-
2007
-
2006
-
2005
-
2004
-
2003
-
Hudson Mews
N/A
Median Price
Past 12 months
Past 12 months
2025
-
2024
-
2023
-
2022
-
2021
-
2020
-
2019
-
2018
-
2017
-
2016
-
2015
-
2014
-
2013
-
2012
-
2011
-
2010
-
2009
-
2008
-
2007
-
2006
-
2005
-
2004
-
2003
-
Hudson Mews
N/A
Avg. Price
Past 12 months
Past 12 months
2025
-
2024
-
2023
-
2022
-
2021
-
2020
-
2019
-
2018
-
2017
-
2016
-
2015
-
2014
-
2013
-
2012
-
2011
-
2010
-
2009
-
2008
-
2007
-
2006
-
2005
-
2004
-
2003
-
Hudson Mews
N/A
Median Price
Past 12 months
Past 12 months
2025
-
2024
-
2023
-
2022
-
2021
-
2020
-
2019
-
2018
-
2017
-
2016
-
2015
-
2014
-
2013
-
2012
-
2011
-
2010
-
2009
-
2008
-
2007
-
2006
-
2005
-
2004
-
2003
-
68 Jane Street
N/A
Avg. Price / ft2
Past 12 months
Past 12 months
-
-
-
-
-
-
-
$1,206
$2,309
-
-
-
-
-
-
-
$1,088
$1,301
$1,191
-
-
-
-
68 Jane Street
N/A
Avg. Price
Past 12 months
Past 12 months
-
-
-
-
-
-
-
$4,100,000
$10,000,000
-
-
$3,872,500
$2,850,000
-
$1,910,000
-
$3,700,000
$4,337,500
$2,887,500
-
-
-
$2,499,000
68 Jane Street
N/A
Median Price
Past 12 months
Past 12 months
-
-
-
-
-
-
-
$4,100,000
$10,000,000
-
-
$3,872,500
$2,850,000
-
$1,910,000
-
$3,700,000
$4,337,500
$2,887,500
-
-
-
$2,499,000
68 Jane Street
N/A
Avg. Price / ft2
Past 12 months
Past 12 months
-
-
-
-
-
-
-
-
-
-
-
-
-
-
-
-
-
-
-
-
-
-
-
68 Jane Street
N/A
Avg. Price
Past 12 months
Past 12 months
-
-
-
-
-
-
-
-
-
-
-
-
-
-
-
-
-
-
-
-
-
-
-
68 Jane Street
N/A
Median Price
Past 12 months
Past 12 months
-
-
-
-
-
-
-
-
-
-
-
-
-
-
-
-
-
-
-
-
-
-
-
68 Jane Street
N/A
Avg. Price / ft2
Past 12 months
Past 12 months
-
-
-
-
-
-
-
-
-
-
-
-
-
-
-
-
-
-
-
-
-
-
-
68 Jane Street
N/A
Avg. Price
Past 12 months
Past 12 months
-
-
-
-
-
-
-
-
-
-
-
$3,872,500
$2,850,000
-
$1,910,000
-
-
-
-
-
-
-
$2,499,000
68 Jane Street
N/A
Median Price
Past 12 months
Past 12 months
-
-
-
-
-
-
-
-
-
-
-
$3,872,500
$2,850,000
-
$1,910,000
-
-
-
-
-
-
-
$2,499,000
68 Jane Street
N/A
Avg. Price / ft2
Past 12 months
Past 12 months
-
-
-
-
-
-
-
$1,206
-
-
-
-
-
-
-
-
$1,088
$1,301
$1,191
-
-
-
-
68 Jane Street
N/A
Avg. Price
Past 12 months
Past 12 months
-
-
-
-
-
-
-
$4,100,000
-
-
-
-
-
-
-
-
$3,700,000
$4,337,500
$2,887,500
-
-
-
-
68 Jane Street
N/A
Median Price
Past 12 months
Past 12 months
-
-
-
-
-
-
-
$4,100,000
-
-
-
-
-
-
-
-
$3,700,000
$4,337,500
$2,887,500
-
-
-
-
68 Jane Street
N/A
Avg. Price / ft2
Past 12 months
Past 12 months
-
-
-
-
-
-
-
-
$2,309
-
-
-
-
-
-
-
-
-
-
-
-
-
-
68 Jane Street
N/A
Avg. Price
Past 12 months
Past 12 months
-
-
-
-
-
-
-
-
$10,000,000
-
-
-
-
-
-
-
-
-
-
-
-
-
-
68 Jane Street
N/A
Median Price
Past 12 months
Past 12 months
-
-
-
-
-
-
-
-
$10,000,000
-
-
-
-
-
-
-
-
-
-
-
-
-
-
68 Jane Street
N/A
Avg. Price / ft2
Past 12 months
Past 12 months
-
-
-
-
-
-
-
-
-
-
-
-
-
-
-
-
-
-
-
-
-
-
-
68 Jane Street
N/A
Avg. Price
Past 12 months
Past 12 months
-
-
-
-
-
-
-
-
-
-
-
-
-
-
-
-
-
-
-
-
-
-
-
68 Jane Street
N/A
Median Price
Past 12 months
Past 12 months
-
-
-
-
-
-
-
-
-
-
-
-
-
-
-
-
-
-
-
-
-
-
-
Greenwich House
N/A
Avg. Price / ft2
Past 12 months
Past 12 months
$2,785
-
-
-
-
-
$1,872
-
-
$1,816
-
-
-
$1,351
$1,214
$897
$1,000
-
$1,667
$700
-
-
-
Greenwich House
N/A
Avg. Price
Past 12 months
Past 12 months
$9,631,250
$5,250,000
-
-
-
-
$3,800,000
$3,850,000
-
$3,995,000
$3,450,000
-
-
$2,971,500
$2,550,000
$1,725,000
$2,100,000
-
$3,375,000
$1,225,000
-
-
-
Greenwich House
N/A
Median Price
Past 12 months
Past 12 months
$9,631,250
$5,250,000
-
-
-
-
$3,800,000
$3,850,000
-
$3,995,000
$3,450,000
-
-
$2,971,500
$2,550,000
$1,725,000
$2,100,000
-
$3,375,000
$1,225,000
-
-
-
Greenwich House
N/A
Avg. Price / ft2
Past 12 months
Past 12 months
-
-
-
-
-
-
-
-
-
-
-
-
-
-
-
$686
-
-
-
$700
-
-
-
Greenwich House
N/A
Avg. Price
Past 12 months
Past 12 months
-
-
-
-
-
-
-
-
-
-
-
-
-
-
-
$1,200,000
-
-
-
$1,225,000
-
-
-
Greenwich House
N/A
Median Price
Past 12 months
Past 12 months
-
-
-
-
-
-
-
-
-
-
-
-
-
-
-
$1,200,000
-
-
-
$1,225,000
-
-
-
Greenwich House
N/A
Avg. Price / ft2
Past 12 months
Past 12 months
-
-
-
-
-
-
-
-
-
-
-
-
-
-
-
-
-
-
-
-
-
-
-
Greenwich House
N/A
Avg. Price
Past 12 months
Past 12 months
-
-
-
-
-
-
-
-
-
-
-
-
-
-
-
-
-
-
-
-
-
-
-
Greenwich House
N/A
Median Price
Past 12 months
Past 12 months
-
-
-
-
-
-
-
-
-
-
-
-
-
-
-
-
-
-
-
-
-
-
-
Greenwich House
N/A
Avg. Price / ft2
Past 12 months
Past 12 months
$2,052
-
-
-
-
-
$1,872
-
-
$1,816
-
-
-
$1,665
$1,214
$1,108
$1,000
-
$1,667
-
-
-
-
Greenwich House
N/A
Avg. Price
Past 12 months
Past 12 months
$4,612,500
-
-
-
-
-
$3,800,000
-
-
$3,995,000
$3,450,000
-
-
$3,663,000
$2,550,000
$2,250,000
$2,100,000
-
$3,375,000
-
-
-
-
Greenwich House
N/A
Median Price
Past 12 months
Past 12 months
$4,612,500
-
-
-
-
-
$3,800,000
-
-
$3,995,000
$3,450,000
-
-
$3,663,000
$2,550,000
$2,250,000
$2,100,000
-
$3,375,000
-
-
-
-
Greenwich House
N/A
Avg. Price / ft2
Past 12 months
Past 12 months
-
-
-
-
-
-
-
-
-
-
-
-
-
$1,036
-
-
-
-
-
-
-
-
-
Greenwich House
N/A
Avg. Price
Past 12 months
Past 12 months
-
-
-
-
-
-
-
-
-
-
-
-
-
$2,280,000
-
-
-
-
-
-
-
-
-
Greenwich House
N/A
Median Price
Past 12 months
Past 12 months
-
-
-
-
-
-
-
-
-
-
-
-
-
$2,280,000
-
-
-
-
-
-
-
-
-
Greenwich House
N/A
Avg. Price / ft2
Past 12 months
Past 12 months
$3,519
-
-
-
-
-
-
-
-
-
-
-
-
-
-
-
-
-
-
-
-
-
-
Greenwich House
N/A
Avg. Price
Past 12 months
Past 12 months
$14,650,000
$5,250,000
-
-
-
-
-
$3,850,000
-
-
-
-
-
-
-
-
-
-
-
-
-
-
-
Greenwich House
N/A
Median Price
Past 12 months
Past 12 months
$14,650,000
$5,250,000
-
-
-
-
-
$3,850,000
-
-
-
-
-
-
-
-
-
-
-
-
-
-
-
Greenwich House
N/A
Avg. Price / ft2
Past 12 months
Past 12 months
-
-
-
-
-
-
-
-
-
-
-
-
-
-
-
-
-
-
-
-
-
-
-
Greenwich House
N/A
Avg. Price
Past 12 months
Past 12 months
-
-
-
-
-
-
-
-
-
-
-
-
-
-
-
-
-
-
-
-
-
-
-
Greenwich House
N/A
Median Price
Past 12 months
Past 12 months
-
-
-
-
-
-
-
-
-
-
-
-
-
-
-
-
-
-
-
-
-
-
-
571 Hudson Street
N/A
Avg. Price / ft2
Past 12 months
Past 12 months
-
$1,169
$1,335
-
-
-
-
-
-
-
-
$1,533
-
-
-
$1,188
-
-
-
$1,317
$1,062
-
-
571 Hudson Street
$1,570,000
Avg. Price
Past 12 months
Past 12 months
$1,570,000
$1,870,000
$1,735,000
$2,150,000
$1,445,000
$2,200,000
-
-
-
-
-
$2,005,000
-
$1,515,000
-
$1,587,500
-
-
$1,225,000
$1,600,000
$1,699,000
$650,000
-
571 Hudson Street
$1,570,000
Median Price
Past 12 months
Past 12 months
$1,570,000
$1,870,000
$1,735,000
$2,150,000
$1,445,000
$2,200,000
-
-
-
-
-
$1,590,000
-
$1,515,000
-
$1,587,500
-
-
$1,225,000
$1,600,000
$1,699,000
$650,000
-
571 Hudson Street
N/A
Avg. Price / ft2
Past 12 months
Past 12 months
-
-
-
-
-
-
-
-
-
-
-
-
-
-
-
-
-
-
-
-
-
-
-
571 Hudson Street
N/A
Avg. Price
Past 12 months
Past 12 months
-
-
-
-
-
-
-
-
-
-
-
-
-
-
-
-
-
-
-
-
-
-
-
571 Hudson Street
N/A
Median Price
Past 12 months
Past 12 months
-
-
-
-
-
-
-
-
-
-
-
-
-
-
-
-
-
-
-
-
-
-
-
571 Hudson Street
N/A
Avg. Price / ft2
Past 12 months
Past 12 months
-
-
-
-
-
-
-
-
-
-
-
$1,844
-
-
-
$1,188
-
-
-
-
$1,062
-
-
571 Hudson Street
N/A
Avg. Price
Past 12 months
Past 12 months
-
-
-
-
-
$2,200,000
-
-
-
-
-
$2,212,500
-
$1,515,000
-
$1,900,000
-
-
$1,225,000
-
$1,699,000
$650,000
-
571 Hudson Street
N/A
Median Price
Past 12 months
Past 12 months
-
-
-
-
-
$2,200,000
-
-
-
-
-
$2,212,500
-
$1,515,000
-
$1,900,000
-
-
$1,225,000
-
$1,699,000
$650,000
-
571 Hudson Street
N/A
Avg. Price / ft2
Past 12 months
Past 12 months
-
$1,169
$1,335
-
-
-
-
-
-
-
-
$1,223
-
-
-
-
-
-
-
$1,317
-
-
-
571 Hudson Street
$1,570,000
Avg. Price
Past 12 months
Past 12 months
$1,570,000
$1,870,000
$1,735,000
$2,150,000
$1,445,000
-
-
-
-
-
-
$1,590,000
-
-
-
$1,275,000
-
-
-
$1,600,000
-
-
-
571 Hudson Street
$1,570,000
Median Price
Past 12 months
Past 12 months
$1,570,000
$1,870,000
$1,735,000
$2,150,000
$1,445,000
-
-
-
-
-
-
$1,590,000
-
-
-
$1,275,000
-
-
-
$1,600,000
-
-
-
571 Hudson Street
N/A
Avg. Price / ft2
Past 12 months
Past 12 months
-
-
-
-
-
-
-
-
-
-
-
-
-
-
-
-
-
-
-
-
-
-
-
571 Hudson Street
N/A
Avg. Price
Past 12 months
Past 12 months
-
-
-
-
-
-
-
-
-
-
-
-
-
-
-
-
-
-
-
-
-
-
-
571 Hudson Street
N/A
Median Price
Past 12 months
Past 12 months
-
-
-
-
-
-
-
-
-
-
-
-
-
-
-
-
-
-
-
-
-
-
-
571 Hudson Street
N/A
Avg. Price / ft2
Past 12 months
Past 12 months
-
-
-
-
-
-
-
-
-
-
-
-
-
-
-
-
-
-
-
-
-
-
-
571 Hudson Street
N/A
Avg. Price
Past 12 months
Past 12 months
-
-
-
-
-
-
-
-
-
-
-
-
-
-
-
-
-
-
-
-
-
-
-
571 Hudson Street
N/A
Median Price
Past 12 months
Past 12 months
-
-
-
-
-
-
-
-
-
-
-
-
-
-
-
-
-
-
-
-
-
-
-
171 West 12th Street
N/A
Avg. Price / ft2
Past 12 months
Past 12 months
-
-
-
-
$1,767
-
-
-
-
-
-
-
-
$1,333
-
-
-
-
-
-
-
-
-
171 West 12th Street
$1,750,000
Avg. Price
Past 12 months
Past 12 months
$1,750,000
-
-
-
$1,590,000
-
$1,650,000
$1,822,000
-
$3,025,000
-
-
$1,550,000
$1,370,833
-
-
$900,000
-
$1,525,000
-
$1,450,000
-
-
171 West 12th Street
$1,750,000
Median Price
Past 12 months
Past 12 months
$1,750,000
-
-
-
$1,590,000
-
$1,650,000
$1,822,000
-
$3,025,000
-
-
$1,550,000
$1,200,000
-
-
$900,000
-
$1,525,000
-
$1,450,000
-
-
171 West 12th Street
N/A
Avg. Price / ft2
Past 12 months
Past 12 months
-
-
-
-
-
-
-
-
-
-
-
-
-
-
-
-
-
-
-
-
-
-
-
171 West 12th Street
N/A
Avg. Price
Past 12 months
Past 12 months
-
-
-
-
-
-
-
-
-
-
-
-
-
-
-
-
-
-
-
-
-
-
-
171 West 12th Street
N/A
Median Price
Past 12 months
Past 12 months
-
-
-
-
-
-
-
-
-
-
-
-
-
-
-
-
-
-
-
-
-
-
-
171 West 12th Street
N/A
Avg. Price / ft2
Past 12 months
Past 12 months
-
-
-
-
$1,767
-
-
-
-
-
-
-
-
$1,333
-
-
-
-
-
-
-
-
-
171 West 12th Street
$1,750,000
Avg. Price
Past 12 months
Past 12 months
$1,750,000
-
-
-
$1,590,000
-
$1,650,000
$1,822,000
-
$3,025,000
-
-
$1,550,000
$1,370,833
-
-
-
-
$1,525,000
-
$1,450,000
-
-
171 West 12th Street
$1,750,000
Median Price
Past 12 months
Past 12 months
$1,750,000
-
-
-
$1,590,000
-
$1,650,000
$1,822,000
-
$3,025,000
-
-
$1,550,000
$1,200,000
-
-
-
-
$1,525,000
-
$1,450,000
-
-
171 West 12th Street
N/A
Avg. Price / ft2
Past 12 months
Past 12 months
-
-
-
-
-
-
-
-
-
-
-
-
-
-
-
-
-
-
-
-
-
-
-
171 West 12th Street
N/A
Avg. Price
Past 12 months
Past 12 months
-
-
-
-
-
-
-
-
-
-
-
-
-
-
-
-
-
-
-
-
-
-
-
171 West 12th Street
N/A
Median Price
Past 12 months
Past 12 months
-
-
-
-
-
-
-
-
-
-
-
-
-
-
-
-
-
-
-
-
-
-
-
171 West 12th Street
N/A
Avg. Price / ft2
Past 12 months
Past 12 months
-
-
-
-
-
-
-
-
-
-
-
-
-
-
-
-
-
-
-
-
-
-
-
171 West 12th Street
N/A
Avg. Price
Past 12 months
Past 12 months
-
-
-
-
-
-
-
-
-
-
-
-
-
-
-
-
-
-
-
-
-
-
-
171 West 12th Street
N/A
Median Price
Past 12 months
Past 12 months
-
-
-
-
-
-
-
-
-
-
-
-
-
-
-
-
-
-
-
-
-
-
-
354 West 12th Street
N/A
Avg. Price / ft2
Past 12 months
Past 12 months
$578
$1,803
$2,660
-
$2,250
$1,543
-
-
$1,499
$1,776
-
$1,417
$1,599
$1,044
$719
-
-
-
$1,300
-
$762
$724
$400
354 West 12th Street
$532,333
Avg. Price
Past 12 months
Past 12 months
$622,167
$901,500
$700,000
$829,500
$925,000
$489,500
$999,000
$740,000
$749,500
$735,800
$600,000
$456,667
$887,500
$428,333
$519,500
-
$460,000
$420,000
$466,667
$488,864
$321,000
$315,833
$195,000
354 West 12th Street
$505,000
Median Price
Past 12 months
Past 12 months
$520,000
$901,500
$700,000
$829,500
$455,000
$489,500
$999,000
$800,000
$749,500
$500,000
$540,000
$425,000
$887,500
$345,000
$370,000
-
$460,000
$420,000
$390,000
$488,864
$277,500
$265,000
$195,000
354 West 12th Street
N/A
Avg. Price / ft2
Past 12 months
Past 12 months
$578
-
$2,660
-
$2,250
$1,543
-
-
-
$1,776
-
$1,417
-
-
$719
-
-
-
$1,300
-
$762
$724
$400
354 West 12th Street
$483,800
Avg. Price
Past 12 months
Past 12 months
$502,500
$478,000
$700,000
$499,000
$925,000
$489,500
-
$455,000
-
$735,800
$600,000
$422,500
-
$328,750
$519,500
-
$350,000
-
$357,500
$488,864
$345,500
$262,000
$200,000
354 West 12th Street
$485,000
Median Price
Past 12 months
Past 12 months
$502,500
$478,000
$700,000
$499,000
$455,000
$489,500
-
$455,000
-
$500,000
$540,000
$422,500
-
$337,500
$370,000
-
$350,000
-
$357,500
$488,864
$285,000
$262,000
$200,000
354 West 12th Street
N/A
Avg. Price / ft2
Past 12 months
Past 12 months
-
$1,803
-
-
-
-
-
-
$1,499
-
-
-
$1,599
$1,044
-
-
-
-
-
-
-
-
$400
354 West 12th Street
$775,000
Avg. Price
Past 12 months
Past 12 months
$861,500
$1,325,000
-
$1,160,000
-
-
$999,000
$835,000
$749,500
-
-
$525,000
$887,500
$627,500
-
-
$570,000
-
$685,000
-
$269,000
$423,500
$190,000
354 West 12th Street
$775,000
Median Price
Past 12 months
Past 12 months
$861,500
$1,325,000
-
$1,160,000
-
-
$999,000
$815,000
$749,500
-
-
$525,000
$887,500
$627,500
-
-
$570,000
-
$685,000
-
$269,000
$423,500
$190,000
354 West 12th Street
N/A
Avg. Price / ft2
Past 12 months
Past 12 months
-
-
-
-
-
-
-
-
-
-
-
-
-
-
-
-
-
-
-
-
-
-
-
354 West 12th Street
N/A
Avg. Price
Past 12 months
Past 12 months
-
-
-
-
-
-
-
-
-
-
-
-
-
-
-
-
-
-
-
-
-
-
-
354 West 12th Street
N/A
Median Price
Past 12 months
Past 12 months
-
-
-
-
-
-
-
-
-
-
-
-
-
-
-
-
-
-
-
-
-
-
-
354 West 12th Street
N/A
Avg. Price / ft2
Past 12 months
Past 12 months
-
-
-
-
-
-
-
-
-
-
-
-
-
-
-
-
-
-
-
-
-
-
-
354 West 12th Street
N/A
Avg. Price
Past 12 months
Past 12 months
-
-
-
-
-
-
-
-
-
-
-
-
-
-
-
-
-
-
-
-
-
-
-
354 West 12th Street
N/A
Median Price
Past 12 months
Past 12 months
-
-
-
-
-
-
-
-
-
-
-
-
-
-
-
-
-
-
-
-
-
-
-
The Halloran
N/A
Avg. Price / ft2
Past 12 months
Past 12 months
-
-
$1,425
$1,477
$1,491
$1,295
$1,413
$1,359
$909
-
$1,115
-
$1,157
$1,019
$1,074
$989
-
-
$959
$1,111
$961
-
$563
The Halloran
$666,250
Avg. Price
Past 12 months
Past 12 months
-
$734,000
$1,055,000
$922,400
$1,373,167
$834,000
$878,000
$886,643
$573,250
$727,500
$701,667
$530,833
$1,616,125
$645,400
$754,167
$587,500
$438,000
$729,833
$829,419
$649,000
$620,000
$478,429
$386,700
The Halloran
$652,500
Median Price
Past 12 months
Past 12 months
-
$542,000
$1,197,500
$742,000
$752,500
$834,000
$870,000
$905,000
$579,500
$727,500
$660,000
$555,000
$769,500
$645,000
$775,000
$587,500
$460,000
$739,500
$605,000
$550,000
$605,000
$425,000
$395,000
The Halloran
N/A
Avg. Price / ft2
Past 12 months
Past 12 months
-
-
-
$1,477
$1,378
$1,165
-
$1,314
$909
-
$1,115
-
$1,092
$773
$917
-
-
-
$864
-
-
-
-
The Halloran
$601,667
Avg. Price
Past 12 months
Past 12 months
-
$526,000
$550,000
$696,000
$618,667
$670,000
-
$559,500
$564,667
$675,000
$627,500
$530,833
$534,500
$513,500
$412,500
-
$386,667
-
$380,000
$482,500
-
-
$367,000
The Halloran
$590,000
Median Price
Past 12 months
Past 12 months
-
$526,000
$550,000
$696,000
$610,000
$670,000
-
$559,500
$560,000
$675,000
$627,500
$555,000
$534,500
$513,500
$412,500
-
$350,000
-
$380,000
$482,500
-
-
$367,000
The Halloran
N/A
Avg. Price / ft2
Past 12 months
Past 12 months
-
-
$1,425
-
$1,605
$1,426
$1,413
$1,382
-
-
-
-
$1,222
$1,101
$1,153
$989
-
-
$1,055
$1,111
$961
-
$563
The Halloran
$860,000
Avg. Price
Past 12 months
Past 12 months
-
$1,150,000
$1,223,333
$900,000
$1,004,000
$998,000
$878,000
$970,833
$599,000
$780,000
$850,000
-
$675,000
$733,333
$925,000
$587,500
$515,000
$739,500
$649,843
$704,333
$656,250
$535,000
$391,625
The Halloran
$860,000
Median Price
Past 12 months
Past 12 months
-
$1,150,000
$1,200,000
$900,000
$1,004,000
$998,000
$870,000
$907,500
$599,000
$780,000
$850,000
-
$625,000
$655,000
$925,000
$587,500
$515,000
$739,500
$605,000
$718,000
$640,000
$535,000
$422,500
The Halloran
N/A
Avg. Price / ft2
Past 12 months
Past 12 months
-
-
-
-
-
-
-
-
-
-
-
-
-
-
-
-
-
-
-
-
-
-
-
The Halloran
N/A
Avg. Price
Past 12 months
Past 12 months
-
-
-
$1,420,000
-
-
-
$1,525,000
-
-
-
-
$2,817,500
-
-
-
-
-
$1,120,075
$915,000
-
-
-
The Halloran
N/A
Median Price
Past 12 months
Past 12 months
-
-
-
$1,420,000
-
-
-
$1,525,000
-
-
-
-
$2,817,500
-
-
-
-
-
$1,120,075
$915,000
-
-
-
The Halloran
N/A
Avg. Price / ft2
Past 12 months
Past 12 months
-
-
-
-
-
-
-
-
-
-
-
-
-
-
-
-
-
-
-
-
-
-
-
The Halloran
N/A
Avg. Price
Past 12 months
Past 12 months
-
-
-
-
$4,375,000
-
-
-
-
-
-
-
$4,200,000
-
-
-
-
-
-
-
-
-
-
The Halloran
N/A
Median Price
Past 12 months
Past 12 months
-
-
-
-
$4,375,000
-
-
-
-
-
-
-
$4,200,000
-
-
-
-
-
-
-
-
-
-
The Halloran
N/A
Avg. Price / ft2
Past 12 months
Past 12 months
-
-
-
-
-
-
-
-
-
-
-
-
-
-
-
-
-
-
-
-
-
-
-
The Halloran
N/A
Avg. Price
Past 12 months
Past 12 months
-
-
-
-
-
-
-
-
-
-
-
-
-
-
-
-
-
-
-
-
-
-
-
The Halloran
N/A
Median Price
Past 12 months
Past 12 months
-
-
-
-
-
-
-
-
-
-
-
-
-
-
-
-
-
-
-
-
-
-
-
The Halloran
N/A
Avg. Price / ft2
Past 12 months
Past 12 months
-
-
-
-
-
-
-
-
-
-
-
-
-
-
-
-
-
-
-
-
-
-
-
The Halloran
N/A
Avg. Price
Past 12 months
Past 12 months
-
-
-
-
-
-
-
-
-
-
-
-
-
-
-
-
-
-
-
-
-
-
-
The Halloran
N/A
Median Price
Past 12 months
Past 12 months
-
-
-
-
-
-
-
-
-
-
-
-
-
-
-
-
-
-
-
-
-
-
-
720 Greenwich Street
N/A
Avg. Price / ft2
Past 12 months
Past 12 months
-
-
$1,150
$1,469
$1,860
-
$1,311
$1,029
-
$2,367
$1,446
-
$1,244
$1,200
$982
$1,091
$853
$1,138
$1,010
$869
$925
$763
$588
720 Greenwich Street
$3,353,333
Avg. Price
Past 12 months
Past 12 months
$3,353,333
$805,000
$754,750
$1,183,761
$2,135,000
-
$992,000
$709,000
$1,360,000
$2,220,000
$1,265,000
$1,295,000
$740,250
$1,124,444
$788,813
$855,038
$720,000
$896,750
$567,000
$619,000
$785,833
$650,167
$512,944
720 Greenwich Street
$3,353,333
Median Price
Past 12 months
Past 12 months
$3,353,333
$770,000
$732,000
$975,000
$2,060,000
-
$1,100,000
$720,000
$1,360,000
$2,830,000
$1,265,000
$1,295,000
$755,500
$960,000
$615,000
$840,575
$720,000
$843,500
$567,000
$545,000
$710,000
$777,500
$500,000
720 Greenwich Street
N/A
Avg. Price / ft2
Past 12 months
Past 12 months
-
-
$1,150
$1,341
-
-
$1,435
$1,036
-
-
-
-
-
$914
$898
$998
$811
$948
$1,010
$857
$781
$640
$487
720 Greenwich Street
N/A
Avg. Price
Past 12 months
Past 12 months
-
$770,000
$754,750
$733,333
$880,000
-
$689,000
$707,000
-
-
-
-
-
$580,000
$462,125
$499,000
$365,000
$550,000
$505,000
$408,000
$375,000
$288,000
$254,167
720 Greenwich Street
N/A
Median Price
Past 12 months
Past 12 months
-
$770,000
$732,000
$665,000
$880,000
-
$689,000
$725,000
-
-
-
-
-
$580,000
$474,250
$499,000
$365,000
$550,000
$505,000
$400,000
$375,000
$288,000
$287,500
720 Greenwich Street
N/A
Avg. Price / ft2
Past 12 months
Past 12 months
-
-
-
$1,308
$1,860
-
$1,187
$1,021
-
$2,367
$1,446
-
$1,244
$1,271
$1,071
$1,122
-
$1,202
-
$885
$972
$885
$649
720 Greenwich Street
N/A
Avg. Price
Past 12 months
Past 12 months
-
$840,000
-
$1,222,108
$2,060,000
-
$1,143,500
$715,000
$1,360,000
$1,915,000
$1,265,000
$1,295,000
$937,000
$1,126,667
$787,333
$973,717
-
$1,012,333
$629,000
$830,000
$747,500
$831,250
$642,333
720 Greenwich Street
N/A
Median Price
Past 12 months
Past 12 months
-
$840,000
-
$1,100,000
$2,060,000
-
$1,143,500
$715,000
$1,360,000
$1,915,000
$1,265,000
$1,295,000
$769,000
$1,045,000
$817,000
$1,062,150
-
$950,000
$629,000
$840,000
$710,000
$831,250
$647,000
720 Greenwich Street
N/A
Avg. Price / ft2
Past 12 months
Past 12 months
-
-
-
$2,017
-
-
-
-
-
-
-
-
-
-
-
-
$896
-
-
-
-
-
-
720 Greenwich Street
$3,353,333
Avg. Price
Past 12 months
Past 12 months
$3,353,333
-
-
$2,420,000
-
-
-
-
-
$2,830,000
-
-
$150,000
$2,200,000
-
-
$1,075,000
-
-
-
$1,350,000
-
-
720 Greenwich Street
$3,353,333
Median Price
Past 12 months
Past 12 months
$3,353,333
-
-
$2,420,000
-
-
-
-
-
$2,830,000
-
-
$150,000
$2,200,000
-
-
$1,075,000
-
-
-
$1,350,000
-
-
720 Greenwich Street
N/A
Avg. Price / ft2
Past 12 months
Past 12 months
-
-
-
-
-
-
-
-
-
-
-
-
-
-
$1,135
-
-
-
-
-
-
-
-
720 Greenwich Street
N/A
Avg. Price
Past 12 months
Past 12 months
-
-
-
-
$3,540,000
-
-
-
-
-
-
-
-
-
$2,100,000
-
-
-
-
-
-
-
-
720 Greenwich Street
N/A
Median Price
Past 12 months
Past 12 months
-
-
-
-
$3,540,000
-
-
-
-
-
-
-
-
-
$2,100,000
-
-
-
-
-
-
-
-
720 Greenwich Street
N/A
Avg. Price / ft2
Past 12 months
Past 12 months
-
-
-
-
-
-
-
-
-
-
-
-
-
-
-
-
-
-
-
-
-
-
-
720 Greenwich Street
N/A
Avg. Price
Past 12 months
Past 12 months
-
-
-
-
-
-
-
-
-
-
-
-
-
-
-
-
-
-
-
-
-
-
-
720 Greenwich Street
N/A
Median Price
Past 12 months
Past 12 months
-
-
-
-
-
-
-
-
-
-
-
-
-
-
-
-
-
-
-
-
-
-
-
720 Greenwich Street
N/A
Avg. Price / ft2
Past 12 months
Past 12 months
-
-
-
-
-
-
-
-
-
-
-
-
-
-
-
-
-
-
-
-
-
-
-
720 Greenwich Street
N/A
Avg. Price
Past 12 months
Past 12 months
-
-
-
-
-
-
-
-
-
-
-
-
-
-
-
-
-
-
-
-
-
-
-
720 Greenwich Street
N/A
Median Price
Past 12 months
Past 12 months
-
-
-
-
-
-
-
-
-
-
-
-
-
-
-
-
-
-
-
-
-
-
-
638 Washington Street
N/A
Avg. Price / ft2
Past 12 months
Past 12 months
-
-
-
-
-
-
-
-
-
$1,513
$1,619
$1,188
-
-
-
-
-
-
-
-
-
-
-
638 Washington Street
$1,070,000
Avg. Price
Past 12 months
Past 12 months
-
-
-
-
-
-
-
-
-
$1,210,000
$1,295,000
$1,900,000
-
-
-
-
-
-
-
-
-
-
-
638 Washington Street
$1,070,000
Median Price
Past 12 months
Past 12 months
-
-
-
-
-
-
-
-
-
$1,210,000
$1,295,000
$1,900,000
-
-
-
-
-
-
-
-
-
-
-
638 Washington Street
N/A
Avg. Price / ft2
Past 12 months
Past 12 months
-
-
-
-
-
-
-
-
-
-
-
-
-
-
-
-
-
-
-
-
-
-
-
638 Washington Street
N/A
Avg. Price
Past 12 months
Past 12 months
-
-
-
-
-
-
-
-
-
-
-
-
-
-
-
-
-
-
-
-
-
-
-
638 Washington Street
N/A
Median Price
Past 12 months
Past 12 months
-
-
-
-
-
-
-
-
-
-
-
-
-
-
-
-
-
-
-
-
-
-
-
638 Washington Street
N/A
Avg. Price / ft2
Past 12 months
Past 12 months
-
-
-
-
-
-
-
-
-
$1,513
$1,619
-
-
-
-
-
-
-
-
-
-
-
-
638 Washington Street
$1,070,000
Avg. Price
Past 12 months
Past 12 months
-
-
-
-
-
-
-
-
-
$1,210,000
$1,295,000
-
-
-
-
-
-
-
-
-
-
-
-
638 Washington Street
$1,070,000
Median Price
Past 12 months
Past 12 months
-
-
-
-
-
-
-
-
-
$1,210,000
$1,295,000
-
-
-
-
-
-
-
-
-
-
-
-
638 Washington Street
N/A
Avg. Price / ft2
Past 12 months
Past 12 months
-
-
-
-
-
-
-
-
-
-
-
-
-
-
-
-
-
-
-
-
-
-
-
638 Washington Street
N/A
Avg. Price
Past 12 months
Past 12 months
-
-
-
-
-
-
-
-
-
-
-
-
-
-
-
-
-
-
-
-
-
-
-
638 Washington Street
N/A
Median Price
Past 12 months
Past 12 months
-
-
-
-
-
-
-
-
-
-
-
-
-
-
-
-
-
-
-
-
-
-
-
638 Washington Street
N/A
Avg. Price / ft2
Past 12 months
Past 12 months
-
-
-
-
-
-
-
-
-
-
-
$1,188
-
-
-
-
-
-
-
-
-
-
-
638 Washington Street
N/A
Avg. Price
Past 12 months
Past 12 months
-
-
-
-
-
-
-
-
-
-
-
$1,900,000
-
-
-
-
-
-
-
-
-
-
-
638 Washington Street
N/A
Median Price
Past 12 months
Past 12 months
-
-
-
-
-
-
-
-
-
-
-
$1,900,000
-
-
-
-
-
-
-
-
-
-
-
638 Washington Street
N/A
Avg. Price / ft2
Past 12 months
Past 12 months
-
-
-
-
-
-
-
-
-
-
-
-
-
-
-
-
-
-
-
-
-
-
-
638 Washington Street
N/A
Avg. Price
Past 12 months
Past 12 months
-
-
-
-
-
-
-
-
-
-
-
-
-
-
-
-
-
-
-
-
-
-
-
638 Washington Street
N/A
Median Price
Past 12 months
Past 12 months
-
-
-
-
-
-
-
-
-
-
-
-
-
-
-
-
-
-
-
-
-
-
-
708 Greenwich Street
$1,250
Avg. Price / ft2
Past 12 months
Past 12 months
$1,250
$1,655
-
$1,570
$1,771
-
$1,682
-
-
$1,304
$2,485
-
$1,147
-
$1,076
$1,000
$895
-
-
-
$1,000
$1,121
-
708 Greenwich Street
$3,750,000
Avg. Price
Past 12 months
Past 12 months
$3,750,000
$1,655,000
-
$1,887,260
$2,537,000
$4,500,000
$1,850,000
-
-
$2,787,500
$3,205,000
-
$1,480,000
-
$1,192,500
$1,200,000
$940,000
-
-
-
$1,200,000
$1,450,000
-
708 Greenwich Street
$3,750,000
Median Price
Past 12 months
Past 12 months
$3,750,000
$1,655,000
-
$1,870,000
$1,940,000
$4,500,000
$1,850,000
-
-
$2,787,500
$3,205,000
-
$1,480,000
-
$1,192,500
$1,200,000
$940,000
-
-
-
$1,200,000
$1,450,000
-
708 Greenwich Street
N/A
Avg. Price / ft2
Past 12 months
Past 12 months
-
-
-
$1,214
-
-
-
-
-
$1,304
-
-
-
-
-
$1,000
-
-
-
-
-
-
-
708 Greenwich Street
N/A
Avg. Price
Past 12 months
Past 12 months
-
-
-
$1,275,000
-
-
-
-
-
$1,825,000
-
-
-
-
-
$1,200,000
-
-
-
-
-
-
-
708 Greenwich Street
N/A
Median Price
Past 12 months
Past 12 months
-
-
-
$1,275,000
-
-
-
-
-
$1,825,000
-
-
-
-
-
$1,200,000
-
-
-
-
-
-
-
708 Greenwich Street
N/A
Avg. Price / ft2
Past 12 months
Past 12 months
-
$1,655
-
$1,558
-
-
$1,682
-
-
-
$1,752
-
$1,147
-
$1,076
-
$895
-
-
-
$1,000
-
-
708 Greenwich Street
N/A
Avg. Price
Past 12 months
Past 12 months
-
$1,655,000
-
$1,870,000
$1,320,000
-
$1,850,000
-
-
-
$2,260,000
-
$1,480,000
-
$1,192,500
-
$940,000
-
-
-
$1,200,000
-
-
708 Greenwich Street
N/A
Median Price
Past 12 months
Past 12 months
-
$1,655,000
-
$1,870,000
$1,320,000
-
$1,850,000
-
-
-
$2,260,000
-
$1,480,000
-
$1,192,500
-
$940,000
-
-
-
$1,200,000
-
-
708 Greenwich Street
N/A
Avg. Price / ft2
Past 12 months
Past 12 months
-
-
-
$1,936
$1,771
-
-
-
-
-
$3,217
-
-
-
-
-
-
-
-
-
-
$1,121
-
708 Greenwich Street
N/A
Avg. Price
Past 12 months
Past 12 months
-
-
-
$2,516,779
$2,841,250
$4,500,000
-
-
-
$3,750,000
$4,150,000
-
-
-
-
-
-
-
-
-
-
$1,450,000
-
708 Greenwich Street
N/A
Median Price
Past 12 months
Past 12 months
-
-
-
$2,516,779
$2,132,500
$4,500,000
-
-
-
$3,750,000
$4,150,000
-
-
-
-
-
-
-
-
-
-
$1,450,000
-
708 Greenwich Street
N/A
Avg. Price / ft2
Past 12 months
Past 12 months
-
-
-
-
-
-
-
-
-
-
-
-
-
-
-
-
-
-
-
-
-
-
-
708 Greenwich Street
N/A
Avg. Price
Past 12 months
Past 12 months
-
-
-
-
-
-
-
-
-
-
-
-
-
-
-
-
-
-
-
-
-
-
-
708 Greenwich Street
N/A
Median Price
Past 12 months
Past 12 months
-
-
-
-
-
-
-
-
-
-
-
-
-
-
-
-
-
-
-
-
-
-
-
708 Greenwich Street
$1,250
Avg. Price / ft2
Past 12 months
Past 12 months
$1,250
-
-
-
-
-
-
-
-
-
-
-
-
-
-
-
-
-
-
-
-
-
-
708 Greenwich Street
$3,750,000
Avg. Price
Past 12 months
Past 12 months
$3,750,000
-
-
-
-
-
-
-
-
-
-
-
-
-
-
-
-
-
-
-
-
-
-
708 Greenwich Street
$3,750,000
Median Price
Past 12 months
Past 12 months
$3,750,000
-
-
-
-
-
-
-
-
-
-
-
-
-
-
-
-
-
-
-
-
-
-
708 Greenwich Street
N/A
Avg. Price / ft2
Past 12 months
Past 12 months
-
-
-
-
-
-
-
-
-
-
-
-
-
-
-
-
-
-
-
-
-
-
-
708 Greenwich Street
N/A
Avg. Price
Past 12 months
Past 12 months
-
-
-
-
-
-
-
-
-
-
-
-
-
-
-
-
-
-
-
-
-
-
-
708 Greenwich Street
N/A
Median Price
Past 12 months
Past 12 months
-
-
-
-
-
-
-
-
-
-
-
-
-
-
-
-
-
-
-
-
-
-
-
Abingdon Court
$1,706
Avg. Price / ft2
Past 12 months
Past 12 months
$1,862
-
-
-
$1,002
$1,225
-
$1,146
-
$1,567
-
$1,136
-
-
$1,677
$1,125
-
-
$1,417
$805
-
$538
$698
Abingdon Court
$1,699,500
Avg. Price
Past 12 months
Past 12 months
$1,371,400
$1,047,500
$1,403,750
$720,855
$651,000
$812,500
$1,235,000
$794,396
-
$880,000
-
$806,942
$629,625
$1,176,667
$1,375,000
$763,577
-
$1,310,000
$1,275,000
$438,750
$695,000
$350,000
$411,000
Abingdon Court
$1,425,000
Median Price
Past 12 months
Past 12 months
$1,350,000
$1,047,500
$1,187,500
$720,855
$651,000
$812,500
$1,235,000
$775,000
-
$880,000
-
$745,000
$629,625
$680,000
$1,375,000
$763,577
-
$1,310,000
$1,275,000
$438,750
$695,000
$350,000
$411,000
Abingdon Court
$1,583
Avg. Price / ft2
Past 12 months
Past 12 months
$1,583
-
-
-
$1,002
$1,225
-
$1,146
-
-
-
$1,016
-
-
-
$1,067
-
-
-
$805
-
$538
-
Abingdon Court
$950,000
Avg. Price
Past 12 months
Past 12 months
$1,025,000
$595,000
$742,500
-
$651,000
$812,500
$1,235,000
$608,333
-
$585,000
-
$804,903
$510,000
$677,500
-
$640,000
-
-
-
$442,500
-
$350,000
$250,000
Abingdon Court
$950,000
Median Price
Past 12 months
Past 12 months
$1,025,000
$595,000
$742,500
-
$651,000
$812,500
$1,235,000
$602,500
-
$585,000
-
$745,000
$510,000
$677,500
-
$640,000
-
-
-
$442,500
-
$350,000
$250,000
Abingdon Court
$1,829
Avg. Price / ft2
Past 12 months
Past 12 months
$1,829
-
-
-
-
-
-
-
-
$1,567
-
$1,256
-
-
$1,677
$1,183
-
-
-
-
-
-
$698
Abingdon Court
$1,425,000
Avg. Price
Past 12 months
Past 12 months
$1,425,000
$1,500,000
-
-
-
-
-
$1,001,250
-
$1,175,000
-
$810,000
-
-
$1,375,000
$887,153
-
-
-
$435,000
$695,000
-
$572,000
Abingdon Court
$1,425,000
Median Price
Past 12 months
Past 12 months
$1,425,000
$1,500,000
-
-
-
-
-
$1,001,250
-
$1,175,000
-
$810,000
-
-
$1,375,000
$887,153
-
-
-
$435,000
$695,000
-
$572,000
Abingdon Court
N/A
Avg. Price / ft2
Past 12 months
Past 12 months
$2,174
-
-
-
-
-
-
-
-
-
-
-
-
-
-
-
-
-
$1,417
-
-
-
-
Abingdon Court
N/A
Avg. Price
Past 12 months
Past 12 months
$1,957,000
-
$1,480,000
$720,855
-
-
-
-
-
-
-
-
-
$2,175,000
-
-
-
$1,310,000
$1,275,000
-
-
-
-
Abingdon Court
N/A
Median Price
Past 12 months
Past 12 months
$1,957,000
-
$1,480,000
$720,855
-
-
-
-
-
-
-
-
-
$2,175,000
-
-
-
$1,310,000
$1,275,000
-
-
-
-
Abingdon Court
N/A
Avg. Price / ft2
Past 12 months
Past 12 months
-
-
-
-
-
-
-
-
-
-
-
-
-
-
-
-
-
-
-
-
-
-
-
Abingdon Court
$2,998,000
Avg. Price
Past 12 months
Past 12 months
-
-
-
-
-
-
-
-
-
-
-
-
-
-
-
-
-
-
-
-
-
-
-
Abingdon Court
$2,998,000
Median Price
Past 12 months
Past 12 months
-
-
-
-
-
-
-
-
-
-
-
-
-
-
-
-
-
-
-
-
-
-
-
Abingdon Court
N/A
Avg. Price / ft2
Past 12 months
Past 12 months
-
-
-
-
-
-
-
-
-
-
-
-
-
-
-
-
-
-
-
-
-
-
-
Abingdon Court
N/A
Avg. Price
Past 12 months
Past 12 months
-
-
-
-
-
-
-
-
-
-
-
-
-
-
-
-
-
-
-
-
-
-
-
Abingdon Court
N/A
Median Price
Past 12 months
Past 12 months
-
-
-
-
-
-
-
-
-
-
-
-
-
-
-
-
-
-
-
-
-
-
-


